Dynamics of rice paddies in monsoon Asia during 2000–2015
We generated the annual paddy rice maps during 2000–2015 and quantified the spatial–temporal changes in rice paddy area in monsoon Asia. Figure 1a shows the spatial pattern of rice paddies in 2015 over monsoon Asia at 500 -m spatial resolution. China and India had the largest total area of rice paddies, and together accounted for over half the total rice paddy area in monsoon Asia (Supplementary Fig. 1). Rice paddies were mainly located in the alluvial plains of major rivers in this region, including the Indo-Gangetic Plain in eastern India, Yangtze Plain in southern China, Ayeyarwady Delta in southern Myanmar, and Mekong Basin in Southeast Asia. The rice paddies in monsoon Asia substantially increased from 2000 to 2007, but then decreased from 2007 to 2015 (Supplementary Fig. 2). Geographically, those regions with significant decreasing trends in rice paddy area during 2000–2015 included the Yangtze Plain of southern China and eastern Thailand, while Northeast China and India had significantly increasing trends in rice paddy area (Fig. 1b). These annual maps provide improved data and knowledge of the spatial distribution and interannual variation of rice paddy in monsoon Asia.
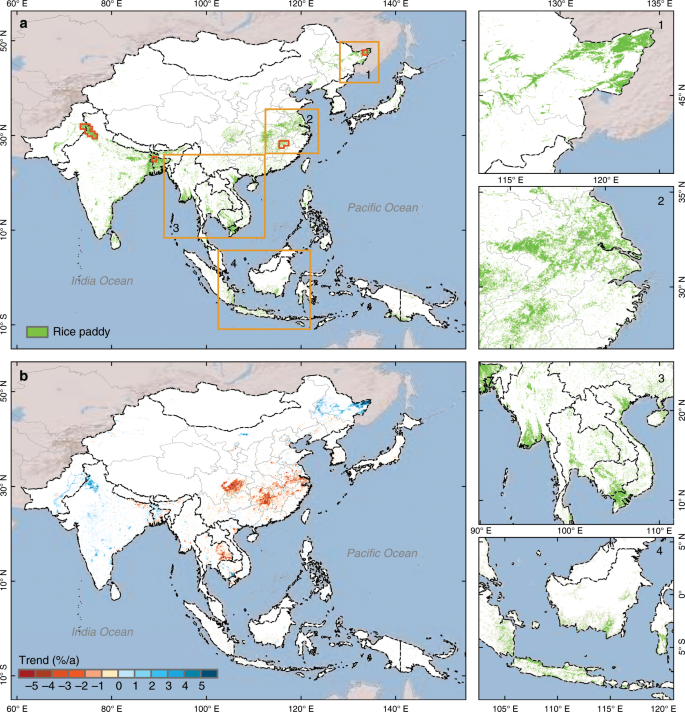
a The paddy rice map was retrieved from MODIS data with 500 -m resolution in monsoon Asia in 2015. b The spatial pattern of trends in rice paddy area at 5 × 5 km gridcells during 2000–2015. 1–4 Detailed spatial distributions of rice paddies in local regions, labeled in a with orange rectangles. The small and red polygons in a are the samples illustrated in Fig. 3. Source data are provided as a Source Data file.
Spatial consistency between rice paddies and XCH4
We investigated the relationships between the MODIS-based paddy rice maps and satellite observed XCH4 in monsoon Asia at various spatial and temporal scales. The spatial distributions of rice paddies were consistent with those of atmospheric CH4 concentration over six 3-year moving-window periods (2003–2005, 2005–2007, 2007–2009, 2009–2011, 2011–2013, and 2013–2015, Fig. 2a–f; Supplementary Fig. 3a–f). Those regions with high densities of rice paddies also had high XCH4. For example, the high densities of rice paddies in Indo-Gangetic Plain in north India, Bangladesh, and the Yangtze Plain and Sichuan Basin in China matched closely with those areas with high XCH4 (Fig. 2a–f; Supplementary Fig. 3a–f).
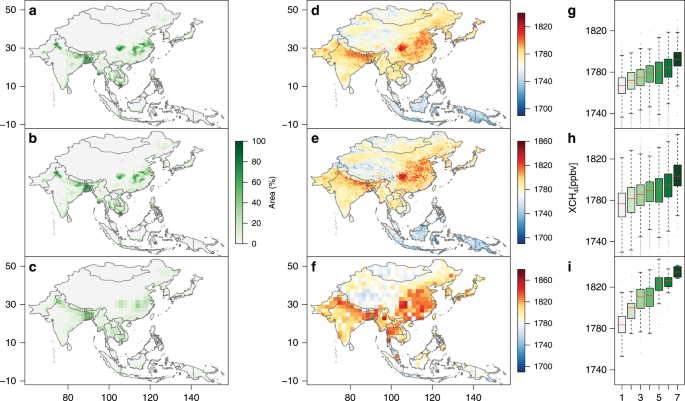
The three periods (2003–2005, 2007–2009, and 2011–2013) were selected in the main text to illustrate the spatial relationships between rice paddies and XCH4. a–c Spatial distributions of 3-year averaged area proportions of MODIS-based paddy rice croplands for 2003–2005 with 0.5° gridcells (a), 2007–2009 with 0.5° gridcells (b), and 2011–2013 with 2.0° gridcells (c). d–f Spatial distributions of 3-year averaged annual column-averaged concentration of CH4 (XCH4) from SCIAMACHY for 2003–2005 with 0.5° resolution (d), 2007–2009 with 0.5° resolution (e), and from TANSO-FTS for 2011–2013 with 2.0° resolution (f). g–i 3-year averaged annual XCH4 for different rice paddy area proportions for 2003–2005 (g), 2007–2009 (h), and 2011–2013 (i). The x-axis values in figures (g–i) represent levels of rice paddy area proportions in monsoon Asia, and 1–7 correspond to <0.5%, 0.5–1%, 1–5%, 5–10%, 10–20%, 20–40%, and >40% rice paddy area proportions, respectively. Source data are provided as a Source Data file.
Different densities (% percentage) of rice paddies within individual gridcells over each of the 3-year periods were divided into seven intervals (a gradient), and the XCH4 within each interval were analyzed. The 3-year mean XCH4 increased as the density of rice paddies rose for all these 3-year periods (Fig. 2g–i; Supplementary Fig. 3g–i). Similar relationships were also found in different seasons in these periods (Supplementary Figs. 4–7). We used the spatial error model (SEM) to quantify their spatial relationships during the six 3-year periods, and the results showed that the density of rice paddies had high spatial correlation with the 3-year mean XCH4 (P-value of coefficients < 0.001, and P-value of Moran’s I test of residuals > 0.3) for all these periods (Supplementary Table 1). It should be noted that clouds and shadows in the inter-tropical convergence zone (e.g., Indonesia and Malaysia) occur frequently (Supplementary Fig. 8), which could affect satellite-based optical images used for paddy rice mapping and XCH4 retrieval. In those areas with frequent cloud cover and shadows, there is potentially a multicollinearity issue in the rice paddy area and XCH4 data. We re-ran the SEM analysis for the other monsoon Asia countries after excluding Indonesia and Malaysia, and the results still showed strong spatial consistency between rice paddy area and XCH4 (Supplementary Figs. 9–12 and Supplementary Table 2). These results suggested that the spatial distribution of rice paddies was one of the major factors that determine the spatial distributions of atmospheric CH4 concentration in monsoon Asia.
Seasonal consistency of paddy rice growth and XCH4
Enhanced vegetation index (EVI) is related to vegetation canopy32 (Supplementary Fig. 13), and has been used to estimate gross primary production of paddy rice33. We used MODIS-based EVI as a proxy for rice plant growth to quantify the seasonal relationship between the paddy rice growth and atmospheric CH4 concentration in a year. We analyzed time series EVI and XCH4 data at selected regions of interest (ROIs) with different rice cropping systems and rice paddy-dominated regions in monsoon Asia.
First, we analyzed the seasonal dynamics of XCH4 and paddy rice growth in four typical ROIs with a high density of rice paddies and different cropping systems (single- and double-cropping systems) (Fig. 3). We calculated mean EVI for all pixels within 0.5° gridcells (EVIall-pixels), mean EVI for all rice paddy pixels within 0.5° gridcells (EVIall-rice), and EVI for one rice paddy pixel with 500 -m resolution (EVIrice). The seasonal dynamics of XCH4 had one peak per year in three regions (Northeast China, northern India, and northern Bangladesh, Fig. 3e–g), and two peaks per year in one region (southern China, Fig. 3h). The consistency in the peak timings of XCH4 and EVI clearly increased from EVIall-pixels to EVIall-rice and EVIrice, suggesting the contribution of rice growth to XCH4. The Sanjiang Plain of Northeast China (Fig. 3a) had a single crop per year, mostly paddy rice. Remarkably, both XCH4 (Fig. 3e) and EVI (Fig. 3i, m, q) had a single peak around August in each year, and the seasonal dynamics of XCH4 corresponded well with those of the three EVI data sets (all of Pearson’s correlation coefficients between EVI and XCH4 during the entire year Ryear ≥ 0.60, P < 0.001, Fig. 3i, m, q). Northern India and northern Bangladesh (Fig. 3b, c) had a double-cropping rotation with winter wheat/rainfed rice and paddy rice in each year according to previous studies34,35. The seasonality of XCH4 (Fig. 3f, g) had only one peak, which corresponded well with the seasonality of paddy rice (the second crop in these regions) in the EVIall-pixel, EVIall-rice, and EVIrice data (Fig. 3 j, k, n, o, r, s, all of the Pearson’s correlation coefficients between EVI and XCH4 during the summer-fall season from May to November R5–11 larger than Ryear). The Poyang Lake region of southern China (Fig. 3d) had a mixture of single rice and rice–rice double-cropping rotations in one year36. The annual XCH4 (Fig. 3h) in this region had two distinct seasonal cycles, which corresponded well with the seasonal dynamics of EVIrice (Fig. 3t). It should be noted that there were no obvious double peaks for EVIall-pixel and EVIall-rice in one year at a coarse spatial gridcell resolution of 0.5° resolution (Fig. 3l, p) due to the mixture of single and double rice cropping rotations in this region. These results suggested that the growth cycle of paddy rice contributed significantly to the seasonality of XCH4.
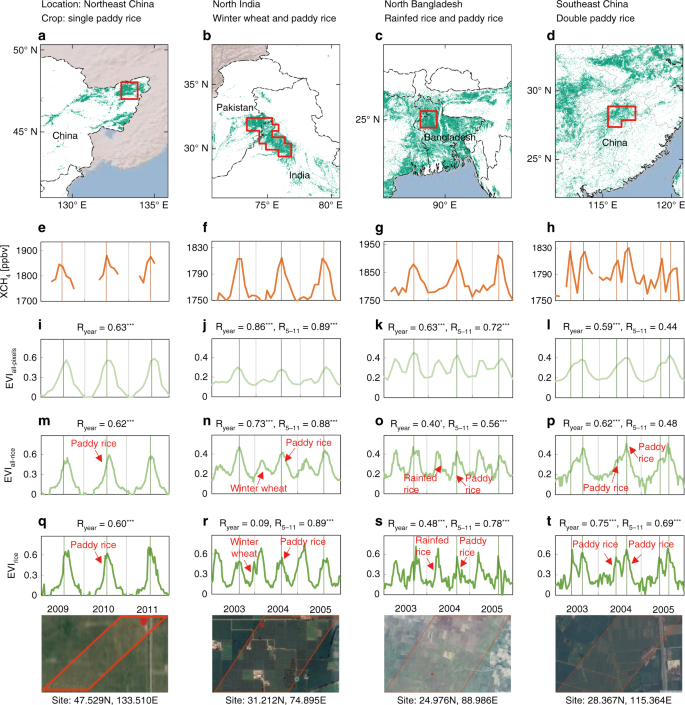
The column-averaged methane concentration (XCH4) and the enhanced vegetation index (EVI) were analyzed in four regions of interest (ROIs) with dense rice paddies and different cropping systems. a–d Spatial distributions of rice paddies retrieved from MODIS data with 500 -m resolution in the Sanjiang Plain of Northeast China in 2010 with single cropping paddy rice (a), North India in 2005 with winter wheat and paddy rice (b), North Bangladesh in 2005 with rainfed rice and paddy rice (c), and Poyang Lake of China in 2005 with early and late paddy rice (d). The four ROIs are shown in Fig. 1a with small and red polygons. e–h Time series of monthly SCIAMACHY CH4 column volume mixing ratios (VMRs, in parts per billion) over the corresponding four ROIs labeled in (a–d) with red polygons. i–l Time series of monthly MODIS-based EVI for all pixels within 0.5° gridcells (EVIall-pixels) over the aforementioned four ROIs. m–p Time series of 8-day EVI values for all 500 m rice paddy pixels within the 0.5° gridcells (EVIall-rice). q–t Time series of 8-day EVI values for one rice paddy pixel with 500 m resolution (EVIrice). The four bottom images are the corresponding landscapes for each rice paddy pixel (q–t) with the extent of 500 m by 500 m from Google Earth. Ryear and R5–11 offer the Pearson’s correlation coefficients between XCH4 and EVI for the whole year and summer-fall season from May to November during the corresponding period labeled in the x-axis of (q–t). ***P < 0.01; *P < 0.10. Correlation coefficients without asterisk are insignificant (P > 0.10). Source data are provided as a Source Data file.
It is well recognized that rice plants play a critical role in the processes of methane production37,38. Several recent in situ studies found a strong correlation between daily CH4 flux and rice plant biomass, which suggested that methane flux in rice paddies is affected by rice growth and development37,38,39,40,41,42,43,44. Here, we compared the observed CH4 emission and EVI at eight paddy rice sites25,26,27,41,42,45,46,47, and the results confirmed their consistency in terms of seasonality (Supplementary Fig. 14). The synchrony of rice growth and CH4 emissions is due to the fact that the rhizodeposition from current season photosynthesis and plant growth controlled the organic matter of the flooded soils, and subsequently determined the methanogenesis in paddy soils38,48,49. Rice plants provide root exudates, which is the important organic matter used by soil microbes for CH4 production in rice paddies37,44. The quantity of root exudates varies during the rice plant growing season, which rises as the rice plants grow, reaches a maximum during the flowering stage with a peak in root biomass, and then decreases (Supplementary Fig. 13, Supplementary Note 1)38.
Although this synchronized peak has been previously found at field site, our results using satellite data show synchrony at large scales for the first time with the aid of high-resolution paddy rice maps. Moreover, the rice cropping systems affected the peaks in XCH4, that is, the XCH4 variation was controlled by the paddy rice growth cycle regardless of whether it was a single- or double-cropping system (wheat–rice, rice–rice) (Fig. 3). The ROI-scale analyses suggested the modeling of the seasonal dynamics of atmospheric CH4 concentration need to consider the rice cropping system (single rice, double rice, or rice plus other crop) rather than general cropping intensity (single, double, or multiple cropping).
Second, we further analyzed the spatial patterns of seasonal consistency between paddy rice growth and XCH4 in monsoon Asia using monthly EVIall-rice and XCH4 at 0.5° gridcells during 2003–2005 (Fig. 4). Figure 4a, b showed the spatial patterns of the Pearson’s correlation coefficients between EVI and XCH4 during the entire year (Ryear) and the summer-fall season from May to November (R5–11) during 2003–2005, respectively. Regions with the same or similar cropping system and planting schedule demonstrated clear relationships between paddy rice growth and XCH4. Most 0.5° gridcells in regions dominated by a single rice crop in a year had statistically significant and positive Pearson’s correlation coefficients between EVIall-rice and XCH4 at both yearly and seasonal scales (Ryear and R5–11), as seen in the Liaohe Plain in China31 (Region 1 in Fig. 4a) and eastern Thailand50,51 (Region 2 in Fig. 4a, Supplementary Fig. 15). Most 0.5° gridcells in regions dominated by double rice cropping systems (rice–rice rotation) also had statistically significant and positive Pearson’s correlation coefficients between EVIall-rice and XCH4 data at both annual and seasonal scales (Ryear and R5–11), as seen in southern China36 (Region 3 in Fig. 4a); however, the area was small due to the limited double-rice croplands52. The 0.5 gridcells in regions with double cropping systems of rice and another crop (e.g., rice and winter wheat) had positive Ryear and R5–11 values, but R5–11 values were obviously larger than Ryear. These results can be seen in North India and Bangladesh34,35 (Region 4 in Fig. 4a, Supplementary Fig. 15), as well as North China53 (Region 5 in Fig. 4a).
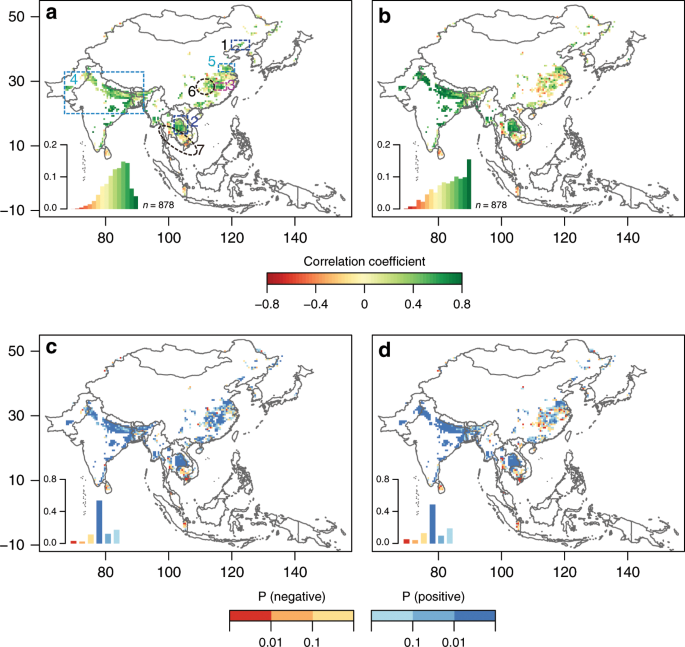
The monthly atmospheric column-averaged methane concentration (XCH4) from SCIAMACHY and the enhanced vegetation index (EVI) from MODIS were analyzed in the dense rice paddy areas of monsoon Asia during 2003–2005. a, b The spatial distributions of Pearson’s correlation coefficients between XCH4 and EVI for the whole year and summer-fall season from May to November, respectively. c, d The spatial distributions of significance levels of Pearson’s correlation between the two for the whole year and summer-fall season from May to November, respectively. The region with a 3-year averaged rice paddy gridcells with area proportion larger than 10% during 2003–2005 is considered here. The insets in (a–d) are the corresponding frequency diagrams of Figure (a–d). Source data are provided as a Source Data file.
The relationships between EVIall-rice and XCH4 data in regions with heterogeneous annual cropping systems and rotation schedules were more complicated and irregular, and the 0.5° gridcells in these regions had non-significant or negative Ryear and R5–11 values. Such complexities were observed in the Yangtze Plain in southern China and western Thailand, which had a mixture of single- and double-rice cropping systems36,50,51,52, and in Cambodia and southern Vietnam, which had a mixture of single-, double-, and triple-rice cropping systems50,54 (Regions 6 and 7 in Fig. 4a; Supplementary Fig. 15). The two measures most likely failed to positively correlate because EVI and XCH4 at 0.5° gridcells could be affected by the heterogeneity of cropping systems, crop types, and rice planting schedules, as well as cloud cover. For example, the Mekong Delta of Vietnam has single-, double-, and triple-rice cropping systems that are either rain-fed or irrigated54. The EVI and XCH4 profiles from this region with mixed cropping systems had irregular seasonal patterns and accordingly weak or negative correlations (Supplementary Fig. 16), which could also be affected by the uncertainty of observed EVI and XCH4 due to intensive cloud cover. A similar result was found for the period of 2005–2007, 2007–2009, and 2009–2011 (Supplementary Figs. 17–19). The significant correlations between EVI and XCH4 in rice paddy areas with the same or similar cropping systems and planting schedules (Figs. 3, 4; Supplementary Figs. 17–19) demonstrated the role of rice paddies in determining the seasonal dynamics of atmospheric CH4 concentration in monsoon Asia.
Our analyses demonstrate that the satellite-observed XCH4 is indicative of CH4 emissions from rice paddies, and paddy rice cultivation dominates the spatial distribution and seasonal dynamics of atmospheric CH4 concentration over those regions with dense rice paddies. This study also shows the importance of annual paddy rice maps for assessing the effects of rice paddies on the spatial pattern and seasonal dynamics of atmospheric CH4 concentration by providing more details on the location and area proportion within gridcells. On one hand, these maps could show area fractional information within the 0.5° and 2° gridcells when analyzing spatial relationship between rice paddy area and XCH4. On the other hand, they allow us to capture the seasonal dynamics of vegetation indices for individual rice paddies (pixels) when analyzing seasonal relationship between them. The temporal statistics of vegetation indices for all pixels within individual gridcells often differ from those for the pure rice paddy pixels (e.g., Fig. 3j, n). The pure rice paddy pixel-based analyses had clear double peaks (EVIall-rice in Fig. 3n), while only one peak was found for all the pixels (EVIall-pixels in Fig. 3j) due to disturbances from other upland crops or natural vegetation types in the gridcells. Although the 500 m paddy rice maps in this study still had mixed pixel issues, this paddy rice product provided unprecedented details on location and area proportion within the 0.5° or 2° gridcells for the entirety of monsoon Asia, in comparison with previous efforts that used county- or province-level paddy rice data14,17,55,56. Therefore, it is necessary to use accurate paddy rice maps at moderate spatial resolution as masks to track seasonal fluctuations of atmospheric CH4 concentration.
In addition to the density of rice paddies within gridcells, our results also demonstrate the importance of the information about rice cropping intensity (single or double) and timing of rice crop calendar within gridcells. The seasonal dynamics of XCH4, which have one or two peaks in a year, mirror paddy rice growth in the areas dominated by single- and double-rice cropping systems (Fig. 3). Together, the accurate information on the locations of rice paddies allow us to fingerprint the effects of rice paddies on atmospheric CH4 concentration, which can reduce influence from other land cover types in the gridcells. Furthermore, the spatial distribution of rice paddies in monsoon Asia has changed substantially since 2000, including a northward shift of rice paddies in China30. Therefore, the methane emission simulations should be conducted with annual maps of rice paddies to more accurately estimate the effects of changing paddy rice distribution on methane emissions since 2000.
Interannual dynamics of rice paddy area and XCH4
Recent increases in atmospheric CH4 concentration since 2007 are not well understood as evidenced by many hypotheses currently debated1,2,3,4,5,6,7,8,9,10,11. Some studies reported that biogenic sources, most notably agriculture, may be the key contributor to renewed growth in atmospheric CH44,5. Rice paddy is one of the main agricultural sources of CH4 emission. In this study, we also investigated whether interannual variations in rice paddy area contributed to the renewed growth of atmospheric CH4 concentration since 2007 at the national and continental scales. We analyzed the interannual variations of XCH4 during 2003–2015 in monsoon Asia, especially China and India, the two countries with the largest rice paddy areas.
The interannual variations in XCH4 in the rice paddy-dominated areas of monsoon Asia, China, and India were relatively stable during 2003–2006, but changed into an increasing trend beginning in 2007 (Fig. 5), which agreed well with the trends of global XCH41. The rice paddy area increased during 2003–2006 in China, India, and monsoon Asia, but after 2007 rice paddy area decreased in China and monsoon Asia and remained stable in India (Fig. 5). The total rice paddy area in monsoon Asia has declined since 2007 over the time period of renewed XCH4 growth. Similar results were also found for the whole region (rice paddy and non-rice paddy areas) of monsoon Asia, China, and India (Supplementary Fig. 20). In theory, if the interannual trends of rice paddy area and the atmospheric CH4 concentration are consistent, we cannot conclude that rice paddy area is the main driver for the regrowth of atmospheric CH4 concentration since 2007. If their trends are opposite, we can conclude that the rice paddy area is not the main driver for the regrowth of atmospheric CH4 concentration. The decreasing trends of rice paddy area and the increasing trends of atmospheric CH4 concentration in both the rice paddy-dominated areas and the whole area since 2007 suggested that the change in rice paddy area was not the main driver for the renewed increase of atmospheric CH4 concentration. A study using atmospheric methane observations and an atmospheric transport model reported that the annual methane emission has not significantly changed in India during 2010–2015 and the major CH4 sources (ruminants, rice paddies, waste, and fossil fuels) did not much change57, which is in line with the stable rice paddy areas in India from this study during the same period (Fig. 5). Another country-scale study showed that rice paddies did not contribute to the increase of atmospheric CH4 concentration in China and India during 2010–2015 using the emission estimates from the inverse model and the spatial distribution of different source sectors within the EDGAR emissions inventory58, which agrees with our result from 2010–2015 (Fig. 5). Our study at monsoon Asia scale suggests that the renewed growth of atmospheric CH4 concentration was unlikely attributed to the dynamics of rice paddy area.
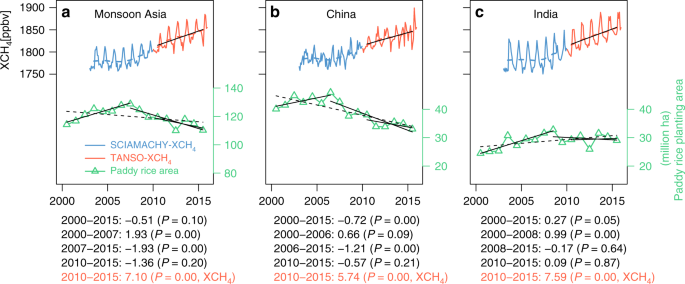
Temporal (seasonal and interannual) dynamics of atmospheric column-averaged methane concentration (XCH4) over rice paddy-dominated regions and interannual variations in MODIS-based rice paddy areas during 2000–2015 in monsoon Asia (a), China (b), and India (c). The curves above are time series of monthly SCIAMACHY CH4 column volume mixing ratios (VMRs, in parts per billion) during 2003–2009 and monthly TANSO-FTS CH4 column VMRs during 2010–2015. The XCH4 outliers in winter have been removed. The blue and red dashed lines are average annual values of SCIAMACHY XCH4 and TANSO-FTS XCH4, respectively. The black lines and black dashed lines below indicate trends of rice paddy area for different periods in monsoon Asia, China, and India. The rice paddy-dominated regions are shown in Supplementary Fig. 35. The linear trends and its significance levels for different periods are shown below the panels; the formulas in black color are for paddy rice planting area, and the formula in red is for XCH4. Source data are provided as a Source Data file.
What factors drove the interannual variations of atmospheric CH4 concentration since 2007 is still a hotly debated issue1,2,3,4,5,6,7,8,9,10,11, as CH4 emissions are controlled by multiple sources and sinks. At the rice paddy fields, there are several factors which could affect its methane emission, including paddy rice planting area, cropping system, yield, management (e.g., irrigation, fertilization), and rice varieties14,59. For the first time, our study shows the fingerprint of rice paddies in the spatial distribution and seasonal dynamics of atmospheric methane concentration by using unprecedented annual paddy rice maps. We are not in position to do a full-scale (multivariate) attribution analysis on the question why atmospheric XCH4 increased again after 2007, thus a thorough explanation of the renewed growth in XCH4 since 2007 needs further study.
Potential of annual paddy rice maps for CH4 models
To our knowledge, our annual maps of rice paddies in monsoon Asia during 2000–2015 are the first of its kind and are likely to have significant implications for simulations of biogeochemical models and atmospheric chemistry and transport models. Several empirical and process-based biogeochemical models have been used to predict CH4 emissions from rice paddies13,14,55,56,60. However, most of the estimates of rice paddy CH4 emission from those models were generally driven by rice paddy data from agricultural statistical sources such as province- or county-level administrative units13,14,59,60,61, which led to a large spatial uncertainty in estimates of rice paddy CH4 emission. For example, Zhang et al.60 estimated CH4 emission from rice paddies at the global scale based on inundation areas, statistical data, and additional cropland masks. However, the methane emission estimates in some regions with dense rice paddies were missed due to inaccurate rice paddy distribution information, such as the northwest of Indo-Gangetic Plain in India and Pakistan. The annual maps of rice paddies at moderate spatial resolution in this study offer new opportunities to improve simulations of biogeochemical models for CH4 emission from rice paddies.
The improved estimates of CH4 emission fluxes with high-accuracy annual paddy rice maps could then be used by atmospheric chemistry and transport models to study the spatial and seasonal consistency between atmospheric CH4 concentration and rice paddies, as well as the relative contribution of rice paddies to the interannual dynamics of atmospheric CH4 concentration. These new paddy rice maps will likely shed new light on the role of rice paddies in atmospheric CH4 concentration and represent a critical step for improving the understanding of long-term dynamics of atmospheric CH4 concentration.
Agricultural emissions account for more than half of the total CH4 emissions budget in monsoon Asia, of which one-third is estimated to originate from rice paddies13. Using annual paddy rice maps at 500-m spatial resolution and spaceborne XCH4 data in monsoon Asia, this study clearly characterizes the fingerprints of rice paddies in the spatial distribution and seasonal dynamics of atmospheric CH4 concentration over the dense rice paddy regions. It highlights an important impact of rice agriculture on the spatial and seasonal patterns of regional atmospheric CH4. The observed changes in the spatial distribution of rice paddies in monsoon Asia during 2000–2015 do warrant urgent and further use of the annual paddy rice maps in biogeochemical model simulations. Considering the fertilization effect of global rising atmospheric CO2, climate change, and projected increases in demand for rice in the coming decades, CH4 emissions from rice production is expected to rapidly increase15, possibly leading to stronger effects on the variability of atmospheric CH4 at various spatial and temporal scales. This study also provides new insight to the debates on the driving factors for the renewed growth of atmospheric CH4 concentration since 2007 from the perspective of paddy rice planting area; and the results show the inconsistent interannual variations of rice paddy area and XCH4. However, considering the complexity in the CH4 emission and atmospheric transport, more methane sources and sinks should be considered for a thorough explanation of the renewed growth of atmospheric CH4 concentration since 2007.
Source: Ecology - nature.com
