Connection between fungal enzyme profile relatedness and phylum taxonomy
After genome filtering and prediction of secreted proteins, the secretomes of 465 Dikarya fungi (Ascomycota and Basidiomycota) were obtained. From the predicted secretomes, the CUPP method was used to annotate each protein with CAZyme family and corresponding function (EC number), and subsequently create the “Function;Family” CAZyme profile of all the secreted carbohydrate-active enzymes for each species. These profiles were arranged in a binary observation matrix with the rows outlining the fungal species and each column representing a particular “Function;Family” observation (presence or absence). From this observation matrix, a distance matrix was constructed using the Yule dissimilarity score to determine the distances between the individual fungal species based on their enzyme profile similarity, allowing assessment of enzyme profile relatedness (EPR). The species were visualized in a two-dimensional space based on the calculated distance by multidimensional scaling (MDS) (Fig. 1).
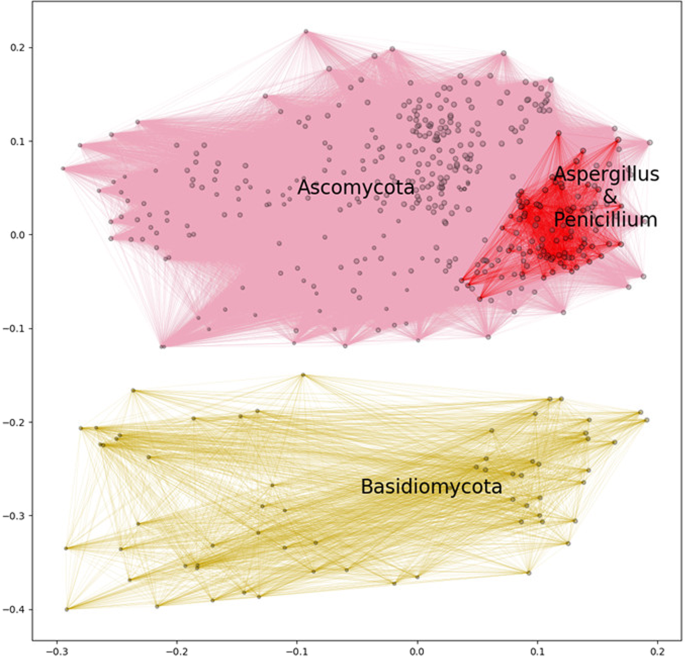
Map of selected fungi based on their predicted secreted CAZyme inventory presented as a multidimensional scaling plot. Similarity mapping of secreted “Function;Family” annotated carbohydrate active enzymes from 465 representative genomes of species of Dikarya visualized in two-dimensional space. In total 295 different enzyme “Function;Family” observations were identified. The relative sizes of the dots represent the number of different enzyme “Function;Family” observations, ranging from 40 to 144, in each genome analyzed. The distances were calculated using Yule distances based on in silico annotated carbohydrate active enzyme protein families combined with in silico prediction of enzyme function, represented by their respective EC number (if available). The clusters that represent members of the Ascomycota and Basidiomycota phyla, respectively were defined by hierarchical clustering of the calculated distances among the genomes using a flat clustering threshold of 0.7. For illustrative purposes, all species in each of these two phylum clusters are connected with pink and yellow lines, respectively. The cluster defining Aspergillus and Penicillium, containing 95 species, was based on a threshold of 0.3. All the Aspergillus and Penicillium species are connected with red lines. The coordinates were obtained by conducting 50,000 different initiations and shown as the map with the smallest final stress.
From the assessment of about 50,000 secreted CAZymes a total of 295 different “Function;Family” observations were found. The span of different enzyme “Function;Family” observations found in a single genome ranged from 40 in opportunistic human pathogenic Trichosporon spp. to 144 in the plant pathogenic Diaporthe spp. This analysis showed that enzyme profile relatedness separated the individual species of Ascomycota and Basidiomycota into their respective phyla by forming two separate and distinct clusters (Fig. 1). Furthermore, within the Ascomycota cluster, the multidimensional scaling analysis placed all species belonging to Aspergillus and Penicillium together in a compact sub-cluster, i.e. where the species of these two genera are adjacent to one another. This analysis suggests a first connection between the CAZyme secretome profile and the fungal taxonomy.
CAZyme profiles in relation to taxonomy of Aspergillus and Penicillium
The two large and complex genera, Aspergillus and Penicillium, were selected to further test the hypothesis, that EPR analyses, by enzyme “Function;Family” observations would give a grouping congruent with lower taxonomic classification levels, i.e. genus, section and species. In the same way as described above for Dikarya, we took as a starting point the genome-predicted CAZyme secretomes (about 10,000 proteins in total) for Aspergillus and Penicillium, and outlined the enzyme “Function;Family” observations. Then, we employed Yule distances to assess whether the grouping of such genome-predicted enzyme observations, i.e. an enzyme profile relatedness comparison, would create a map that corresponds to fungal taxonomy and phylogeny. The strains belonging to the same species had very little, if any distance between them, analogously, species of the same section were also placed closely together (Supplementary Material, Fig. S1). Based on the enzyme profile relatedness observations, a map was constructed as a circular dendrogram and combined with the taxonomy of the 95 representative species of Penicillium and Aspergillus (Fig. 2), with few taxonomical corrections (Supplementary Material, Table S1a–e).
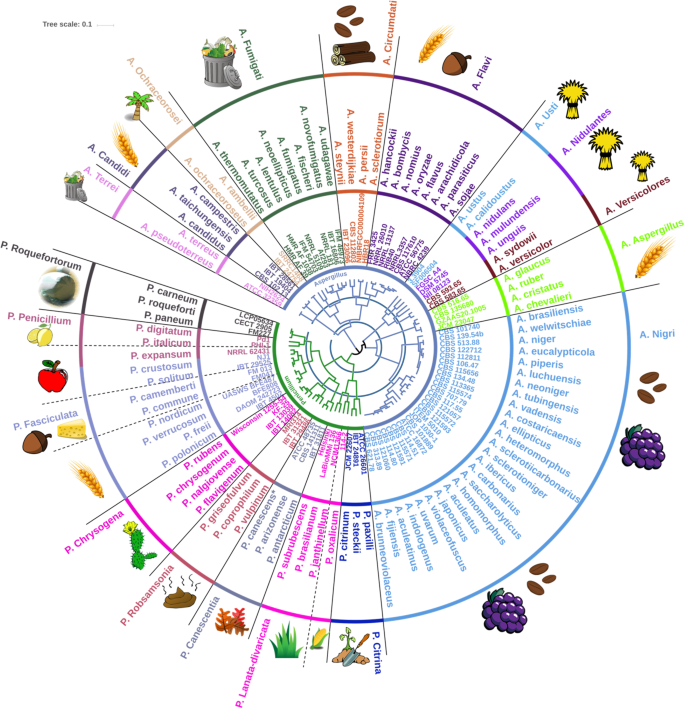
Circular dendrogram representing the secreted carbohydrate active enzyme profile relatedness, EPR, of Aspergillus and Penicillium presented with one representative genome of each of the fungal species. The distances are based on binary absence or presence assessment of “Function;Family” observation matches of the in silico predicted CAZyme secretomes from the genomes using Yule dissimilarity. The blue rings concentrically dividing the EPR-based dendrogram in the middle indicate the scale and have a spacing of 0.15 (innermost) and 0.3 (outermost). Circulating the dendrogram, the labels are associated to the individual genomes, as genus, strain or isolate number, species, and section, respectively. A dashed line indicates sections having members with diverse habitats or an adjacent section whose members share the same habitat. The stylized images in the outermost area indicate the primary natural habitat (or ecological specialization) of the fungal species: Clockwise description of images as they first appear, starting from section A. Terrei: Compost, dry Cereal, Tropical plants, Coffee, Wood, Nuts, Hay, Grapes, Plant soil, Maize, Grass, Fallen leaves, Dung, Desert plants, Cheese, Apple, Citrus and Silage. A dashed line indicates a section having more than one primary habitat. The asterisk on P. canescens indicates a revision of incorrect P. capsulatum species identification (see Supplementary Material, Fig. S2).
To obtain groupings of species (illustrated in Fig. 2), two different cut-off values were selected at 0.15 and 0.3, respectively, from the center of the dendrogram as indicated by the two blue rings. The innermost blue ring divides the members of the genus Penicillium into two distinct groups, one including the sections Citrina and Lanata-divaricata and the other including the remaining Penicillium sections. Furthermore, the innermost blue ring divides the genus Aspergillus into five groups: One including the section Nigri; one including the section Aspergillus; one including the sections Usti, Nidulantes and Versicolores; one including the sections Flavi, Circumdati, Fumigati and Ochraceorosei; and finally one including the sections Candidi and Terrei. The second cut-off at 0.3 gave the second blue ring, which forms 19 groups. Of these, nine of the groups correspond to the fungal taxonomic sections, namely: A. Aspergillus (is short-hand for section Aspergillus in genus Aspergillus (=A.)), A. Candidi, P. Canescentia, A. Circumdati, P. Fasciculata (including P. expansum of section P. Penicillium), A. Flavi, A. Ochraceorosei, A. Terrei and A. Versicolores. Furthermore, A. Fumigati, P. Lanata-divaricata, and A. Nigri each divided into two adjacent groups, i.e. in each case corresponding to the same fungal taxonomic sections if combined. Hence, the enzyme profile relatedness mapping was in complete accord with the fungal taxonomy for these 12 sections. The remaining fungal sections in general also grouped according to their taxonomy, although a few discrepancies were evident. Notably, the two sections P. Chrysogena and P. Robsamsonia as well as the sections P. Roquefortorum and P. Penicillium (without P. expansum), respectively, were found in one group, and were thus not separated by this enzyme profile relatedness grouping. However, with a slightly altered cut-off value, they would not be divided and would thus group correctly according to taxonomic section (Fig. 2).
Interestingly, P. expansum is located deeply within the Fasciculata section, close to P. crustosum, instead of within the Penicillium section as expected according to phylogenetic assessment (Supplementary Material, Fig. S3). In addition, even though the sections Nidulantes and Usti were divided into two adjacent groups, A. nidulans landed in the Usti section rather than in the Nidulantes section, but these sections are taxonomically quite closely related. Hence, despite these minor discrepancies, the comparison of the CAZymes secretome grouping and fungal taxonomy of Aspergillus and Penicillium (Fig. 2) provides evidence for a stunningly high degree of consensus between the CAZymes secretome EPR of the individual fungal species and their respective taxonomic grouping.
Elucidating the group-forming EPR observation patterns
In order to elucidate the underlying reason for the strong congruence between the EPR based grouping and the taxonomy and phylogeny of Penicillium and Aspergillus (Fig. 2), several additional assessments were performed based on analysis of the enzyme “Function;Family” observations.
Interestingly, during the analysis, it was discovered, that all analyzed fungal species of Penicillium and Aspergillus share 24 enzyme “Function;Family” observations. These enzymes included laccase (EC 1.10.3.2 of AA1), LPMOs (AA9 and AA11), several glucanases of different GH families, and a number of other glycoside hydrolases belonging to families GH16, GH17, GH18, GH43, GH72, GH76, and GH132, in addition to two pectin lyases, PL1 (EC 4.2.2.10) and PL4 (EC 4.2.2.23) (Supplementary Table S2). From this, we conclude that all species of Penicillium and Aspergillus have a core set of genes encoding primarily plant cell wall degrading enzymes.
To elucidate the diversity in observations within and between the EPR groupings (Fig. 2) a measure of the total observations, and their presence and absence in the different fungal sections was determined (Table 1). This analysis made it evident that the grouping of the fungal sections appears to be formed by the observations they have in common as well as by the observations they share the absence of (Table 1).
Furthermore, based on all the enzyme “Function;Family” observations upon which the dendrogram (Fig. 2) was established, the Aspergillus and Penicillium section could be assigned to one of three types of enzyme profiles (CAZyme secretome profile type), namely type I-III, depending on their enzyme diversity capacity (Table 1). Four sections in Aspergillus, namely Circumdati, Flavi, Fumigati, Nigri and one in Penicillium, namely Lanata-divaricata, were assigned to the strong enzyme producers, Type I. These Type I EPR secretomes were grouped together primarily by the enzyme observations whose presence they share. Four sections, namely A. Aspergillus, A. Candidi, A. Ochraceorosei and P. Roquefortorum, were assigned as weak enzyme producers, enzyme profile Type III. Notably, the Type III sections were primarily grouped together by the EPR secretome observations whose absence they share. The remaining 10 sections, grouped as Type II, are categorized as moderate enzyme producers. For these sections, the groupings appeared to be a result of an almost even weighting of the enzyme observations whose presence they share versus those enzyme observations whose absence they share.
Interestingly, the sections categorized as Type I, contained both a larger number of different observations than Type III, i.e. the larger number leading to different enzyme functions (EC numbers), and also had the same function spread over a higher number of different families than the Type II and Type III enzyme profiles (“Function overlap between families”, Table 1). In contrast, the fungal sections categorized as weak enzyme producers, Type III, were found to have only a low function overlap between families meaning that the genomes of Type III members only in rare cases encode more than one family having a particular EC function. When assessing the total number of observations in the A. Nigri section, the diversity among the species appeared to be higher than that found in the other sections. However, the A. Nigri was also by far the largest section containing 28 different fungal species. With the exception of the large and quite diverse A. Nigri section, all members of each individual section were found to share 50% or more of their enzyme observations, indicating a high degree of homogeneity among the members of the same section. Such high enzyme profile homogeneity within the majority of the fungal sections support that members of a section share a common arsenal of CAZymes, which are likely to be related to their habitat specialization (Fig. 2).
Elucidation of EPR-grouping of fungi in relation to habitat specialization
In general, the EPR grouping divided the fungi correctly into their taxonomical sections and this grouping simultaneously organized the fungal species according to their respective habitat specialization (Fig. 2). This finding means that the CAZyme profiles, typically based on approximately 100 CAZyme observations per fungus, can categorize fungi in accordance with their taxonomy. This indicates that fungi are indeed associated to their preferred habitat via their carbohydrate utilization ability (Fig. 2).
However, inspection of the habitat substrates, revealed that members within e.g. four of the sections, A. Candidi, A. Flavi, A. Aspergillus, and P. Fasciculata, that were otherwise spaced apart, appeared to have similar habitat specialization, namely towards dry cereal substrates (Fig. 2). To understand why these sections were divided by EPR grouping despite having similar substrate preferences, the differences in enzyme profile observations among these four sections were analyzed further (A. Aspergillus, A. Candidi, A. Flavi and P. Fasciculata, Fig. 2).
As summarized in Table 2 the most apparent differences contributing to the EPR profile discriminations are that the species in the same section either mainly share a similar set of enzyme observation or share the absence of such enzyme observations (indicated by the orange boxes, Table 2). Hence, EPR profiles distinguish the fungal sections (and species) by a combination of both the “Function;Family” observations the members of the section all have, and the observations, they share the absence of.
The species within all four sections have a large arsenal of enzymes active on cellulose. The species of the sections A. Flavi and P. Fasciculata essentially have similar cellulosic enzyme regime, and the differences in enzyme profiles among cellulose-active enzymes are small in the other two sections, thus the taxonomy of the fungi does not immediately appear to be explained by their capability to degrade cellulose. However, all species of section A. Aspergillus lack GH16 type endo-1,3(4)-β-glucanase (EC 3.2.1.6) and the GH6 1,4-β-cellobiosidase (non-reducing end) EC 3.2.1.91, whereas the other three sections have these two observations represented in their genomes. All species of A. Candidi lack GH1 β-glucosidase (3.2.1.21), but possess the GH3 family enzyme.
The greatest variation between the four sections analyzed based on their enzyme profiles, appears to be with regard to the variation in the pectin-associated enzyme observations (Table 2). More specifically, there is a general trend towards either all members of a section having a particular “Function;Family” observation or none of them having it. This finding can directly explain why the species could be organized so well in their respective sections. The two sections A. Aspergillus and A. Candidi lacked about half of the pectin-associated observations, whereas A. Flavi had them all. The A. Flavi section distanced itself by having two α-L-rhamnosidase (EC 3.2.1.40) from both family GH28 and GH78 whilst members of any of the three other sections generally lacking both (the exception being P. nordicum which encodes a GH78 EC 3.2.1.40 protein).
A large variation was apparent for the EPR profiles related to xylan modification. The analysis revealed a maximum variability for the enzyme observations designating acetyl xylan esterase (EC 3.1.1.72) of family CE1 and CE5 in relation to their shared presence and absence in the four sections. A. Candidi had both CE1 and CE5 (EC 3.1.1.72), whereas A. Flavi members encoded CE1 (except one of the species) but not CE5, whilst P. Fasciculata only encoded CE5, and finally A. Aspergillus encoded no acetyl xylan esterases at all (Table 2). A large variation among the α-arabinofuranosidase functions (EC 3.2.1.55) was also evident, and likely contributed to the discrimination. Hence, CUPP identified presence of EC 3.2.1.55 from GH51 and GH62 in all sections; but, similarly to the acetyl xylan esterase case, the EPR profiling showed maximum variability for the EC 3.2.1.55 GH43 and GH54. Thus, members of the A. Flavi section encoded both, all members of A. Candidi encoded GH43 but not GH54, and all members of P. Fasciculata had GH54, and generally not GH43 (only one member encoded for GH43), whereas A. Aspergillus encodes none of these (Table 2). Families with the highest number of different molecular functions have the potential to contribute most to the phylogenetic and phenetic differentiation. In the data set two families, GH5 and GH28, have the highest number of molecular functions.
Source: Ecology - nature.com
