Macroscopic characteristics of RD in spatial pattern
Spatial statistics suggested that RD was distributed in every province-level municipality in southwest China, with the specific area proportions derived as 12.09% in Guizhou, 7.30% in Guangxi, 5.32% in Yunnan, 2.90% in Chongqing, 1.59% in Hunan, 1.44% in Hubei, 0.85% in Guangdong, and 0.45% in Sichuan in a descending order (Fig. 5). But in terms of the sum of RD coverage, the three leading provinces are Guizhou, Yunnan, and Guangxi, particularly in their southwest, east, and northwest, respectively (Fig. 1a). Spatial statistics also indicated that at the county level, RD is distributed in 66.06% of the counties in southwest China, with the largest RD area proportion per county reaching 44.10%. For the whole southwest China, the average RD area proportion per county is 3.60%. Overall, in view of macroscopic pattern, the spatial distribution of RD occurrences in southwest China is like a bird just spreading its two swings, taking over the central north-south axis of the whole region but heading toward the northeast direction to some extent.
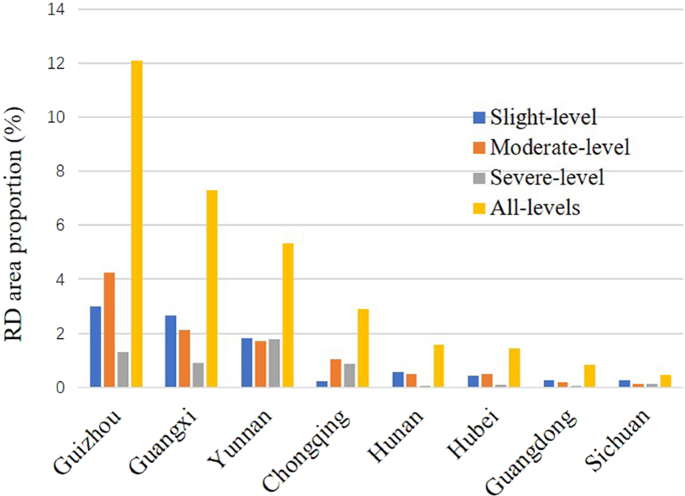
Boxplots of RD area proportion per county for the eight province-level municipalities in southwest China, derived by statistics in terms of slight-, moderate-, and severe-level, as well as their totality (all-levels).
Specifically for the RD distributions at the prescribed severity levels, their macroscopic patterns in southwest China are similar but shrink in area from the slight to severe level. First, the occurrences of the slight-level RD are primarily clustered in the central and south parts of Guizhou and the central part of Guangxi. Totally, the slight-level RD occurs to 64.36% of the counties in southwest China, with the largest RD area proportion per county reaching 25.32%, and its mean RD area proportion per county is 1.78%. Next, the moderate-level RD is mainly distributed in the south central part of Guizhou, the east part of Yunnan, and the central and west parts of Guangxi. The RD landscape of this level is distributed in 62.27% of the counties in southwest China, with the largest RD area proportion per county decreasing to 21.79%, and its average RD area proportion per county reducing to 1.15%. Finally, the severe-level RD is merely scattered in the east part of Yunnan. The RD lands at this level appear in 53.52% of the counties across southwest China, with the largest RD area proportion further decreasing to 17.70%, and its average RD area proportion cuts down even to 0.66%.
Macroscopic characteristics of impact factors in spatial pattern
Geologic factors
The first geologic factor of carbonate rock in southwest China is primarily distributed in the intersection of Yunnan, Guizhou, and Guangxi, also stretching to the joint region between east Chongqing and west Hubei (Fig. 2a). The macroscopic spatial pattern of carbonate rocks in terms of area proportion in each county (Fig. 2b) is quite like the scenario of RD (Fig. 1a). Correlation analyses showed that carbonate rock and RD in area proportion per county has an obvious statistically significant positive correlation (R = 0.68, p < 0.0001), and this inference is also valid for the RD scenarios at the different severity levels (slight-level: R = 0.69, p < 0.0001; moderate-level: R = 0.62, p < 0.0001; severe-level: R = 0.42, p < 0.0001).
The second geologic factor of fault occurs widely over southwest China, with its densest distributions locating in Yunnan (Fig. 2c). The macroscopic spatial pattern of faults in terms of fault density in each county is decreasing from southwest to northeast (Fig. 2d), intuitively with a large difference from the scenario of RD (Fig. 1). Correlation analyses told that there is a statistically significant positive correlation (R = 0.38, p < 0.0001) between fault density and RD area proportion per county. As regards to the RD scenarios at the different severity levels, this rule still comes true (slight-level: R = 0.39, p < 0.0001; moderate-level: R = 0.35, p < 0.0001; severe-level: R = 0.30, p < 0.0001).
Climatic factors
In southwest China, the first climatic factor of annual mean temperature in macroscopic spatial pattern is decreasing from southeast to northwest in a relatively smooth way (Fig. 3a). Correlation analyses suggested that no statistically significant correlation (R = −0.056, p = 0.12) exists between this climatic factor and RD area proportion per county, nor do the peculiar RD scenarios at the three severity levels.
Next, annual mean diurnal temperature range in spatial pattern is dropping from west to east, with a distinctive step change (Fig. 3b). The western part of the study region possesses a high diurnal temperature range, while the central and east parts demonstrate relatively smaller temperature difference between day and night. Correlation analyses indicated that there is no statistically significant correlation (R = −0.062, p = 0.088) between this climatic factor and RD area proportion per county, neither do the RD scenarios at the three severity levels. However, a weak negative correlation can still be distinguished in the RD scenario at the slight severity level (R = −0.12, p = 0.0009).
The third climatic factor of annual temperature range in spatial pattern is increasing from southwest to northeast in a smooth way (Fig. 3c). Correlation analyses showed that there is a statistically significant negative correlation (R = −0.14, p < 0.0001) between this climatic factor and RD area proportion per county, similar with the slight- and moderate-level RD scenarios (slight-level: R = −0.23, p < 0.0001; moderate-level: R = −0.13, p = 0.0003) but different from the severe-level RD situations (R = −0.062, p = 0.086).
Annual mean precipitation in macroscopic spatial pattern is decreasing from southeast to northwest, but with a local area as an exception to this rule in the southwest Yunnan (Fig. 3d). After correlation analyses, no statistically significant correlation (R = −0.054, p = 0.13) between this climatic factor and RD area proportion per county emerged, nor for the three kinds of RD sub-scenarios.
Maximum monthly continuous precipitation in macroscopic spatial pattern is decreasing from southeast to northwest, but with several local areas such as southwest Yunnan, northeast Sichuan, and south Hunan as exceptions (Fig. 3e). Correlation analyses revealed that there is no statistically significant correlation (R = −0.099, p = 0.006) between this climatic factor and RD area proportion per county, even worse for the slight- and moderate-level RD scenarios. However, for the severe-level RD situation, there exists a weak negative correlation (R = −0.14, p = 0.0002).
Annual mean humidity in macroscopic spatial pattern is dropping from east to west, with a distinctive step change along the imaginary line drawn from central Sichuan to east Yunnan (Fig. 3f). The high values of this climatic factor mainly appear in Chongqing and east Sichuan. Correlation analyses found no statistically significant correlation (R = 0.034, p = 0.35) between this climatic factor and RD area proportion per county, and nor did for the three RD scenarios at different severity levels.
Annual mean wind speed in spatial pattern is a little approximate to a ‘U’ shape. The low values of annual mean wind speed in southwest China appear in the right north of the whole study region, including Chongqing, east Sichuan, west Hubei, west Hunan, and north Guizhou. Correlation analyses concluded that there is no statistically significant correlation (R = 0.016, p = 0.66) between this climatic factor and RD area proportion per county, and the same effects occurred to the three RD sub-scenarios at the slight, moderate and severe levels.
Anthropogenic factors
The first anthropogenic factor of population number in macroscopic spatial pattern is in a clustered way, i.e., each of the province-level municipalities presenting one or more clusters (Fig. 4a). Correlation analyses inferred that no statistically significant correlation (R = −0.079, p = 0.029) exists between this anthropogenic factor and RD area proportion per county, nor do the three RD scenarios at different severity levels.
For the second anthropogenic factor of population density, its clustered spatial pattern is more obvious, namely, the clustering centers can be more easily recognized in each province (Fig. 4b). Correlation analyses told that there is a statistically significant negative correlation (R = −0.13, p = 0.0002) between this anthropogenic factor and RD area proportion per county, and this rule is also roughly valid for the three RD sub-cases (slight-level: R = −0.13, p = 0.0003; moderate-level: R = −0.12, p = 0.001; severe-level: R = −0.086, p = 0.018).
In southwest China, GDP in macroscopic spatial pattern briefly obeys the characteristics of population number in each county, also with the approximate clustering centers (Fig. 4c). Correlation analyses exposed that no statistically significant correlation (R = −0.080, p = 0.026) can be detected between this anthropogenic factor and RD area proportion per county, nor can for the three peculiar RD sub-scenarios.
GDP per capita in macroscopic spatial pattern is like a mirrored one against the pattern of RD (Fig. 4d). Correlation analyses presented that there is a statistically significant negative correlation (R = −0.19, p < 0.0001) between this anthropogenic factor and RD area proportion per county. The three RD sub-scenarios at the different severity levels work in the same way. The reason is that the larger the scope of RD distribution is, the more people’s livelihood is affected, and so, people tend to gather in areas that are easier to earn a living.
Macroecological relationships between RD and impact factors
In exploring the macroecological relationships between the RD distribution in southwest China and the three kinds of impact factors, dominance analyses derived the contributions of the latter ones in influencing the former one (Fig. 6a). The predominant five impact factors in a descending order include carbonate rock area (contribution = 30.77%), fault density (11.29%), annual mean diurnal temperature range (6.14%), annual temperature range (6.10%), and GDP per capita (5.84%). This suggests that at the macro scale, the most critical kind of influencing forces to RD is geological factors.
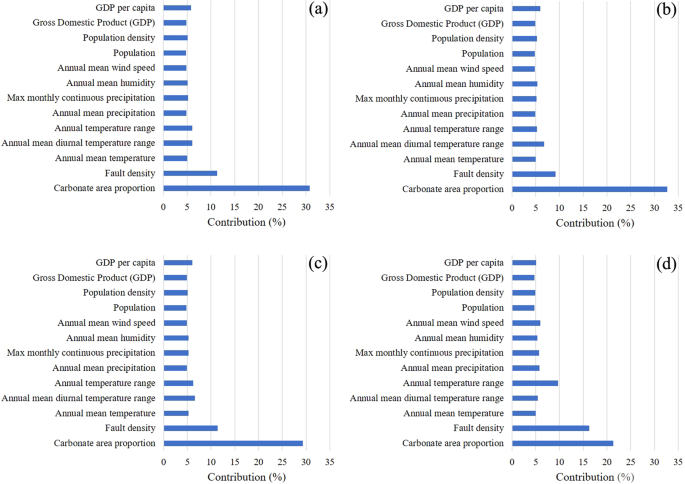
Contributions of the prescribed 13 impact factors to RD in southwest China, derived in terms of (a) all-levels RD and its (b) slight-, (c) moderate-, and (d) severe-level scenarios.
For the slight-, moderate- and severe-level RD sub-scenarios, the key five impact factors were individually determined based on the same approach of dominance analysis and listed in a descending order: (1) slight-level RD: carbonate rock area (32.66%), fault density (9.17%), annual mean diurnal temperature range (6.79%), GDP per capita (6.01%), and annual mean humidity (5.35%) (Fig. 6b); (2) moderate-level RD: carbonate rock area (29.33%), fault density (11.4%), annual mean diurnal temperature range (6.57%), annual temperature range (6.27%), and GDP per capita (6.06%) (Fig. 6c); (3) severe-level RD: carbonate rock area (21.33%), fault density (16.27%), annual temperature range (9.70%), annual mean wind speed (5.98%), and annual mean precipitation (5.82%) (Fig. 6d).
The results indicated that for the four concerned scenarios different arrays of the factors take the predominant roles in drawing the macroecological patterns of RD in southwest China. However, there are still some common rules that can be derived. By and large, the carbonate rock area- and fault density-represented geologic factors play the first role; the climatic and anthropogenic factors take the second and third places; the anthropogenic factors show their effects in a weakening way from the slight-level RD scenario to the severe-level one, and this mode is evidenced by the factor sequence obtained in the all-levels RD scenario.
Overall, we concluded that geologic factors leadingly drew the macroecological patterns of RD in southwest China, for the four scenarios of slight-, moderate-, and severe-level RD as well as their totality. This inference seems to be contrasting with the popular awareness that anthropogenic factors such as human activities and land uses shall be first responsible for the RD-relevant losses1,2,6,11,19. The discussions of this differing-from-tradition inference, regarding its origin, physics, uncertainties, future works, and implications, were carried out as follows.
Source: Ecology - nature.com
