Environmental sampling and profiling during autumn overturn
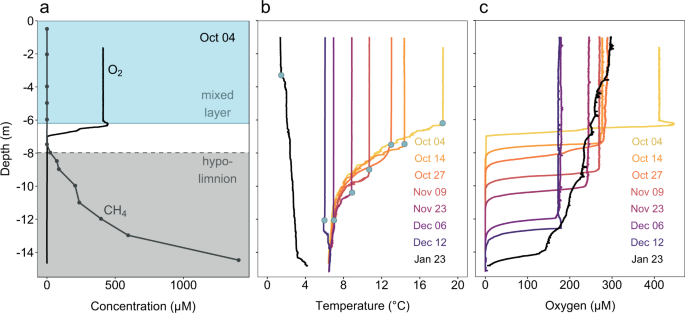
A temperate holomictic lake, Rotsee (47.072 N and 8.319 E) in Central Switzerland was sampled on 8 dates from Oct 4, 2016 to Jan 23, 2017 (see Fig. 1). Eutrophic lake Rotsee is situated at 419 m a.s.l., has a maximum depth of 16 m, is 2.5 km long and about 200 m wide28. Our sampling period covered the end of stratification with maximal methane accumulation in the hypolimnion and the subsequent autumn overturn. A moored thermistor chain with 1 m resolution provided temperature measurements every 3 h, documenting the mixing process and serving as a basis for scheduling the sampling dates. We defined the mixed layer depth as the part of the water column with a uniform temperature profile. At each sampling date, continuous profiles of temperature and oxygen (PSt1, Presens, Regensburg, Germany) were measured with the profiling in situ analyzer (PIA) as described previously29. Sampling depths for further analyses were set based on the PIA profiles. The PIA was equipped with a syringe rosette sampler (12 × 60 ml) for targeted depth sampling at 25 cm resolution, integrating about 5 cm water column, allowing for improved resolution compared to conventional Niskin bottle sampling, which integrates over >50 cm. Per depth six syringes were triggered to retrieve enough volume for different analyses.
Water samples for analysis of nitrate and dissolved inorganic carbon (DIC) were filtered with a 0.2 µm pore size cellulose acetate filter (Sartorius, Göttingen, Germany) and stored at 4 °C until analysis. Nitrate was measured with a flow-injection analyzer (SAN++, Skalar, Breda, The Netherlands). A total organic carbon analyzer (Shimadzu, Kyoto, Japan) was used for DIC quantification. Concentrations of DIC were taken into account when calculating potential methane-oxidation rates. Water samples for flow cytometry were fixed with formaldehyde and stained with SYBR Green I (Thermo Fisher Scientific, Waltham, MA, USA) at 37 °C for 15 min. Particles were counted on an Accuri C6 flow cytometer (BD Biosciences, San Jose, CA, USA) and microbial cell counts determined as described previously30.
Samples for methane measurements were injected into airtight 40 ml serum vials filled with N2 gas and 4 g NaOH pellets (≥98% purity, Sigma-Aldrich, Darmstadt, Germany) for preservation. The vials were prepared in the laboratory prior to fieldwork. Gas chromatography (6890N, Agilent Technologies, Santa Clara, CA, USA) was used to measure methane in the headspace. The GC was equipped with a Carboxen 1010 column (Supelco, Bellefonte, PA, USA) and a flame ionization detector. Control experiments showed that 4 g of solid NaOH released 32.6 nmol CH4 on average which was accounted for when back-calculating methane concentrations in water based on Wiesenburg and Guinasso31.
Nucleic acid purification
One hundred and ten millilitre of lake water were filtered on site through 0.2 µm cellulose acetate filters (Sartorius), which were instantly frozen on dry ice. Samples were stored at −80 °C until extraction. Genomic DNA and total RNA were extracted from the same filter with the AllPrep DNA/RNA Mini Kit (Qiagen, Hilden, Germany) with a bead beating step on a FastPrep-24 (MP Biomedicals, Santa Ana, CA, USA) and 150–212 µm glass beads. Residual DNA in RNA extracts was digested using the TURBO DNA-free kit (Thermo Fisher Scientific). DNA removal was checked by gel electrophoresis after PCR (16S rRNA gene, 27 f/1492r, 35 cycles) and if required, a second digestion was performed. If the second digestion was not sufficient to remove the DNA, the sample was excluded (one sample). cDNA was reverse transcribed from RNA with random hexamers using SuperScript IV First-Strand Synthesis System (Thermo Fisher Scientific). DNA and cDNA were used for qPCR and Illumina MiSeq sequencing.
pmoA gene and transcript quantification
The amount of pmoA DNA and mRNA copies in lake water during overturn was quantified by qPCR using the primer pair 189 f (3′-GGNGACTGGGACTTCTGG-5′) and mb661 (3′-CCGGMGCAACGTCYTTACC-5′)32 on a LightCycler 480 (Roche Diagnostics, Rotkreuz, Switzerland). Ten microlitre reactions were performed with 0.2 µM primer, 2 µl of 1:10 diluted DNA or cDNA and the SYBR Green I Master mix (Roche). We used PCR conditions adapted from Henneberger et al.33 with 10 min initial denaturation, 15 s denaturation during cycling and acquisition at 79 °C. Standards were obtained by 10-fold serial dilution of pmoA containing plasmid, which were measured in quadruplicates. Sample assays were performed in triplicates and analysed with the LightCycler 480 software (v1.5.1.62) with the second derivative maximum method.
16S rRNA and pmoA sequencing and analysis
Bacterial 16S rRNA gene and rRNA, amplified using primers S-D-Bact-0341-b-S-17 (3′-CCTACGGGNGGCWGCAG-5′) and D-Bact-0785-a-A-21 (3′-GACTACHVGGGTATCTAATCC-5′)34 and functional marker pmoA gene and transcript (189f, mb661)32 amplicon libraries were sequenced on the Illumina MiSeq platform (Illumina Inc., San Diego, CA, USA). Briefly, the first PCR was performed in triplicate with tailed forward and reverse primers using NEBNext Q5® Hot Start HiFi PCR Master Mix (New England BioLabs, Hitchin, UK) and 17 and 25 cycles for the bacterial and functional marker, respectively. Illumina barcodes and adapters were attached to pooled and purified products in a second PCR (8 cycles) with the Nextera XT Index Kit A and D (Illumina Inc.). Libraries were purified with Agencourt AMPure XP kit (Beckman coulter, Indianapolis, IN, USA), quantified (Qubit, Thermo Fischer Scientific) and pooled equimolarly. After quality check on a Tape Station 2200 (Agilent Genomics, USA) the two sequencing runs with 600-cycle MiSeq reagent kit v3 and 10% PhiX were performed at the Genetic Diversity Centre (ETH Zurich).
Amplicon sequence variants (ASVs) were inferred with the DADA2 pipeline35 (v1.6.0) in R36 (v3.4.1). 16S rRNA reads were trimmed to 270 nt (forward) and 210 nt (reverse) and pmoA reverse reads were trimmed to 235 nt. At the first instance of a quality score (Q) of less or equal to two the read was truncated and reads with ambiguous bases or an expected error rate (EE = {sum} {10^{left( { – frac{Q}{{10}}} right)}}) exceeding three were removed. After calculating error rates the reads were dereplicated and denoised to infer exact sequence variants. After merging forward and reverse reads chimera were removed. Samples with less than 5000 reads were removed. Taxonomy of 16S rRNA ASVs was assigned using the SILVA reference database (v132)37 and reads assigned to mitochondria or chloroplasts were removed with phyloseq38 (1.24.2) in R (3.5.0) and the read counts were transformed to relative abundances. The 16S rRNA dataset was screened for known methanotrophic groups39 within the order Methylococcales, genera within class Alphaproteobacteria and phylum Verrucomicrobia, and Candidatus Methylomirabilis. ASVs reaching >0.2% relative abundance in at least three samples were retained for further analysis. To increase readability of Fig. 2 two samples (Oct 04; 7.25 m and 6.75 m) were omitted from the figure, which did not affect data interpretation. Raw data for these samples are available from data repositories (see Data availability). Amino acid sequences (aaASV) were derived from pmoA ASVs in MEGA740 and were retained for further analyses when exceeding 2% relative abundance in at least one sample. Alignment (Muscle) and neighbor-joining trees were constructed in MEGA7 with 10000 bootstrap replications using Jukes-Cantor evolutionary distance for 16S rRNA sequences or Poisson correction method for pmoA amino acid sequences. To facilitate interpretation, we assigned the same colors for MOB ASVs (MOB-affiliated 16S rRNA amplicon sequence variants) and aaASVs (pmoA amino acid operational taxonomic units) if they showed similar relative abundance and distribution patterns as observed in a canonical correspondence analysis (Supplementary Fig. 2), and if placement in the phylogenetic trees was compatible with this interpretation.
Potential methane-oxidation rates
Water samples were filled into 60 ml serum vials in the field and laboratory incubations were started the same day. The applied procedure to determine potential methane oxidation was adapted from Oswald et al.19. Each sample was purged with N2 to remove residual methane, amended with non-limiting concentrations of oxygen (~50 µmol L−1) and 13C-CH4 (~80 µmol L−1), and subdivided into five exetainers41 (6 ml). The incubation temperature for each date was chosen based on the in situ temperature profile at the date of sampling. For the first three dates a temperature between the mixed layer temperature and the bottom temperature (~6 °C) was chosen, for later dates the mixed layer temperature was chosen (incubation temperatures from Oct 4 to Jan 23 in °C: 13, 11, 11, 11, 8.9, 7, 6, 4). Incubations were performed in the dark and stopped after 0, 3, 13, 25 and 50 h with 100 µl ZnCl2 50% w/v. The increase of 13C-CO2 was determined with GC-IRMS (IsoPrime, Micromass, Wilmslow, UK). Rates were derived from a linear regression of the 13C-CO2 production over time, taking into account the background DIC in the sample. Carrara marble (ETH Zurich, δ13C of 2.1‰) served as a standard.
MOB quantification with CARD-FISH and calculation of doubling times
To quantify MOB dynamics in terms of cell numbers we applied CARD-FISH. Samples were fixed with formaldehyde (2% final concentration) for 3–6 h on ice prior to filtration onto 0.2 µm polycarbonate nuclepore track-etched membrane filters (Whatman, Maidstone, UK). Dry filters were stored at −20°C until further processing. Filters were embedded in 0.2% low gelling point agarose (Metaphor, Lonza), cells were permeabilized with lysozyme (10 mg ml−1) for 70 min at 37 °C and peroxidases inactivated in 10 mM HCl for 10 min. The horseradish peroxidase labelled probes Mg84 (5′-CCACTCGTCAGCGCCCGA-3′), Mg669 (5′-GCTACACCTGAAATTCCACTC-3′) and Mg70542 (5′-CTGGTGTTCCTTCAGATC-3′) were mixed to target type I MOB. As control probes EUB338I-III (universal bacterial probe, positive control) and NON338 (negative control)43,44 were separately applied to each sample. Filters were incubated at 46 °C for 2.5 h with 150 µl of the respective hybridization buffer (20% formamide Mg-mix and 35% for EUB and NON338) containing 1 µl of probe (50 ng µl−1). After washing, filters were placed into the amplification buffer containing tyramide labelled with Oregon Green 488 at 37 °C for 30 min in the dark. DAPI was used for counterstaining and the filters were mounted on glass slides in a mix of Citifluor and Vectashield (4:1).
Epifluorescence images were taken with an inverted microscope (DMI6000 B, Leica, Wetzlar, Germany) and a ×100/1.3 objective (PL-FL, Leica). To obtain clear images, multifocal images were recorded and merged with LASX software (Leica). DAPI and the corresponding CARD-FISH images of 22 randomly selected fields per filter were used for semi-automated cell counting with the daime (v 2.0) software45. In daime, image histograms were adjusted manually; objects were detected with the edge detection algorithm and split with a watershed segmentation-based algorithm. Object detection was improved manually if necessary. An exemplary cell identification with daime is shown in Supplementary Fig. 5.
To calculate doubling times the median of MOB cell numbers in the mixed layer multiplied by the mixed layer volume were used to calculate growth rates (r) using the natural logarithm plotted against time (Oct—Dec 12). Doubling times were derived as dt = ln(2)/r (ref. 46). The doubling of the methane-oxidation capacity in the mixed layer was calculated analogously.
Statistics and reproducibility
Canonical correspondence analysis (CCA) was performed with phyloseq38 in R on the MOB ASV relative abundance among bacterial 16S rRNA gene sequences and the aaASV percentage of pmoA mRNA sequences. We used a Chi-square dissimilarity matrix and scaled physicochemical parameters (O2 and CH4 concentrations and temperature) as constraints. Constrained axes were tested for significance with anova.cca of vegan v2.5.2.
Spearman rank correlation between MOB parameters and potential methane-oxidation rate were calculated in R and p values were adjusted for multiple comparisons using the Benjamini & Hochberg (BH) method.
The methane-oxidation capacity was calculated based on the median potential methane-oxidation rate in the mixed layer multiplied by the volume of the mixed layer.
Reporting summary
Further information on research design is available in the Nature Research Reporting Summary linked to this article.
Source: Ecology - nature.com
