We found high variability in traits across the tested 31 fungi covering 11 orders from three different phyla (Fig. 1A, Fig. S2–S6, Table S1 and S2). The colony radial growth rate (Kr) varied from 9.2 to 250.2 µm·h−1 with the fastest growing strains found in phylum Mucoromycota (Fig. S2). The enzyme profiles showed that Lac activity was much higher in Basidiomycota than in Ascomycota, while it was absent in Mucoromycota (Fig. 1A; Fig. S3). Mucoromycota had higher Leu compared to the Ascomycota strains (Fig. S5). Within Mucoromycota, Mortierellales strains (RLCS02-04, 11 and 15) did not produce Cel (0.00091 ± 0.00059 U·mg(dw)−1, n = 5). All strains were positive for Pho activity and had no difference at the phylum level (Fig. S6). These results are broadly consistent with the known enzymatic features of fungal groups5,6,20. As a caveat, we note that the use of ABTS (2,2′-azino-bis(3-ethylbenzothiazoline-6-sulfonic acid), a nonspecific substrate for enzyme tests, can lead to overestimation of Lac activity, since it reacts with other peroxidases26. At the same time, dextrose from PDA could give rise to catabolite repression that likely affected Cel/Lac enzymatic data26.
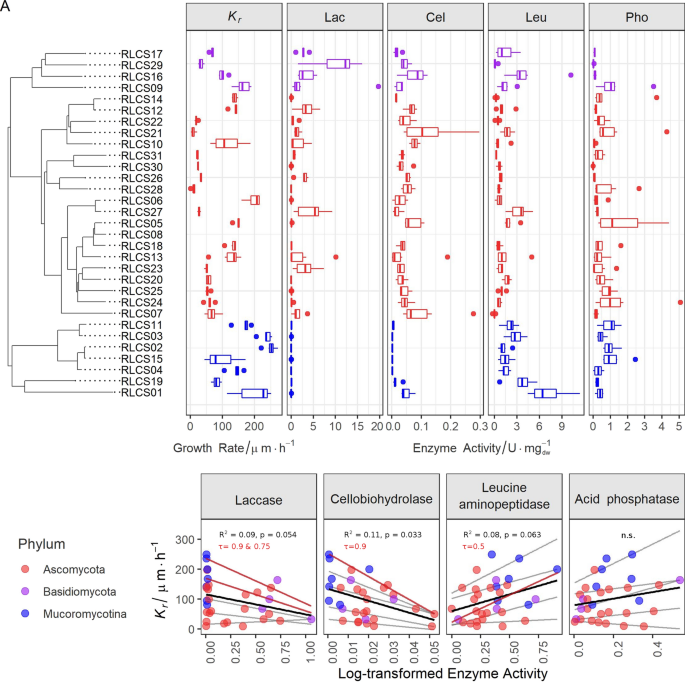
Traits of 31 saprobic fungi and the interaction between colony radial growth rate (Kr in µm·h−1) and activities of laccase (Lac in unit·mg−1 dry weight), cellobiohydrolase (Cel in unit·mg−1 dry weight), leucine aminopeptidase (Leu in unit·mg−1 dry weight) and acid phosphatase (Pho in unit·mg−1 dry weight). (A) Tukey boxplot of traits (n = 6) with whiskers indicating 25th and 75th percentiles; dots beyond the reach of whiskers are potential outliers. (B) Regression between Kr and log-transformed enzyme activity data (n = 31). Grey lines are quantile regression lines at the quantiles τ = 0.1, 0.25, 0.5, 0.75 and 0.9, with the significant ones highlighted and annotated in red. The black line represents the linear regression line and its R2 and p-value are shown in the plot. The details of the regression statistics can be found in Table S6.
Before exploring the relationship between growth rate and enzymatic repertoires, we tested the phylogenetic signals of the traits, since one concern is that the relatedness found between traits could arise from phylogenetic constraints21. This means, closely related species may display similar trait values due to their common ancestry. Based on the K statistics, we confirmed that in the current setting growth rate Kr did not show phylogenetic signal (Table S4). Therefore, here, phylogeny was not the main driver for explaining the patterns we found.
We found evidence of a trade-off between enzyme activity and growth rate; however, not for all enzymes (Fig. 1B and Table S5). Linear regression analyses revealed that Kr was negatively correlated to Lac (P = 0.054, R2 = 0.09) and Cel (P = 0.033, R2 = 0.11), suggesting a trade-off between these variables. To obtain further insight in the nature of the relationship of Kr and Lac and Cel, respectively, we conducted quantile regression analyses. These revealed that the trade-off between growth and enzymes (here, Lac and Cel) was significant at higher quantiles. These quantile regressions are likely more robust than standard linear regression, given the clearly wedge-shaped distribution of data (indicating that other variables also exert an influence on the dependent variable). This can be interpreted to mean that growth rate limits the expression of the maximum enzyme activities that are achievable. On the other hand, Leu positively affected Kr, while Pho did not show a clear pattern in either linear or quantile regression (Fig. 1B and Table S6).
This link between growth rate and enzyme activities is an aspect of intrinsic strategy of the fungi, rather than a reaction to their cultivation conditions. In our experiments, the traits were measured during the linear phase when PDA provides sufficient nutrients without enzyme-specific stimuli, since its carbon sources are starch and dextrose (more available C), but not cellulose and lignin (less available C), and the major organic nitrogen is asparagine but not leucine27. This means that enzyme expression under this condition is at a basal level rather than highly expressed. Hence the relationship we found likely describes fungal behavior in the beginning of substrate exploration rather than a reaction to a specific substrate.
The trade-off we found suggests that Lac and Cel enzymes come at a higher metabolic cost to the mycelium, leaving less for allocation to growth. This is congruent with the implications of the theoretical model concerning exoenzyme activity and microbial carbon investments and returns28. Fungi can be cost inefficient when producing extracellular enzymes, i.e. the return of exoenzymes regarding C and hence metabolic energy is less than the investment for producing them. Additionally, circumstantial evidence suggests that fungi in the functional groups of polymer decomposers and degraders of resistant compounds during later stages of substrate successions are typically associated with strong territoriality and antibiotics production29. This may mean that such fungi, in order to ‘protect’ their enzymatic investment, will produce defensive compounds, which likely represent an additional metabolic cost. In our study, Fusarium spp. (RLCS05 and RLCS13) and Chaetomium sp. (RLCS06) from Ascomycota were typical polymer decomposers, and the Basidiomycete fungi were degraders of resistant compounds. All the genera of polymer decomposers and degraders of resistant compounds used in the study have been reported as antibiotic producers30,31,32,33,34,35, however we did not measure antibiotic resistance in this experiment.
Under natural conditions, fungi produce a cocktail of enzymes to acquire resources, hence we also explored the impact of the joint effect of the four enzymes on Kr. First, we revealed that compared to single enzymes, the overall enzyme activity (reflected in PC1) has a stronger effect on Kr (Fig. 2A). This is especially true for Basidiomycota strains (purple symbols in Fig. 2A; R2 = 0.77, F1,2 = 11.12; p = 0.08) since a larger PC1 value indicates a lower value of Lac and Cel and a higher value of Pho and Leu. This further supports the hypothesis of a trade-off between growth and enzymatic repertoire differentiated to specific enzymes. To have high Kr, a fungus has to invest more into ‘cheap’ enzymes (here: Pho and Leu) for nutrient supply and less in ‘costly’ enzymes (here: Lac and Cel) for energy supply; and vice versa for low growth rates. Even though we measured only a limited number of enzymes, our study presents the first empirical evidence showing effects of enzymes on Kr.
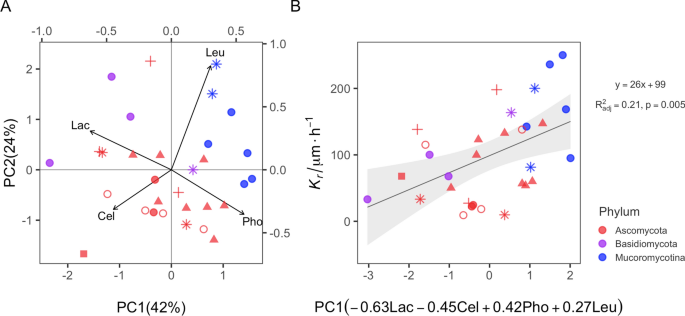
Linear regression between colony radial growth rate (Kr) and the joint pattern of enzymes represented by principle component 1 (PC1). (A) PCA biplot. (B) Linear regression PC1 vs. Kr. Color coding represents phyla and different symbols represent different orders.
In conclusion, we showed that, for saprobic fungi across several phyla, growth rate is related to multiple enzyme activities, and depending on ‘cost efficiency’ of exploiting certain substrates, enzymes are linked positively or negatively with fungal growth rate. Our analysis also highlights the joint effect of the entire enzymatic repertoire, to the extent measured, rather than a key enzyme as responsible for this pattern. Substrate successions are of basic ecological interest since they represent a microbial equivalent of the more well-studied plant succession. The driving force underpinning successions are trade-offs in the life histories of the organisms involved. Our results offer experimental evidence for the existence of a tradeoff in enzymatic investment vs. growth rate, a trade-off that has traditionally been invoked to explain the phenomenon of fungal substrate succession. Our results also indirectly offer new insights into the potential functioning of soil fungal communities: the fungi we examined here came from one community and differed noticeably in the traits we measured. Such difference in traits at the community level could give rise to functional complementarity effects, for example with consequences for ecosystem processes that involve carbon processing, such as decomposition and soil aggregation36.
Source: Ecology - nature.com
