We collected a total of 296 samples to assess bacterial colonization, shedding, transmission, and detection relative to the experimental inoculation of two groups of ring-billed gulls, each inoculated with a different strain of mcr-1 positive E. coli and housed in separate rooms with contact controls. These samples included 240 swab samples (237 fecal samples and three cloacal swabs) from 16 individual gulls (11 inoculated birds and five contact controls), 32 water samples, and 24 aggregated fecal samples collected from designated sampling areas on the floors of the experimental rooms. Samples were collected every 2–3 days over a period of 33 days. We detected E. coli containing mcr-1 in 8.8% of all samples (n = 26 of 296), as assessed by direct plating and following selective enrichment (see Materials and Methods section). Fecal samples from individuals weighed a mean of 0.26 g (95% CI = 0.23, 0.30) while the aggregated fecal samples from the floor weighed a mean of 2.98 g (95% CI = 2.24, 3.51).
Shedding of E. coli containing mcr-1 by individual gulls
Prior to inoculation with the challenge strains, bacteria containing mcr-1 was not detected in the feces of any of the gulls used in the experiment. After inoculation, we did not detect shedding of E. coli strain POR1303 in any of the swab samples (n = 120) collected from individual gulls inoculated with this bacterial strain. In contrast, we detected E. coli strain M175 in 6.7% (n = 8 of 120) of the swab samples collected from individual gulls inoculated with this strain. Half (3/6) of the individuals inoculated with the M175 strain shed this bacteria in their feces, although detection was sporadic. Over the 14 days where samples were collected during the 33-day period, the mean total shed was 102.57 CFU/g of mcr-1 positive E. coli (95% CI = 100, 102.89) across all individuals inoculated with strain M175 (Fig. 1) and 102.87 (95% CI = 102.31, 103.11) across the three individuals that were positive for strain M175. Total cumulative shedding by individuals had a coefficient of variation (CV = SD/(bar{x})) of 136.6% indicating considerable individual heterogeneity, primarily due to detection of shedding in only half of the individuals. When considering only individuals that shed mcr-1 positive E. coli, the coefficient of variation was reduced to 64.3%, suggesting more similar shedding patterns among colonized individuals (Fig. 1). In addition, one of the uninoculated contact control gulls became colonized with M175 E. coli and was observed shedding 102.00 CFU/g on day 7 post inoculation (Fig. 1), indicating that this strain could be transmitted to conspecific birds.
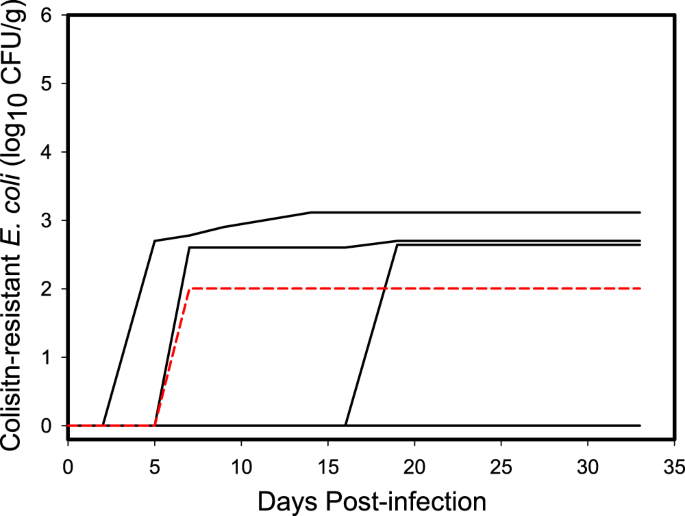
Cumulative shedding curves of E. coli strain M175 containing mcr-1 by individual ring-billed gulls. Half of the six inoculated individuals shed similar cumulative amounts in their feces while the M175 strain was not detected in the feces of the other half. Dashed red line is the curve of the contact control bird that became colonized with mcr-1 positive E. coli while housed with inoculated birds.
Shedding of E. coli containing mcr-1 by gull flocks
Gulls tend to be highly gregarious, breed in colonies, and congregate in flocks during the nonbreeding season. For this reason, we statistically characterized bacterial shedding for each experimental group of gulls housed in the separate rooms, which we defined as a flock. Given that no birds shed strain POR1303, we only fit models to the challenge data for ringed-billed gulls inoculated with E. coli strain M175. Of the 27 models we fit to the flock shedding data for strain M175, a 3-parameter lognormal curve best explained the temporal pattern, based on minimum AICc (Table S1). This model took the form:
$$y=frac{a}{x}cdot {e}^{-0.5cdot x{left(frac{{rm{l}}{rm{n}}(frac{x}{{x}_{0}})}{b}right)}^{2}}$$
(1)
where y = log10 CFU/g of mcr-1 positive E. coli, x = DPI + 0.01, DPI is days post inoculation, x0 is the geometric mean (location parameter) that represents the peak mcr-1 positive E. coli load shed by the flock, b is the geometric standard deviation (scale parameter) that defines the skewness and peakedness of the curve and a defined both the amplitude and area of distribution of the curve19 (Fig. 2). Parameter estimates for the fitted model (Fig. 2) are shown in Table 1. The model explained 65.5% of the variation in the data. The selection of this particular lognormal model suggested that gulls were not maintenance hosts but were acting as bridge hosts. That is, there was less support for relatively constant shedding of strain M175 by gulls over the duration of the study, which would be supported through selection of an intercepts-only or asymptotic model (Table S3) that suggested a maintenance host.

Fecal shedding of the M175 strain of mcr-1 positive E. coli by a flock of ring-billed gulls. Data points (red dots) represent total daily amounts shed by individuals (n = 6) in the flock. Solid line represents modeled trend from a 3-parameter lognormal model and the green shaded area represents 95% confidence intervals. Note that detection of the target bacteria was sporadic.
The inverse of Eq. (1) yielded:
$$x={e}^{2.5673pm sqrt{-0.2761cdot mathrm{ln}(0.0231cdot y)-0.7281}}$$
(2)
where the change in sign estimated the first day and last day, respectively, when a given log10 CFU/g of mcr-1-positive E. coli was detected. This equation was used to estimate the duration of shedding by the flock at the different concentrations of mcr-1 positive E. coli that were detected, with 95% confidence intervals (Table 2). The model estimated that the inoculated flock of gulls shed at least 101 CFU/g of mcr-1 positive E. coli for 16.4 days, with shorter periods as the concentration increased (Table 2).
Environmental accumulation of E. coli containing mcr-1 shed by gull flocks
We also examined the environmental accumulation of mcr-1 positive E. coli from feces shed by the flock based on the aggregated fecal samples collected from designated areas on the floors of the experimental rooms. This differed from the previous analysis in that it characterized the fecal load of mcr-1 positive E. coli in the environment that had been cumulatively deposited by the flock during the experimental period and which potentially allowed time for bacterial growth.
For the M175 strain, we used the same model set we fit to the flock data. A 3-parameter lognormal curve again best explained these data, based on minimum AICc (Table S2) with parameter estimates for the fitted model (Fig. 3) shown in Table 1. Based on AICc, a one compartment oral dose model was closely competitive with the 3-paramter lognormal curve. However, the resulting curves from the two models were nearly identical so we retained the 3-parameter lognormal curve for inferences. This model explained 59.3% of the variation in the data. The inverse of Eq. (1) with the floor sample parameter estimates yielded:
$$x={e}^{2.1260pm sqrt{-1.2284cdot mathrm{ln}(0.0224cdot y)-2.9888}}$$
(3)
where the change in sign estimated the first day and last day, respectively, when a given log10 CFU/g of mcr-1 positive E. coli was detected from aggregated fecal samples from the floor. These equations were used to estimate the persistence of the M175 strain of mcr-1 positive E. coli cumulatively shed by the flock into the environment. At least 101 CFU/g of mcr-1 positive E. coli was estimated to persist in the environment used by the flock of gulls for 29.3 days (Table 2), which was longer than the estimated period derived using data for flocks and an equivalent bacterial concentration.
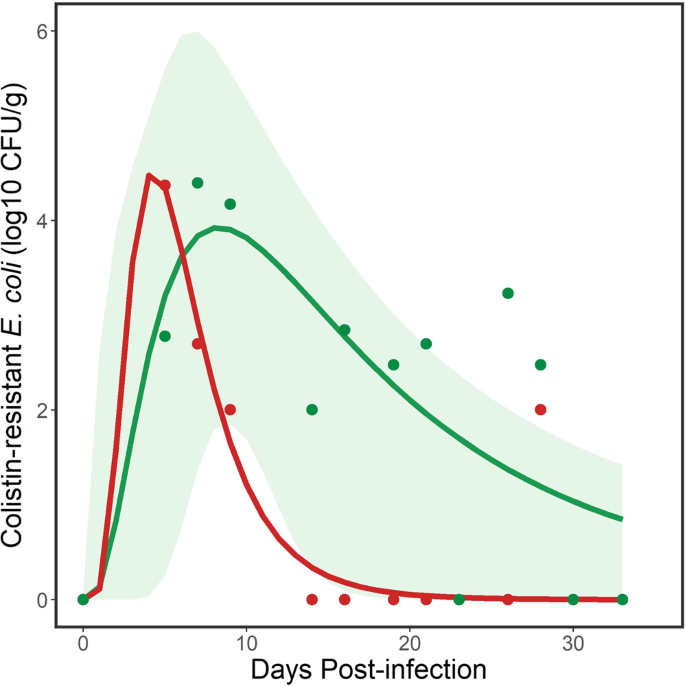
Environmental persistence of the M175 and POR1303 strains of mcr-1 positive E. coli shed by a flock of ring-billed gulls. Data points (green dots for M175 and red dots for POR1303) are samples collected from the floor of the experimental room. Solid lines (green line for M175, red line for POR1303) represent modeled trends from 3-parameter lognormal models. Green shaded area represents 95% confidence intervals for modeled line for M175. Note that detection of the target bacteria was less sporadic than from the flock data (see Fig. 2). There was uncertainty in some of the data points for POR1303 (e.g., DPI 9 and 28), which were only positive following enrichment (see Materials and Methods). For this reason, 95% confidence intervals were not estimated for the modeled line for POR1303.
Although we did not detect the POR1303 bacterial strain in the feces of individual gulls, we did sporadically detect environmental contamination by this strain from gull feces collected on the floor of the experimental room for up to 28 days. Because data were sparse, we did not examine additional curves but fit a 3 parameter lognormal model for comparison with the other curves. This model took the same form as Eq. (1) with parameter estimates for the fitted model (Fig. 3) shown in Table 1. The model explained 82.6% of the variation in the data. The inverse of Eq. (1) with the different parameter estimates yielded:
$$x={e}^{1.4832pm sqrt{-0.5263cdot mathrm{ln}(0.04401cdot y)-0.8417}}$$
(4)
where the change in sign estimated the first day and last day, respectively, when a given log10 CFU/g of mcr-1 positive E. coli was detected from aggregated fecal samples from the floor. These equations were used to estimate the persistence of the POR1303 strain of mcr-1 positive E. coli cumulatively shed by the flock into the environment. At least 101 CFU/g of mcr-1 positive E. coli persisted in the environment used by the flock of gulls for 10.0 days (Table 2), which was shorter than the estimated period of persistence for a similar concentration of the M175 strain. However, this reduced persistence was also a function of a smaller flock (n = 5) than the flock (n = 6) colonized with the M175 strain.
In both experiments, water samples yielded lower estimates of mcr-1 positive E. coli concentrations as compared to feces collected from designated areas on the floor. Strain POR1303 was detected at 102.00 CFU/g only once in water on day 7 post inoculation while the M175 strain was detected three times at 102.30, 102.48, and 102.00 on days 5, 7 and 14 post inoculation, respectively.
Effects of colonization of E. coli containing mcr-1 on gulls
On the last day of the study (33 days post inoculation), all gulls were euthanized and then necropsied at the conclusion of the experiment. For each individual, we removed the proventriculus, gizzard, small intestine and large intestine and tested the contents (n = 48 from 16 individuals) for mcr-1 positive E. coli. All necropsied samples tested negative for mcr-1 positive E. coli. We detected no indication of disease and percent change in weights from the beginning of the study were greater for the uninoculated (control) gulls ((bar{x}) = −10.3%; 95% CI = −20.6, −2.8%; n = 4) than the inoculated gulls ((bar{x}) = −7.0%; 95% CI = −15.5, 1.5%; n = 12 including the colonized contact control). This indicated that colonization with the mcr-1 positive E. coli strains used in this study did not cause weight loss or clinical disease.
Source: Ecology - nature.com
