Growth parameters
Plant height of rice plants examined in this experiment responded differently to the fertilization treatments (p < 0.05). Relative to the control that was supplemented with mineral fertilizers (T1, Table 1), most of the CSS-applied treatments could maintain comparable plant heights (p > 0.05), except T4, which received a single CSS fertilization at the same total N input as the control, significantly lowered the height of rice plants (p < 0.05).
Tillering capacity of the rice plants was significantly influenced by the examined treatments (p < 0.05). Compared with the control (42.3 tillers pot−1), T2 and T3 that replaced the mineral fertilizers in basal application with CSS at the same dose of 0.8 g N pot−1 (Table 1) lessened tiller number by 16 and 19%, respectively, although topdressing with either mineral fertilizers (T2) or TWW (T3) was done. The same trend was seen in T4, in which the mineral fertilizers for both basal and topdressing were completely substituted with a single application of CSS at 1.3 g N pot−1. However, basal fertilization with CSS at 1.3 g N pot−1 and topdressing with TWW (T5) could produce similar tiller number (42 tillers pot−1) as the control. A sole application of CSS at 2.6 g N pot−1 yielded the highest tiller number of 48.3 tillers pot−1.
Results of shoot dry mass shows similar trend with tiller number of the rice plants as affected by the examined fertilization practices (Table 2). T2, T3 and T4 had significantly lower shoot dry weights (59.2, 67.7, and 55.0 g pot−1, respectively) while T5 and T6 produced comparable shoot biomass (76.1 and 81.5 g pot−1, respectively) relative to T1 (80.2 g pot−1).
The examined fertilization practices had no effect on leaf chlorophyll content expressed as SPAD values of rice leaves during the tillering stage (p > 0.05), whereas the rice plants had variety in SPAD records during the flowering time (p < 0.05) (Table 2). From 75 days after transplanting (DAT) onwards, SPAD values were within the same range between the control and T2, T4, and T5, while only T3 and T5 that received topdressing with TWW had significantly higher SPAD records (Table 2, Fig. 1).
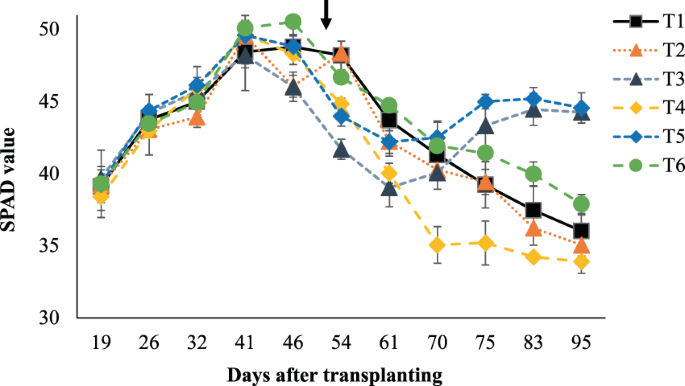
SPAD values of rice leaves during the tillering and flowering stages. Error bars indicate standard deviations of three replications. The arrow denotes the time of topdressing.
Grain yield and rice nutritional quality
Grain yields of the rice plants were presented here as the yields of brown rice, and responded differently (p < 0.05) to the fertilization treatments (Fig. 2). Compared with the control (61.6 g pot−1), T2, T3, and T4 notably reduced the yield by approximately 20, 17, and 25% respectively. However, T5 and T6 produced higher yields of 27 and 5% relative to the control, respectively. Interestingly, at the same amount of CSS amendment (1.3 g N pot−1), T4 without topdressing resulted in the lowest yield (46.2 g pot−1) while T5 receiving topdressing with TWW produced the highest grain weight (78.4 g pot−1) among the examined treatments (Fig. 2).
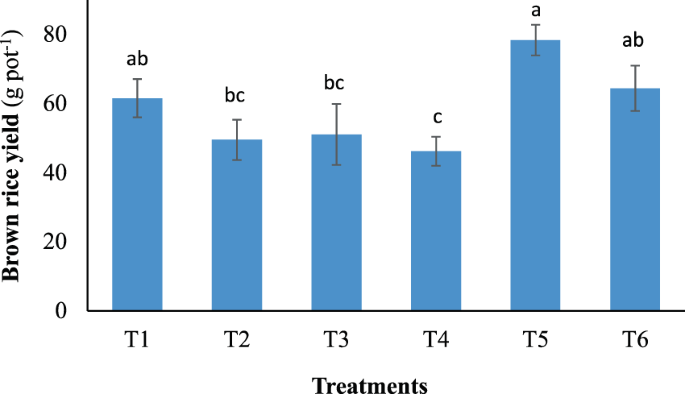
Brown rice yield as affected by the different fertilization treatments. Error bars indicate standard deviations of three replications. Data with unshared letters are significantly different (p < 0.05).
Nutritional quality of the forage rice is evaluated based on rice protein content, which responded differently to the examined fertilization treatments (Fig. 3). Although T2 and T4 received the same total N input as the control (1.3 g N pot−1), their brown rice had 8–11% lower protein contents compared with that of the control. T6 with the double N dose of 2.6 g pot−1 yielded a comparable rice protein content (7.5%) as the control. Interestingly, only treatments that received topdressing with TWW (T3 and T5) showed significantly higher protein levels (9.5 and 9.4%) compared with the control.
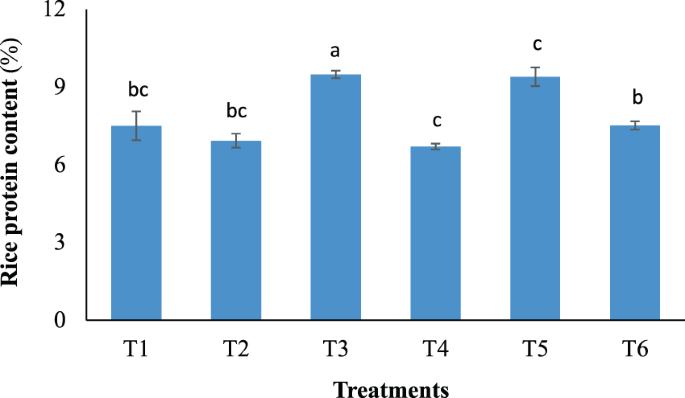
Rice protein content as affected by the different fertilizer treatments. Error bars indicate standard deviations of three replications. Data with unshared letters are significantly different (p < 0.05).
Heavy metal(loid) concentrations in rice grains
Concentrations of five examined elements including Zn, Cu, Pb, Cd, and As are shown in Table 3. Concentration of Zn in the brown rice harvested from all CSS-amended treatments was similar or lower than that recorded from the control, ranging between 0.5 and 0.9 mg kg−1, although the differences were statistically non-significant (p > 0.05). In contrast, there was a significant difference in Cu concentration, in which case the highest concentration was observed in the control (6.1 mg kg−1), followed by T2, T4, and T6 (5.0, 4.8, and 4.4 mg kg−1, respectively). The lowest Cu concentration (3.9 mg kg−1) was found in the brown rice produced under T3 and T5. Generally, CSS application either as a single amendment (T4 and T6) or in combination with topdressing by TWW irrigation (T3 and T5) or mineral fertilizers (T2) did not increase concentrations of these two micro-nutrients in the brown rice.
Replacing mineral fertilizers in the control with CSS at 0.08 g N pot−1 (T2 and T3) didn’t increase concentration of Pb in the brown rice, although the higher CSS applications of 1.3 and 2.6 g N pot−1 (T4, T5, and T6) likely showed a higher accumulation levels of the element. However, these differences were non-significant (p > 0.05, Table 3). Concentrations of Cd in the brown rice of all treatments were negligible. In case of As, most of the CSS treated rice plants yielded higher As concentrations in their rice grains compared with that of the control, except T5 that showed a similar level of As accumulation in the rice grain (Table 3). Overall, despite remarkable differences in absorption of Pb, Cd, and As among the treatments, contents of these elements were under the limits set by FAO/WHO22 and the standards for animal feed in Japan23.
Plant nutrients and heavy metal(loid) concentrations in paddy soil
Figure 4 shows the contents of three essential macro-nutrients (N, P, and K) in paddy soil before and after the experiment. Although there was no significant difference in total N, P and K (TN, TP, and TK, respectively) among the soils fertilized separately with the treatments tested herein (p > 0.05), there were still remarkable variation among them. Generally, concentration of TN in the soil was relatively stable despite marked differences in total N input among the treatments (Table 1). Most treatments maintained soil TN levels comparable or close to the initial TN concentration of the soil before the crop season, except for a slight increase of 12% observed in T6 (Fig. 4a). As for P, all treatments increased soil TP, with CSS-amended treatments (T2, T3, T4, T5, and T6) showing notably higher TP contents than the control (Fig. 4b). In contrast, most soils experienced a decrease in K after harvesting, except for slight increments in T5 (Fig. 4c), which received the moderate dose of CSS along with TWW irrigation (Table 1).
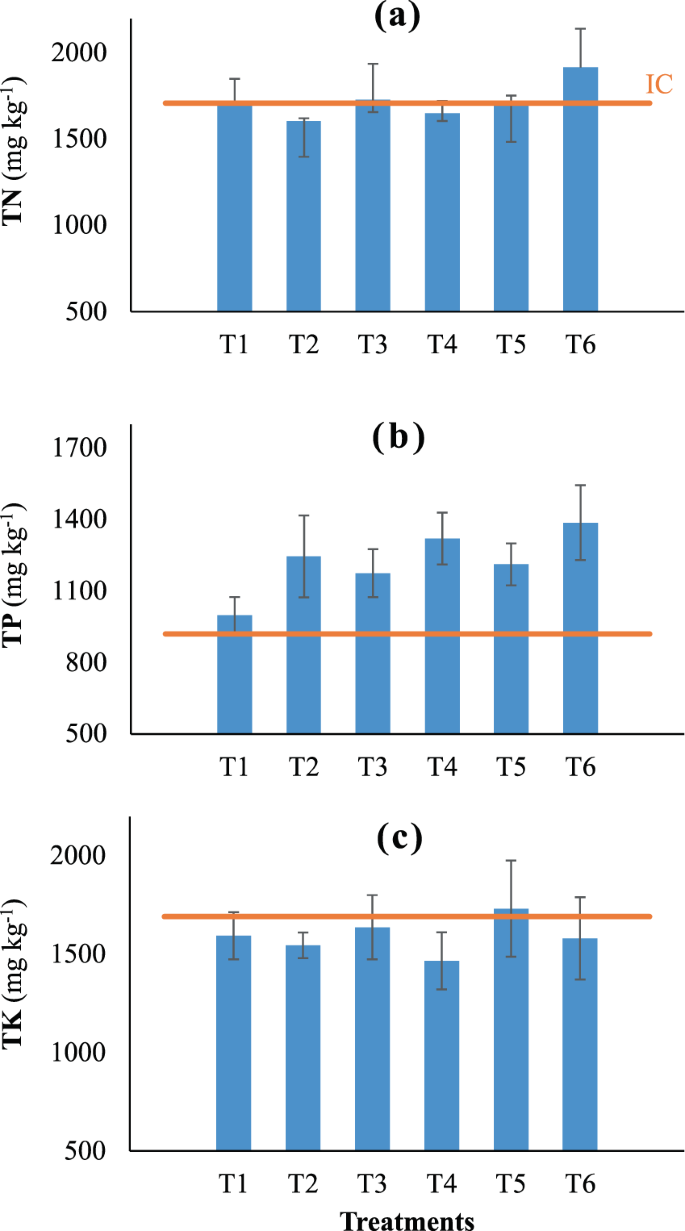
Nutrition of the postharvest soils. Error bars indicate standard deviations of three replications. IC: initial contents of the elements in the soil before the experiment.
The effect of the fertilization treatments tested herein on the accumulation of heavy metal(loid)s in paddy soils is shown in Table 4. Compared with the control, concentrations of Zn and Cu in the soils amended with CSS increased notably (p < 0.05), except the case of T2 that maintained concentrations of Zn and Cu at similar levels. All the soils amended with CSS (T2, T3, T4, T5, and T6) tended to have lower Pb concentrations relative to the soils supplied with conventional mineral fertilizers. Further, Cd likely increased due to CSS application, while As concentration did not show a clear trend. Compared with concentrations of these elements in the soil before the experiment, CSS addition tended to increase Zn and Cu contents while slightly reduced Pb concentrations. In turn, the concentration of Cd in the CSS-added soils remained unchanged, compared with the initial soil, while there was a significant reduction in As in the paddy soils after the crop season, regardless of fertilization treatments.
Source: Ecology - nature.com
