Subjects and housing
This research was conducted in March–April 2018, at the Lizard Island Research Station, Australia. A total of 40 fish participated in the experiments, 20 juvenile and 20 adult cleaner wrasse, distinguishable by their distinct colour pattern: juveniles are mostly blue with a black stripe, while the blue becomes whiter in adults. There was no overlap between age classes with respect to body length (juvenile cleaners: average = 4.45 ± 0.64 SD cm; adult cleaners: average = 7.725 ± 0.56 SD cm). The cleaners were captured in the reefs surrounding Lizard Island at least 24 days prior to the beginning of the experiments and housed in the lab in separate aquaria with a constant flow of running seawater. Each fish was provided with a polyvinyl chloride tube for shelter. Before the experiments began, the cleaners were fed daily with mashed prawn that was smeared on plexiglass plates of varying colours and sizes. The fish were returned to their original habitat at the end of the experiments.
Three experiments were conducted consecutively, in two cohorts, each constituting 9–10 pairs of young and adult cleaners (N = 20 cleaner pairs in experiment 1, and N = 19 in the following experiments due to the death of a juvenile in the first cohort). Prior to the beginning of the experiments, each pair of cleaners was placed in a glass aquarium, separated into two compartments by a clear partition. An additional opaque barrier was used to prevent visual contact between the cleaners during different stages of the experiments.
Experimental setup
In experiments 1 and 2, plexiglass plates were used as surrogates for clients, mucus was replaced with mashed prawn and ectoparasites with flakes. Both food types were used to create discrete food items that were placed on the plates. Flake items were made by mixing mashed prawn with commercial fish flake paste—mixing the prawn with this substance caused the food to be less palatable, and the higher the flake concentration in the mixture the less palatable it became. Levers attached to each plate allowed the experimenter to manipulate plates to ‘behave’ in pre-defined ways that mimic responses of real client fish. Plates never responded when a cleaner ate a non-preferred flake item, which corresponds to feeding cooperatively on non-preferred ectoparasites28. In contrast, experimenters made plates respond to a cleaner eating preferred prawn, as the consumption of preferred food (mucus) constitutes cheating in the wild28. In some cases, the response was to quickly remove the plate, the equivalent of a client fleeing and in other cases, the experimenter chased the cleaner with the plate, the equivalent of a client punishing31.
In each experiment, any fish that would not receive food during the sessions (i.e., juvenile cleaners and control group adults with no access to plates in the demonstration phase), were fed ad libitum with smeared mashed prawn for 20 min prior to the beginning of the sessions. The cleaners in the two aquarium compartments were visually isolated from one another during this feeding.
Experiment 1: socially learning to feed against preference
In the first experiment, we tested whether juvenile cleaner fish can learn socially to eat against their preference following observation of the negative consequences associated with ‘cheating’, the consumption of preferred food. In this experiment, the fish were presented with plates (size 10 × 15 cm) offering three flake and three prawn items. To facilitate item recognition, prawn items were placed inside black circles while flake items were placed in black triangles. The locations of these marking, and their respective food items, were randomly switched between sessions in all experimental phases (by using ten different versions of the plate, each involving a different orientation of the markings).
Prior to the beginning of the experiment, we conducted separate pre-experimental training to cleaners of the two age classes. The opaque barriers were placed in the aquaria throughout this training, prohibiting visual contact between the cleaners. In this pre-experimental phase, demonstrator cleaners were trained to feed against preference to obtain more food (also see31). They participated in 6 sessions, each involving the presentation of a plexiglass plate containing 2 prawn and 12 flake items. In each trial, the consumption of a prawn item led to the immediate removal of the plate for 60 s, following which the plate would be reintroduced into the aquarium until the next prawn is consumed. The consumption of the second prawn item, then led to the removal of the plate from the aquarium until the next trial. In contrast, juvenile cleaners were accustomed to feeding on plates containing both food types that did not respond to prawn consumption. They were exposed to numerous presentations of plates containing seven flake and seven prawn items (initially, different flake concentrations were used, in order to find a concentration that the young cleaners indeed dislike) and were thus well familiar with both food types.
At the end of the acclimation phase, the juveniles’ preferences towards prawn were measured and used to create for each fish an initial preference score. This was achieved by testing the fish in a series of three preference tests in which they were again presented with plates containing 7:7 flake and prawn items. In each of the tests, we quantified the amount of flake items eaten in the first seven choices (the point in which half of the plate is depleted). We then combined the results of the three tests to calculate for each fish a preference score: the proportion of prawn items eaten during the initial phases of the tests. Since juvenile cleaners’ initial food preference is expected to substantially affect their feeding adjustment in the test phase of the experiment (the less they like flakes, the less likely they are to feed on them in the tests), we wanted to make sure that the two treatment groups do not differ in their preference for prawn. To achieve this, the cleaners’ preferences in the initial preference tests were taken into account in their allocation to the two treatments. The cleaners within each cohort were ranked according to their initial preference score, and these ranks were then used to split the fish into the two treatments: first, we paired the two fish with the highest rank, and randomly assigned each of them to a different treatment group (allocation was determined via a lottery). We then moved to the fish with the highest ranks out of the remaining batch and repeated this procedure until all fish were allocated. Finally, we verified that the juveniles of the two treatment did not differ in their initial preference for prawn nor in their body size (Wilcoxon rank sum 2-tailed test, N = 20: initial preference, W = 48, P = 0.909; body size, W = 52.5, P = 0.879).
The flake concentration used in the experiment was different for juvenile subjects and adult demonstrators. In the case of juveniles, flake concentration was ~60% in the first cohort and ~40% in the second. These cohort differences stem from the fact that in the first cohort, some of the juveniles hardly consumed flakes in the test phase. As we were concerned that this would prevent any treatment differences from being pronounced (if the juveniles refuse to feed on flakes, a lack of variation in their response can mask any effect of observation), in the second cohort we reduced the flake concentration to 40%. Due to this inherent difference between cohorts, we included ‘flake palatability’ (referring to the difference between the two cohorts) as a fixed factor in the statistical analysis of this experiment. The flake concentration of adults was lower (~20% flakes), due to initial tests revealing that juveniles are much more tolerant towards flakes than adults are. Using only 20% flakes for adult demonstrators ensured that they would indeed feed regularly on flake items prior to eating a prawn item during demonstrations, thereby potentially enabling juveniles to learn through observation about the consequences of eating flake items vs. prawn items.
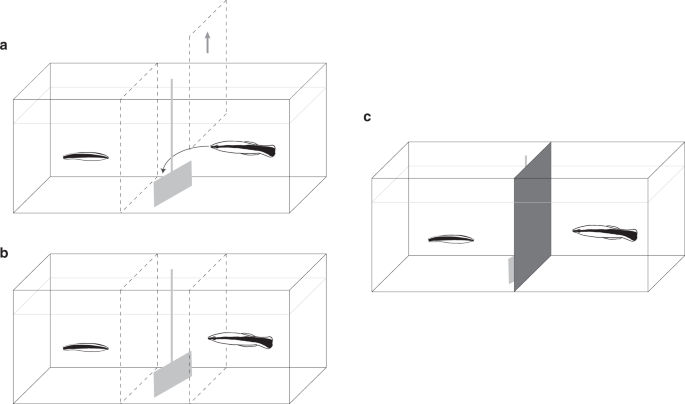
The experiment was divided into two phases: a demonstration phase, and a test phase. During the demonstration phase, juvenile cleaners were provided with the opportunity to witness 14 demonstrations of plate presentations (see Fig. 1a). The plates were marked with an additional white stripe on their left side, to distinguish them from the plates used earlier, in the pre-experimental training phase. Each plate contained three flake and three prawn items, the location of which was randomly varied between trials. In the treatment group (N = 10), the consumption of a prawn item by the demonstrator led to the immediate removal of the plate from the aquarium. In the control group (N = 10), an additional transparent barrier prohibited the adult from interacting with the plate (Fig. 1b). The duration of plate presentation (the time the plates stayed in the aquarium) was matched between treatment and control groups: each control individual was paired to an individual from the observer treatment, and in each trial round, the control plate was removed at the same time as the experimental plate had been removed in response to the demonstrator eating a prawn item in the paired trial.
At the end of the demonstration phase, we conducted 15 test trials (5 on the day of demonstration, and 10 during the following day), in which the juveniles were presented with the same plates, and the plates followed the same response rule that was shown during demonstrations. In each of these tests, we measured the amount of flake items that were consumed by the cleaners prior to the consumption of prawn (the consumption of a food item was indicated by cleaners’ attachment of the mouth to the plate at the item’s location). This design enabled the juveniles to both acquire information by observing adults, and gain personal experience by interacting with the plates during the tests. This parallels natural conditions, where juveniles’ use of social information likely involves getting direct feedback. It further fits the notion that social learning is a biasing of individual learning by social stimuli rather than a completely distinct process (also see refs. 14,57,58,59,60,61,62). Note, however, that in itself, individual learning would not be able to account for differences between observer and control treatments. If anything, a strong effect of individual learning would be expected to diminish any potential differences between these treatments, as it allows individuals of the control groups to fill in any knowledge gaps created by the lack of exposure to social information. Thus, any significant effects of social observation on juvenile performance, would be pronounced despite the potential for individual learning, and not because of it.
At the end of the experiment, we calculated for each fish an eating against preference score. In order to achieve this, we first calculated the cleaner’s predicted feeding score: the number of flake items that it is expected to target prior to the consumption of prawn, on plates containing three flake and three prawn items. We used a derivation of a formula developed by Gingins and Bshary63 for the exact same purpose:
$${rm{Predicted}};{rm{feeding}};{rm{score}} = frac{{3(1 – {x})}}{{2{x}} + 1}$$
The formula combines the initial feeding preferences of the fish and the probabilities of eating preferred and less preferred items in a set of sequential choices. The feeding preference score measured prior to the beginning of the experiment (proportion of prawn consumed in the tests—see details above) is denoted by x. The probability of eating a flake item is denoted by 1 − x. This probability changes each time a flake item is consumed, as its consumption increases the proportion of prawn in the remaining items. The formula takes into account these changes in probabilities and generates for each fish a predicted feeding score: the number of flake items it is expected to eat prior to the consumption of prawn in a single test session. This score was then subtracted from the average number of flake items that the fish actually consumed in the tests (measured—predicted), thus generating a feeding against preference score. When the feeding against preference score is larger than 0, it means that the fish ate more flake items than predicted, whereas, when the feeding against preference score is lower than 0, the fish performed below the expected value.
Experiment 2: socially learning about partner responsiveness
In experiment 2, the juvenile cleaners (N = 19) participated in two consecutive experimental phases: an individual learning phase and a social learning phase, in which they were repeatedly confronted with the need to choose between plates that differ in their responsiveness to cleaners’ consumption of preferred prawn. The two phases were comprised of several treatments: two in the individual learning phase, and four in the social learning phase (see further details in the description of each experimental phase below). Each of the fish participated in all treatments (a within subject design), and treatment order was counterbalanced between cleaners within each phase. Overall, during this experiment the juvenile cleaners encountered a total of twelve plates (size 7 × 9 cm) of different colours and patterns (see Supplementary Fig. 3). Four food items, two prawn items and two flake items, were placed on equally distant dots in the middle of each plate. Flake concentration was 40% for the juvenile cleaners, and 20% in adult demonstrations. Food locations were counterbalanced, so that individuals were exposed to a variety of food location combinations throughout trials. One treatment was completed on each experimental day, and the roles assigned to the plates were counterbalanced between the treatments within each phase.
The first phase of the experiment tested for individual learning regarding plates’ expected responses (IL, days 1–2). In this phase, the juvenile cleaners participated in two treatments, ‘IL fleeing’ and ‘IL punishing’, in which they could interact with the plates directly during the training phase while being visually isolated from the adults in the neighbouring compartments (Fig. 1c). Treatment order was counterbalanced between individuals. In each treatment, the cleaners were presented with plates belonging to two distinct types: a plate that allows the cleaner to eat what and as much as it wants (‘tolerant to cheating’), gently leaving the aquarium when the cleaner is done feeding, and a plate that responds in a negative way if and when the cleaner eats a preferred prawn item (‘responsive to cheating’). Plate responses varied between treatments: in the ‘fleeing’ treatment, the responsive plates would leave the aquarium abruptly following prawn consumption, whereas in the ‘punishing’ treatment, plates would chase the cleaner in the aquarium for ~3 s. Each treatment was comprised of 20 training sessions involving 10 single presentations of each plate type. Presentation order was determined by a lottery, with the constraint that the same plate would not be presented in more than three consecutive trials.
At the end of the training, the juveniles experienced a series of ten test trials in which they were allowed to choose between the two plates. Plates’ reaction rules in these tests matched the rules they followed during training, and in each test trial, the plate not chosen was removed from the aquarium. Plate positions (left or right side in the aquarium) were counterbalanced between tests. On the first day of testing, the cleaners were relatively less active towards the end of the day, and the number of tests conducted was therefore reduced to eight. As the order of treatments was counterbalanced between individuals, this difference in the amount of testing between day 1 and day 2 could not have led to systematic biases that produce significant results. The results of this phase are reported in Supplementary Note 1.
The second phase of the experiment was a social learning phase (SL, days 3–6), in which the juvenile cleaners participated in four treatments involving different combinations of social observation and plate response type (a 2 × 2 matrix): observing adult demonstrators interacting vs. not interacting with plates, and responsive plate punishing or fleeing. Treatment order was counterbalanced between individuals. In each treatment, the juveniles were provided with the opportunity to witness 20 demonstrations, 10 of each plate type (‘tolerant’ or ‘responsive’), in which the designated plate was placed in the demonstrator compartment. Observer cleaners could then observe the actual interaction of the demonstrator with the plate (Fig. 1a). Control individuals could not witness an actual interaction as the adults were prevented from feeding on the plate by a transparent barrier (Fig. 1b). However, each control individual was paired to an individual from a respective treatment group. The order in which plates were presented, the time they spent in the aquarium and their departure rules (leaving gently, fleeing abruptly or ‘punishing’ by simulating the punishing movement pattern used in the observer treatment, but out of demonstrator’s reach, within the area in which the plate is confined) were all matched to those used in the demonstrations of the paired observer. This allowed us to verify that any difference in preferences between control and observer treatments, will not be driven by differences in length of exposure to the two plates, or simply by their movement patterns. Due to the odd number of cleaners one individual was paired to itself: for this individual, each observation treatment was conducted prior to the relevant control, and both plate presentation order and exposure time used during the control treatments, were matched to the ones exhibited in the observer treatments.
At the end of the demonstration phase, an opaque barrier was placed in the aquarium, visually isolating the two compartments. The juvenile cleaners were then tested in a set of ten test trials in which they were allowed to choose between the two plates. Similarly to the individual learning phase, plates’ reaction rules in these tests matched the rules they followed during training, and in each test trial, the plate not chosen was removed from the aquarium. Plate positions (left or right side in the aquarium) were counterbalanced between tests. This testing procedure enabled the juveniles to acquire personal experience in their interactions with the plates during the test phase. However, as explained in detail in the description of experiment 1, personal experience in itself would not be able to account for differences between observer and control treatments.
Experiment 3: observing demonstrators’ arbitrary preferences
In experiment 3, the juvenile cleaners were allowed to observe demonstrations in which the adult would choose between two plates types. The juveniles’ preference for either of the plates was then examined in a set of choice tests. The two plates used in this experiment were monochromatic plates (red and green, size 5 × 8 cm) with food items placed on dots drawn on their back. This ensured that the cleaners would not be able to see the food itself before making a choice, thus forcing them to base their choices on the colour cues rather than just readily approaching the visible food. Placing the food on the back of the plates further allowed us to pre-train the demonstrators prior to the beginning of the experiments, while using different reward regimes. Plate positions (left or right side in the aquarium) were counterbalanced in each of the experimental phases.
During pre-experimental training, the barrier between the demonstrator and observer compartments was opaque, preventing juvenile cleaners from observing adults’ interactions with the plates. The juvenile cleaners were pre-trained to find food on the back of plexiglass plates by swimming behind the plate. The adult cleaners participated in at least 24 training sessions (some of them received more training, depending on their achievements, see further below), involving a choice between the two plate types. In each session, the two plates were placed in the aquarium, and following the adult’s choice, the plate not chosen was immediately removed. The adults were divided into two treatment groups: in the ‘preferring demonstrator’ treatment, the demonstrators were trained to significantly prefer one of the plates (plate type counterbalanced between cleaners): in this treatment, the designated plate contained two prawn items and was thus always rewarding, whereas the other plate was empty of food. In the ‘non-preferring’ demonstrator treatment, the goal of the training was to cause the demonstrators to approach the plates in a random manner. The adults were thus trained with plates that were equally rewarding, both containing one prawn item.
In some cases, we provided the adults with additional pre-training sessions. In the ‘non-preferring’ treatment, this occurred when demonstrators showed a strong preference towards one of the plates (chose repeatedly the same plate type in three sequential trials). These demonstrators would then receive some trials in which the preferred plate did not offer any food to reduce the preference. In cases in which the demonstrators nevertheless exhibited difficulties in switching between the plates, the experimenter would allow the cleaner to explore both plates, rather than immediately removing the non-chosen (and rewarding) plate. In the ‘preferring’ treatment, additional trials were added if demonstrators showed weak preferences at the end of the pre-training (non-significant preference in the 24 sessions, according to a binomial test). This was conducted in order to maximise the chance that they will indeed show clear preferences in the experiment itself.
As in previous experiments, the experiment was divided into two phases: social observation and testing. In the social observation phase, the juveniles were provided with the opportunity to witness numerous demonstrations of plate presentations (14 in the first cohort and 20 in the second cohort). Food was placed on the back of the plates (and thus was not visible to the cleaners), and its allocation was similar to that of the adults’ initial training period: 2 vs. 0 items in the preferring demonstrator treatment (N = 10), and 1 vs. 1 in the non-preferring treatment (N = 9). At the beginning of each trial, the demonstrator was confined to the side adjacent to the observer, and the two plates were placed in the aquarium. The barrier confining the demonstrator was then removed, allowing it to swim towards the plates. Following a choice of one of the plates, the plate not chosen was retracted. The remaining plate was removed from the aquarium only after the interaction ended and the cleaner swam away from it. This could take quite some time, as the cleaners would often provide the plates with tactile stimulation, a ‘massaging’ behaviour that is part of their service to clients in the reef64. Note that the demonstrators’ choices in this phase, indicate that our initial training reached its goal, and generated variation in demonstrated preferences as well as clear differences in the demonstrations of the two treatment groups (Wilcoxon rank sum: n = 19, W = 8.5, P = 0.003. Compare the x-axis values of grey and white dots in Fig. 4b).
At the end of the demonstration phase, the opaque barrier separating the two compartments was introduced, and the juvenile cleaners were presented with a set of ten simultaneous choice tests between the same two plates. In these tests, one prawn item was located at the back of each plate, making the plates of equal value. As during demonstrations, the plate not chosen was removed from the aquarium before the juveniles could feed off it.
Statistical analysis
Statistical analyses were conducted in the statistical software R version 3.5.165. The results of the different experiments were analysed using linear models, generalised linear models, and generalised linear mixed models, where applicable. Continuous predictors were all standardised using the function scale() from the base package in R language. Reported P values were extracted using the function Anova() from R car package. Summary outcomes from all the fitted models are available in Supplementary Table 1.
In experiment 1, we were interested in whether juvenile cleaners adjusted the extent to which they ate against preference following observation. We tested the juveniles’ feeding adjustment by fitting a linear model (model A, Supplementary Table 1) in which their calculated eating against preference score served as the response variable. Treatment group (observers vs. control) and flake palatability (the experiment was run in two cohorts, differing in the palatability of flake items) were added as fixed predictors. The formula syntax of this model was the following: eating against preference score ~ treatment group + flake palatability. We checked the model’s diagnostics, normality of residuals and homogeneity of variances visually, by using residual plots and qqplots, and statistically, by using Shapiro–Wilk and Levene’s tests.
In addition, we were also interested in whether the adults’ feeding choices in the demonstration phase affected the feeding adjustment of juveniles in the observer treatment (control individuals did not observe the adults consuming food and were therefore not included in this analysis). To that aim, we fitted a linear model (model B, Supplementary Table 1) in which the juveniles’ eating against preference score served as the response variable. Demonstrators’ average flake consumption during observation and flake palatability served as predictors. The formula syntax of this model was the following: eating against preference score ~ demonstrator’s flake consumption + flake palatability. Tests of models’ assumptions were similar to those described above for model A.
In experiment 2, we tested the individual learning and social learning phases separately (N = 19 in each phase), by fitting two generalised liner mixed models (GLMM with a binomial distribution, function glmer() from the lme4 package in R lunguage66). In the individual learning model, the response variable was the cleaners’ binary choices between responsive and tolerant plates in the test phase, plate response type was fitted as a fixed predictor and cleaner identity as a random factor (See Supplementary Note 1). The formula syntax of this model was the following: cleaner’s choice ~ plate response type + (cleaner identity as a random factor). In the social learning model (model C, Supplementary Table 1), cleaners’ binary choices between responsive and tolerant plates was again the response variable. Social observation, response type and the interaction between them were fitted as fixed predictors, and cleaner identity was fitted as a random factor. The formula syntax of this model was cleaner’s choice ~ social observation * plate response type + (cleaner identity as a random factor). For both models, we checked the models’ diagnostics using residual plots, and the normality of residuals for the random factors using qqplots and Shapiro–Wilk tests. R squared for the mixed models was obtained using the function r.squareGLMM(), from the MuMin R package. In addition, we measured the performance of the fish in each treatment, by testing whether their preferences deviated from those expected by random choice (i.e., whether the proportion of tolerant plate choice in each treatment differed from 0.5). This was done using general linear hypotheses tests (GLHT) for the estimates of the mixed models, and P values were adjusted using the Holm method.
In experiment 3, we tested whether treatment group and/or demonstrators’ exhibited preferences affected the subsequent plate preferences of the observer juvenile cleaners. We fitted a generalised linear model (GLM) with a quasibinomial distribution; a distribution that controlled for the overdispersion of the residuals (by using an additional scale parameter). In this model, observers’ choices of demonstrators’ preferred and less preferred plates in the tests was the response variable, while demonstrators’ preferences (proportion of choices of the more preferred plate of each demonstrator during the demonstration phase) and treatment group were the predictors. The formula syntax of this model was the following: cleaner’s choices of demonstrator’s preferred vs. less preferred plates ~ treatment group + demonstrator’s preference. We checked the models’ diagnostics (homogeneity of variance, residual normality and potential violations of linearity) using residual plots.
Ethical note
This study was performed in accordance with the guideline of the Animal ethics committee, Queensland, Australia (approval number: CA 2018/01/1156).
Reporting summary
Further information on research design is available in the Nature Research Reporting Summary linked to this article.
Source: Ecology - nature.com
