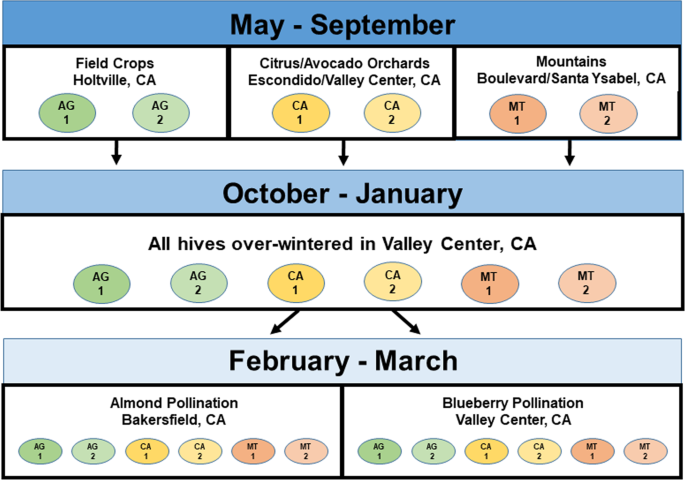
In this study commercial honey bee colonies spent several months in apiaries in an “original landscape”, after which they were moved to a common site. If the original landscape had a short, limited impact on colony growth and behavior, then colonies would be expected to exhibit roughly the same behaviors among themselves after having been moved to the common landscape, or shortly thereafter, irrespective of the original landscape. After several months in the common site, half the colonies were moved to almond pollination and half remained at the common blueberry pollination site. Our goal was to monitor colonies during a typical commercial migration among sites and observe how colonies reacted and adapted to these changes.
The FOB visual assessment detected landscape-level differences among colonies only for the first sampling occasion, in August, across the two years of the study. Colonies from MT sites were, on average, about 10% larger than those from the AG group based on the FOB data. Brood levels were significantly higher among colonies from MT sites than those from the AG sites in August but the opposite was true by October. Average within-hive temperatures were slightly but consistently higher, and temperature amplitudes lower, in the AG colonies than either the CA or the MT colonies until mid-January. However, significant landscape effects on temperature amplitude were only detected starting mid-September (and continuing, with a few exceptions, for each time point until January) and temperature averages starting the end of October until January.
By mid-March no differences were observed between colonies in blueberries and those in almonds pollination with respect to either FOB or brood levels. Average hive temperatures were significantly different between the two pollination sites, but the direction of the difference changed between the two years, suggesting that it may have been due to weather or other environmental factors. The list of potential factors that might give rise to observed differences among the original landscape groups was large and investigative resources limited, so the study focused on agrochemical residues in honey, beebread and wax, and Varroa mite density.
Hive weight data were consistent between years, with hives in almonds gaining weight both years and those in blueberries losing weight in both years. Both the start and end of daily activity were significantly earlier for colonies in almonds compared to those in blueberries, but that was likely related to physical characteristics of the apiaries and how the hives were placed. The direction a hive is facing can affect the timing of the daily activity period25. Much of the hive weight gain during these periods was probably due to nectar and pollen collection. Hive weight loss at night during a nectar and pollen flow has been attributed to moisture loss of the drying nectar and pollen22. Hives in almonds lost on average more than 12 g per h at night while hives in blueberries lost on average less than 7 g per h, which suggests that, assuming the water content of the collected nectar was similar between sites, there was more material to dry in the hives in almonds.
Initial foraging populations were estimated by subtracting the estimated weight loss due to drying from the total hive weight change during the period of initial forager departure in the morning. These forager populations were significantly smaller for colonies placed in almonds compared to those in the blueberry environment, in spite of the higher weight gain for those colonies, which may have been due to a number of factors. One factor is the high density of forage in the almond environment – the colonies in almonds may have been able to maintain a higher foraging success with a smaller forager population compared to colonies in blueberries because of the high density of forage in almonds and/or because almond pollen is highly preferred compared to pollen in the blueberry site. Also, these estimates were made from changes in hive mass over time. It is also possible that forage was much more proximal in almonds, and surfeited foragers started returning as other foragers were still making their initial departure, confounding departures with returns and resulting in an underestimate of the forager population.
Mite levels were low overall and not significantly different among original landscapes, indicating that differences in mite densities were unlikely to explain differences among treatment groups. Varroa mite infestation is strongly correlated with some important viral diseases26 – we assumed a high incidence of at least Varroa-transmitted viral diseases was less likely when mite levels are as low as they were observed here. However, other diseases could also have been differentially distributed.
Pesticide residues were measured as composite samples on the level of the apiary or landscape. Honey samples were found to have few compounds – mainly DMPF, a by-product of the miticide amitraz, and flonicamid, an insecticide. Comb wax, which was only analyzed for the August samples in both years, typically had several compounds at comparatively high levels (>500 ppb). However, the relationship of residue concentrations in wax and bee health has not been firmly established, at least for many of the compounds detected. Wax, being lipophilic, can trap and store compounds, which may remain for years with little exposure to light, moisture or microbial activity. Because the compounds may be embedded in the wax matrix, the exposure of bees to those compounds may also be limited. Averaging across original landscapes and years, colonies kept in the AG and CA sites had on average 15.5 compounds per wax sample, while those in MT sites had on average 12.8 compounds, which is consistent with land use patterns.
Beebread may be the most revealing matrix for estimating the concentrations and diversity of agrochemicals bees are exposed to at a given point in time6. A recent study found that among 6 geographically disparate apiaries in the US, 79 different pesticides and metabolites were observed, with up to 10 distinct modes of action27. While wax and honey can last for many months or even years, bees prefer pollen <72 h old28, so it would more likely reflect the hive’s recent environment than wax or honey. In both August and October, beebread samples from the AG sites had more compounds (13.3 and 11.8, respectively) than either those in CA (11 and 5.8, respectively) or MT landscapes (7 and 8, respectively). These compounds included neonicotinoids, such as imidacloprid, and insect growth regulators (IGRs), such as methoxyfenozide, both of which have been shown to affect thermoregulation in bee colonies8,25. Some compounds, such as methoxyfenozide and flupyradifurone, were at high, albeit sublethal levels29. The IGRs methoxyfenozide and pyriproxyfen have been shown to reduce forager survival4. By October fewer pesticides were being detected overall, but the hives in MT landscapes were clearly being exposed to high levels of fungicides (chlorothalonil), herbicides (chlorthal-dimethyl and prodiamine) and IGRs (methoxyfenozide). Bee colonies were exposed to considerably more different compounds in almond pollination (16.3, averaging across all landscapes and across both years) than in blueberry pollination (5.3) at that time of year.
Agrochemical diversity is an important aspect of the in-hive pesticide exposome – greater compound diversity increases the possibility of interactions among compounds, which may be significant6,30,31. However, compound diversity alone is not likely to be a good measure of risk to bees. The pesticide hazard quotient was developed to take into account compound toxicity and residue concentration5,6. Hazard quotients calculated here showed high values (values >1000 are considered “high”6) for colonies in agricultural areas in the first year, but lower quotients for the same locations in the second year. In October quotients were low overall. Two mechanisms for lower agrochemical concentrations in the composite samples are: (1) bee colonies had largely consumed the pollen collected in the original landscape, given their preference for freshly-collected pollen, and replaced it with pollen from the new site; and (2) agrochemicals had decomposed perhaps through microbial activity. The second mechanism is unlikely, as microbial cell densities in bee bread are generally very low and static, even decreasing over time32. Some samples from the colonies kept in non-agricultural areas (MT) showed very high quotients due to high levels of particular compounds, suggesting the bees in at least some colonies may be been subjected to lethal levels. For samples collected in March, the composite bee bread sample from colonies used for almond pollination had high levels the first year, particularly compared to samples from colonies that remained in blueberries, but much less so the second year. No unusual bee mortality, such as masses of dead adult bees, was noted in any yards at any time.
Another approach would be to consider where and when compounds of known toxicity to honey bees were detected (Table 7). Emamectin benzoate and pyridaben are both comparatively toxic to honey bees but both those compounds were only detected in samples collected in March 2017 (Emamectin benzoate from colonies in blueberries and pyridaben from colonies in almonds) and thus their distribution has little explanatory value. Permethrin, found only in wax samples, is also somewhat toxic to bees29,33 but it was reported from at least one sample from all original landscapes in both years, so its occurrence would not explain landscape differences. A fourth example, chlorpyrifos, is comparatively toxic to bees29,33 and has been found to affect learning behavior at sublethal concentrations34. Chlorpyrifos was detected in beebread in August (both years) only from colonies in the AG group, and again in samples taken in March only from colonies used for almond pollination. Colonies from the AG sites had the highest average brood temperatures and lowest temperature variability, and colonies from almond pollination had the highest daily weight gain, both of which are generally considered positively correlated with colony health.
The observed relationship between chlorpyrifos exposure and colony thermoregulation and weight gain suggests several non-exclusive possibilities, three of which are listed here. Some colony effects may be due to hormesis, defined as a change in the shape of the dose-response curve at low, sublethal concentrations of toxic compounds35. Compounds may cause negative effects at higher concentrations but not at low concentrations. Another possibility is that the LD50 may also be a poor measure of the impact of a compound on colony-level behavior. Several researchers have explored the use of hazard36 or risk quotients37 that take into account acute toxicity as well as time of exposure, insect life stage most at risk of exposure, application method and other factors (e.g., https://www.epa.gov/pesticide-science-and-assessing-pesticide-risks/models-pesticide-risk-assessment). Also, some kinds of exposure may affect honey bee behavior without affecting survivorship. Imidacloprid, which has a comparatively low LD5025,33, had measurable effects on colony behavior at concentrations that had no apparent effect on adult bee longevity8 raising the question of whether there are compounds with higher LD50 values but that also affect colony behavior. Incorporating colony-level behavior studies when evaluating novel pesticides may need to be considered.
A third possible explanation is that the observed distribution of vigorous colonies was not due to agrochemical exposure but rather to other factors such as ambient temperature or food quantity and/or quality. Colonies in the AG sites had greatest access to alfalfa fields; exposure to alfalfa has been associated with lower colony strength in the long term but positive colony growth in the short term36 and those colonies would also have had access to non-crop plants, particularly along irrigation canals and drainage ditches. Even together on the blueberry farm, colonies may still have had variable diets. Bee colonies in commercial blueberry fields in Canada have been found to have a low proportion of crop pollen compared to non-crop pollen and that beebread from those colonies has relatively low nutritional value compared to, for example, colonies placed in apple orchards30. If the bees did not prefer blueberry pollen they may have sought forage elsewhere. Finally, colonies in almond pollination gained weight while those in blueberry fields lost weight. Bee colonies in particular agricultural landscapes may thus thrive in spite of increased agrochemical exposure.
This work concerns a longitudinal study embedded in a commercial beekeeping operation, and was intended to monitor colony growth and activity in ways that would reveal differences among groups that strictly visual assessments may not detect. Such differences were observed and in the case of thermoregulation, those differences were largely consistent between the two years of the study. Colonies clearly adapt many aspects of their behavior and phenology to their current situation, but the effects of previous exposure to other environments can have be longer term and difficult to observe using strictly visual assessments. Owing to resource limitations (mainly sample processing costs), insufficient data was available to conclusively determine the cause of those differences among landscapes. Per hive analyses of agrochemicals and beebread nutritional quality, e.g., amino acid and essential fatty acid concentrations, and bee disease loads (especially for diseases not associated with Varroa) would have been very informative.
Which data in this study were the most valuable, and which data were the best value, taking into account the cost in terms of time and money resources? With respect to measures of colony health, estimating frames of bees was the least expensive, taking usually less than a minute and little cost other than transportation, but was also the least precise and revealed few differences among treatments. Any differences would probably have to be large before they could be detected. Measurement of brood surface area using frame photographs, taken during the visual assessment, had a comparatively low monetary cost (inexpensive cameras can suffice, and the image analysis software was free) and photographing frames can be fairly rapid, but analysis of the resulting photographs was time consuming. Visiting each of 60 hives once could generate 500–800 photographs (depending on the season) requiring on average a few minutes per photograph, and FOB and brood surface area data were collected with 2–4 months between data points. More frequent visits would increase transportation costs and frequency of colony disturbance. Continuous hive weight data showed significant treatment differences, in colony behavior, during a period when no other response variables did, and weight data is easy to collect without disturbing the colonies, easy to analyze and, for the most part, to interpret. However, the precision hive scales used here were expensive and cumbersome to install; less precise scales may be more convenient but may be less effective at detecting differences. Temperature data revealed many differences over a long period, the sensors are fairly inexpensive, and collection and analysis of the data are not time consuming. Further work is needed to improve understanding and exploitation of temperature data; changes in thermoregulation have been shown to be due to many factors. Clearly just one kind of data is unlikely to be sufficient in monitoring colony health.
Source: Ecology - nature.com
