The complete mitochondrial genomes of three adult specimens of T. erytreae collected from citrus plants in Ethiopia (TE-ETH), Uganda (TE-UG) and South Africa (TE-SA) were sequenced with three objectives: 1) to generate reference mitogenomes for future studies, 2) to gain insights into the phylogeographic structure of the species in Africa, and 3) to assess the phylogenetic position of the new mitogenomes within the family Triozidae, using publicly available complete sequences.
Mitogenomics
The Ion Torrent run resulted in an average of 22.5 million reads for each sample with average read length of 175 bp. The de novo assembly generated a contig with 133,872 reads for TE-ETH, a contig with 135,931 reads for TE-UG, and a contig with 31,073 reads for TE-SA. The average sequence coverage was 2,861x for TE-ETH, 2,651x for TE-UG, and 37,460x for TE-SA. A complete mitogenome sequence for T. erytreae was available on Genbank (NC_038142.1), and could potentially be used for the mapping and assembly of the new NGS data. However, the sequence contained an unusual, non-annotated 1,689 bp region between ND2 and tRNATrp, additionally to the annotated AT-rich region (control region). Animal mitogenomes are compact, and do not generally contain large non-coding intergenic regions apart from the control region. Therefore, the new mitogenomes were recovered using de novo assembly and reference-based assembly. The mitogenomes recovered using the de novo assembly did not have the unannotated 1,689 bp region between ND2 and tRNATrp present in NC_038142.1, the only mitogenome available on Genbank for T. erytreae. The reference-based mapping using NC_038142.1, after the excision of the unannotated region, resulted in the mapping of 281,007 reads for TE-ETH, 259,315 reads for TE-UG, and 3.6 million reads for TE-SA. The reference based assembly resulted in an average coverage of 3,062x for TE-ETH, 2,835x for TE-UG, and 39,887x for TE-SA. The de novo and the reference-based assembly methods resulted in identical sequences for each mitogenome, indicating that the sequence NC_038142.1 should be revised, as the 1,689 bp region between ND2 and tRNATrp most probably represents a sequencing or assembly artefact.
The main features were identical in the three mitogenomes, with the typical mitochondrial complement of 13 protein-coding genes (PCGs), 22 transfer RNA (tRNA) genes, two ribosomal RNA (rRNA) genes, and an AT-rich non-coding region generally assumed to contain the control for transcription and replication (Fig. 1). Gene order was conserved in all species included in the phylogenetic reconstruction (Table S1), and identical to the hypothetical ancestral mitogenome organisation in insects. The average size of the complete sequences (15,087 bp) was similar to the average size of the complete mitogenomes of other triozids (15,028 bp). Twenty-three genes were located on the majority (J) strand, and 14 genes were located on the minority (N) strand.
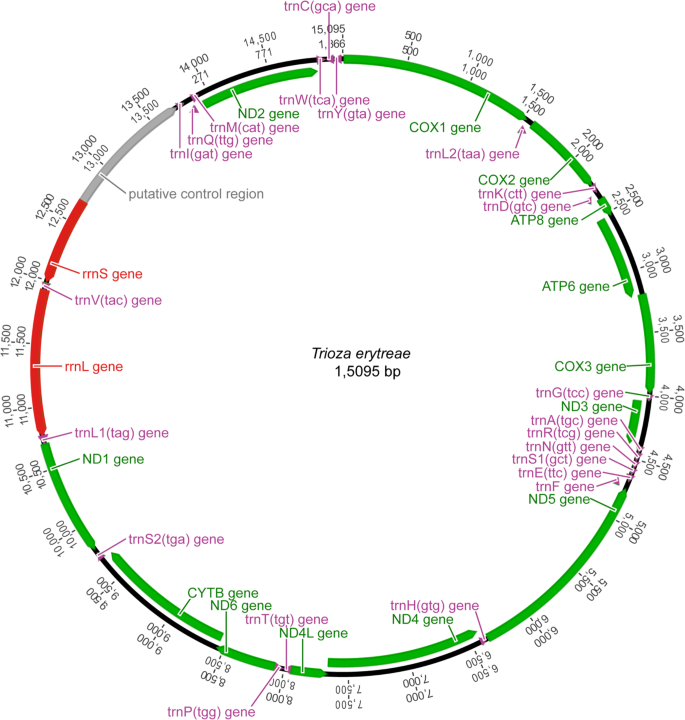
Mitogenome organization of Trioza erytreae. Circular map of the mitochondrial genome of Trioza erytreae. Protein-coding, transfer RNAs and ribosomal genes are shown with standard abbreviations. The arrows indicate the direction of the genes.
The three complete mitogenomes had the high A + T content characteristic of insects, with values higher than 79.9% (complete sequence) in all genes (Table S2). The average A + T content of the AT-rich region (88.6%) was higher than the average for the complete sequences (80.0%), the combined tRNAs (79.0%) and the two rRNAs (79.8%). All PCGs had negative GC-skews, except for COI. Five PCGS (ATP8, ND4, ND4L, ND1 and ND5) had positive AT-skews, while eight PCGs (COII, ATP6, COIII, ND3, ND6, CYTB and ND2) had negative AT-skews (Table S2). The three mitogenomes were equally compact, and had 13 short gene overlaps mostly involving tRNAs. Gene overlaps ranged between 1 and 13 bp, with the largest between tRNAGlu and tRNAPhe. Intergenic regions were found at 15 locations, and represented a total average of 78 bp, the longest of which was between tRNASer2 and ND1 (25 bp). The largest non-coding region (average = 1,054 bp) was located between the 12S rRNA and the I-Q-M tRNA cluster, and was annotated as the putative control region. The large ribosomal RNA gene (16s rRNA; 1,146 bp) was located between tRNALeu1 and tRNAVal, and the small ribosomal RNA gene (12s rRNA; 685 bp) was located between tRNAVal and the AT-rich region. The total complement of 22 tRNAs was identified with ARWEN software, and the sizes of the genes varied between 52 bp (tRNAHis) and 69 bp (tRNALys and tRNAGln). The average combined length of the 13 PCGs was 10,822 bp, representing 71.7% of the total mitogenomes, similarly to other triozids (average 10,801 bp) (Table 1). The largest PCG was ND5 (1,618 bp), and the smallest was ATP8 (153 bp), also in line with the other triozids. The PCGs had an average A + T content of 79.4%, ranging from 75.6% in COI to 85.7% in ATP8. The most frequent start codon was ATG, and all genes were terminated by TNN codons (TAA, TTA, TAG and T) (Fig. S1).
Nucleotide pairwise comparisons showed high similarity between the mitogenomes of the specimens from Ethiopia and Uganda, with only 16 single nucleotide polymorphisms (SNPs) found across the 13 PCGs. All SNPs were transitions, four of which resulted in amino acid changes (Table S3). In PCGs, the largest number of nucleotide differences between TE-ETH and TE-UG was found in COIII and ND1, with three SNPs in each of the genes. The sequences of ND6, ND3, ATP8 and ND4L were identical in TE-ETH and TE-UG. In contrast, an average of 294 SNPs was found between TE-SA/TE-ETH and TE-SA/TE-UG, considering only the PCGs. These SNPs represented an average of 261 transitions and 33 transversions, of which 67 resulted in amino acid changes. The percentage of nucleotide differences between TE-SA and the other two mitogenomes was highest in ATP8 (4.58%), and the percentage of amino acid substitutions was highest in ND4L (2.08%) (Fig. 2). Comparison of tRNA sequences showed 16 SNPs between TE-SA and the other two mitogenomes in 10 genes (tRNAAsp, tRNAArg, tRNACys, tRNAGlu, tRNAGly, tRNALeu2, tRNAPro, tRNASer1, tRNASer2, tRNAThr). In contrast, only one SNP was found between the tRNAs of TE-ETH and TE-UG (tRNATrp).
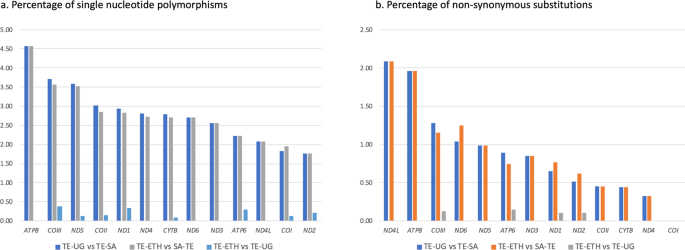
Mitogenome comparisons. Comparison of the mitochondrial sequences of three Trioza erytreae specimens collected in Ethiopia (TE-ETH), Uganda (TE-UG) and South Africa (TE-SA), based on the total complement of 13 protein-coding genes. The number of differences is given as (A) percentage of single nucleotide polymorphisms, and (B) percentage of non-synonymous substitutions, relatively to the size of each gene.
Phylogeny of the family Triozidae
The phylogenetic position of T. erytreae within Triozidae was recovered in a ML tree, using eight other complete mitogenomes publicly available, and two Aphididae as outgroups (Fig. 3). The new T. erytreae sequences formed a monophyletic cluster, in accordance with their low level of divergence. The topology of the mitochondrial tree was not fully congruent with that presented in a recent reconstruction of the superfamily Psylloidea, which employed a combination of mitochondrial and nuclear sequence data across a large number of species27. However, some common features were recovered: T. erytreae and Aacanthocnema dobsoni were closely related, in accordance with their classification in group D by Percy et al. 201827, as well Trioza urticae, Bactericera cockerelli and Paratrioza sinica in group M, and Pariaconus pele and Trioza remota in group A. The differences consisted in the position of Trioza anthrisci (group A), which was not recovered as closely related to P. pele and T. remota (group A), and the relative order of the species clusters representing groups. For example, the cluster formed by T. urticae, B. cockerelli and P. sinica (group M), was not recovered as basal to the other taxa. The recovery of deeper phylogenetic nodes is a well-known limitation of mitochondrial-based phylogenies, and the inclusion of nuclear sequence data is often necessary for the assessment of higher divergences28. Therefore, these results should be interpreted conservatively.
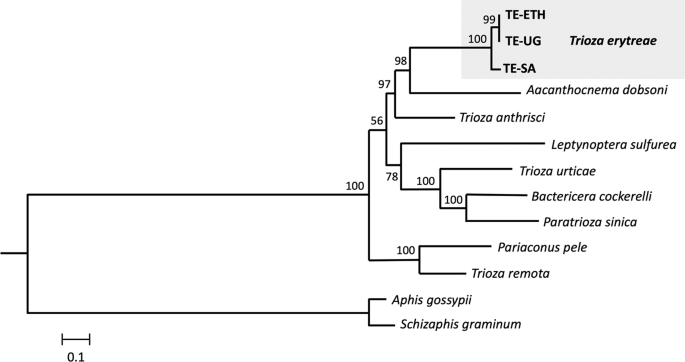
Mitochondrial phylogeny of Triozidae. Maximum likelihood tree representing the phylogenetic relationships within the family Triozidae, using the complete complement of the 13 mitochondrial protein-coding genes. Aphis gossypii and Schizaphis graminum (Aphididae) were used as outgroups. Values represent nodal support calculated from 1,000 bootstrap replicates. The length of the branches is proportional to the number of substitutions per site.
Intraspecific diversity of Trioza erytreae
The intraspecific genetic diversity of T. erytreae was assessed using a dataset of COI barcoding sequences identified as T. erytreae collected in Africa and Europe in two previous studies25,26 (Table S4). The final COI dataset (n = 89) included the three sequences generated in the present study, and was strongly biased towards Kenya, which represented 75.2% of all sequences (n = 66), followed by South Africa (14.6%; n = 13). Europe was represented by specimens collected in Portugal and Spain (n = 7), the only countries where T. erytreae has been found outside Africa. The COI dataset was analysed using a MJ network, a NJ tree, and estimates of genetic divergence (p-distances).
The MJ network revealed phylogeographic structuring of T. erytreae haplotypes, and their association with the different plant hosts (Fig. 4). Branch I was formed by two closely related haplotypes (Hap1 and Hap2), and included the majority of specimens found on citrus, some specimens found on Clausena anisata, Murraya koenigii and Stephania abyssinica in Kenya, and the single specimen from Tanzania found on citrus. Branch II (Hap3, Hap4 and Hap5) included all specimens collected from citrus plants in Portugal, Spain and South Africa, and one specimen collected in Kenya, also found on citrus. The specimens collected in Portugal and Spain had a single haplotype (Hap4) which was shared with South Africa, and closely related to Hap5 (South Africa) and Hap3 (shared between South Africa and Kenya). This haplotype similarity suggests that T. erytreae found in Europe most likely originated from South Africa, although the possibility of a Kenyan origin cannot be excluded. Branch III (Hap6) included a single specimen found in Kenya on C. anisata, and Branch IV represented the haplotype found in Ethiopia and Uganda on citrus. Branches V, VI and VII (Hap8, Hap9 and Hap10) represented the highly diverged haplotypes found in Kenya on C. anisata.
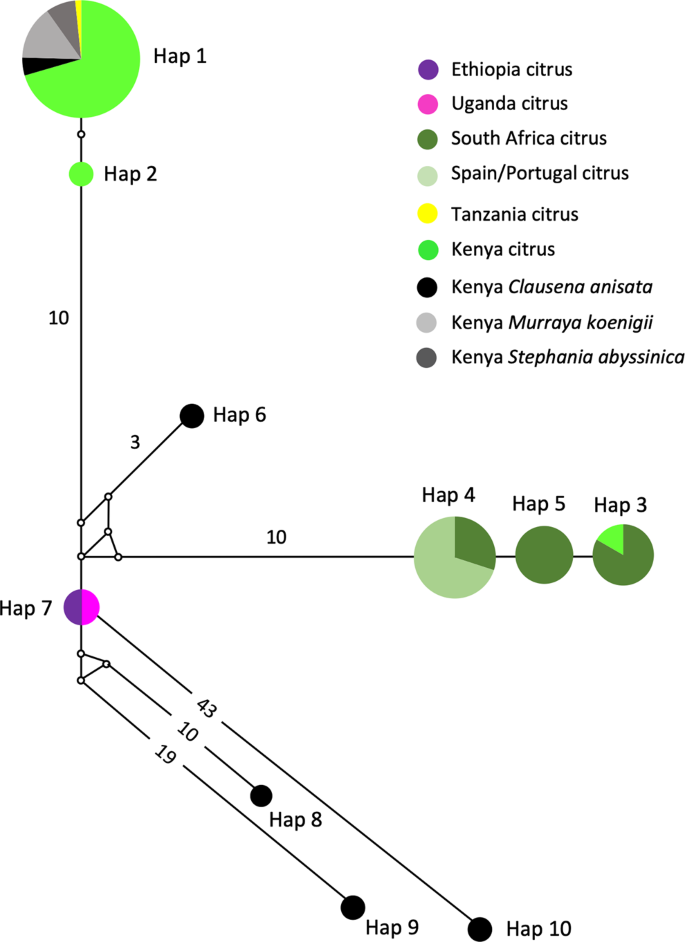
Network of Trioza erytreae haplotypes. Median-joining network of cytochrome c oxidase subunit 1 (COI) gene (607 bp) of Trioza erytreae (n = 89), showing the relationships between haplotypes according to geographic origin and plant host. The size of the circles is proportional to the number of individuals sharing the same haplotype. The length of the branches is proportional to the number of nucleotide substitutions between haplotypes. Numbers along branches indicate the number of substitutions between haplotypes.
The p-distances among all pairs of haplotypes represented in the network (Hap1 to Hap10) allowed for further inferences on the genetic diversity of T. erytreae (Table 2). The high p-distances between Hap8, Hap9 and Hap10 and other sequences, presented in the MJ network in the previous section, was confirmed. Hap10 was the most diverged haplotype, with a p-distance from all other haplotypes higher than 7.65%, followed by Hap9 which diverged from all other haplotypes by more than 5.24%. These values suggest that Hap9 and Hap10 represent two species distinct from all other haplotypes. Hap8 had a different pattern of p-distances relatively to the other haplotypes, as it diverged from Hap1, Hap2, Hap3 and Hap4 by more than 5.06%, suggesting that it represents a distinct species, but had a lower divergence from Hap6 (3.63%, Kenya) and Hap7 (2.82%, Ethiopia and Uganda). Overall, the high divergence among some of the COI sequences displayed in the MJ network and the p-distances among the haplotypes indicated that not all specimens morphologically identified as T. erytreae in the publicly available dataset belong to the same species. This pattern of high intra-specific divergence found in T. erytreae (maximum p-distance = 11.71%) was not observed in the majority of the other 30 Trioza species analysed, for which the average maximum intraspecific p-distance was 1.11%. The exceptions were Trioza urticae (4.18%), and Trioza anceps (14.27%), which may represent cases of accidental misidentification or cryptic diversity (Fig. 5; Table S5).
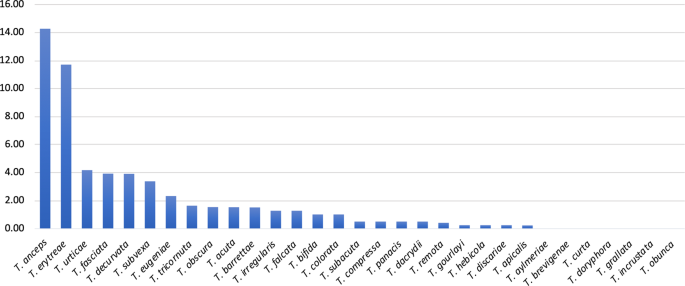
Genetic divergence within Trioza species. Intra-specific pairwise distances (K2P) in 31 species of the genus Trioza (Triozidae), based on cytochrome c oxidase 1 (COI) sequences.
The relationships among COI sequences of T. erytreae were also represented using an NJ tree (Fig. 6), which recovered the pattern of genetic divergence among haplotypes evidenced in the MJ network. The most basal sequences in the NJ tree were Hap8, Hap9 and Hap10 – all represented by specimens found in Kenya on C. anisata – in accordance with the high p-distances among these haplotypes and the other sequences. The bootstrap support for these basal nodes was low, as typically occurs in trees constructed using short COI sequences among distantly related taxa29.
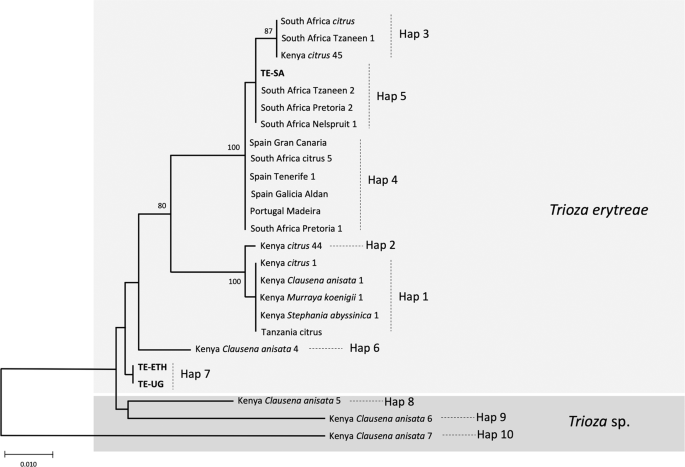
NJ tree of Trioza erytreae haplotypes. Neighbour-joining tree representing the relationships among haplotypes of Trioza erytreae collected from citrus and other plant hosts in Africa and Europe. The tree was constructed using a 571-bp alignment of cytochrome c oxidase subunit 1 (COI) sequences. Nodal support was calculated using 1,000 bootstrap replicates. The length of the branches is proportional to the number of substitutions per site.
African citrus triozids may represent a species complex
In face of the overall results, a hypothesis explaining the genetic diversity of T. erytreae is presented in the NJ tree, and proposes that Hap8, Hap9 and Hap10 constitute three cryptic Trioza sp. distinct from T. erytreae, which is represented by the remaining haplotypes. However, this hypothesis is based on the analyses of a low number of sequences representing a short region of COI, a genetic marker that should not be used for species delimitation30. Therefore, our proposal is probably an oversimplification of the complex phylogenetic relationships among African citrus triozids, and additional genetic, morphological and ecological data will be necessary to draw definite conclusions. Nevertheless, these results indicate cryptic diversity in T. erytreae, and suggest that the degree of association between specific insect genetic subgroups and specific plant hosts should be further investigated.
The genetic diversity of African citrus triozids collected from C. anisata was particularly striking, as this plant hosted the highest number of haplotypes, including the haplotype most frequently found in Kenya on citrus (Hap1), and the three haplotypes that potentially represent cryptic species (Hap8, Hap9 and Hap 10). This result indicates that C. anisata is an important reservoir for African citrus triozid diversity, and that future insights into the genetic diversity of the insect could be obtained from the survey of specimens collected from this particular plant host. In South Africa, where C. anisata is commonly infected with LafCl, the bacterium has not been detected on citrus, in spite of the two plant species being frequently found in proximity. In contrast, LafCl has been reported from citrus in Uganda and Tanzania18,19. This apparent contradiction requires further study, as it can be hypothesized that the T. erytreae haplotypes or cryptic species present on C. anisata in South Africa differ from those in Uganda and Tanzania, and do not necessarily feed on citrus.
It is also noteworthy that, among the diversity of genetic lineages found in T. erytreae, only one lineage (represented by the closely related Branches I and II) seems to be successful on citrus in Kenya, Tanzania, South Africa and Europe. Interestingly, the haplotype found in Uganda and Ethiopia (Hap7, citrus) represents a distinct branch not found in Kenya or South Africa. This suggests that triozids affecting citrus plants in Ethiopia and Uganda may represent local phylogeographic lineages. Another interesting aspect is the pattern of divergence of Hap8 (Kenya, C. anisata) relatively to the other haplotypes. Hap8 was genetically distinct from all other haplotypes with p-distances higher than 4.89%, except for Hap6 (3.63%), which was also found in Kenya on C. anisata, and Hap7 (2.82%), the haplotype found in Ethiopia and Uganda. Although the use of p-distances based on DNA barcodes for species delimitation is controversial, and universal threshold cannot be established30, this result warrants further investigation for elucidating the taxonomic status of African citrus triozids. For that purpose, phylogenetic, genetic diversity and morphological analyses should be performed using a larger sequence dataset across the geographical range and host diversity of T. erytreae. Due to the limitations of mitochondrial DNA for the recovery of deeper divergences, and detection of hybridization and introgression events, definite answers may require the analysis of nuclear sequence data. In addition, the evidence for cryptic diversity in African citrus triozids, currently classified as T. erytreae, opens questions regarding potential association between specific genetic lineages of the vector and the genetic diversity of Liberibacter.
Finally, elucidating the phylogeographic structure and genetic diversity of T. erytreae can contribute to understand the dynamics of transcontinental dispersal of the insect and associated citrus pathogens. This aspect is critical for the management of triozid-mediated citrus disease in the current scenario of global trade, and the recent evidence for the high potential for invasion of African citrus triozids. For example, China was excluded as the probable source of D. citri in California, based on the close relationship of the Californian mitochondrial haplotypes, where the psyllid was detected in 2008, with those found in Florida, where the psyllid was detected in 199831. The characterization of the phylogeography of T. erytreae will contribute to elucidate the origin of the recent invasion of Europe, and to model potential routes for global dissemination of citrus diseases transmitted by African citrus triozids.
Source: Ecology - nature.com
