Our understanding of changes in Earth system processes depends on models1,2. Model-based attribution, quantifying the importance and magnitude of causal factors for a detected change3, is routinely used to assess the relative contributions of anthropogenic factors and natural variability on Earth system phenomena, ranging from precipitation extremes to decadal-scale changes in net carbon uptake4,5,6,7,8. For land carbon metabolism, attribution typically focuses on net land uptake of CO2 (ref. 9). While this quantity is important to inform climate policy, e.g., Paris Climate Accords, it is the disequilibrium across many processes—such as heterotrophic respiration and fire emissions—with uncertain magnitude and spatiotemporal patterns7,9,10. This suggests that an improved understanding of the net land-atmosphere CO2 signal can be achieved by examining each component flux, and relevant drivers of change, individually.
Here we use a novel dual constraint approach to attribute centennial scale changes in GPP at grid cell to global scales. GPP is of central importance for the net carbon balance as it represents the entry of carbon into land ecosystems such that all other processes are downstream. We quantify changes in GPP due to natural climate variability, land use/land cover change, greenhouse gases, and nitrogen deposition. Our approach uses two broad ensembles of Earth system models (ESMs): (1) a 11-member ensemble of observation-driven land surface models—corresponding to the land component of ESMs in offline mode—from the Multi-scale synthesis and Terrestrial Model Intercomparison Project (MsTMIP) (ref. 11); and (2) an 13-member ensemble of fully coupled ESMs from CMIP5, the fifth phase of the Coupled Model Intercomparison Project12. We also use machine learning to recover the change in GPP for the individual offline climatic factors of heat (near-surface air temperature), water (precipitation), and light (downwelling shortwave radiation). This is based on the emulation (see Methods) of MsTMIP where only climate varies and then sequentially retrieving the contribution of each climatic factor by simulation differencing9.
Enhanced GPP is the basis by which land ecosystems buffer climate change. Model-based reconstructions indicate significant changes in gross uptake of carbon by the vegetated land surface over the 20th Century. From 1901 to 2010 GPP has increased globally (Fig. 1) by 10.5 Pg C per annum (uncertainty range: +8.2 to +12.4 Pg C per annum), in qualitative agreement with long-term atmospheric records of carbonyl sulfide13, and equivalent to 9% of current satellite-era global GPP of 119 Pg C per annum2. Increases in GPP are centered on the tropics as well as forested regions of the USA and Eurasia. In addition, both amplitude (difference between seasonal maximum and minimum) and volatility (changes in year-to-year variation) have increased. Changes in amplitude are most pronounced in the Northern Hemisphere (Fig. 1) and are overwhelmingly positive; by area 60% of vegetated land ecosystems have seen an increase versus only 2% where a decline occurred. The spatial footprint of changes in volatility shows that 62% of vegetated land ecosystems have seen at least a doubling of volatility versus <1% where volatility decreased. The largest changes in volatility, where year-to-year changes are at least tenfold larger in the satellite-era, are centered on the northern high latitudes and the Eurasian Steppe (Fig. 1), supporting the importance of these regions—particularly arid and dryland systems–in driving the interannual variability and trend of net carbon uptake14.
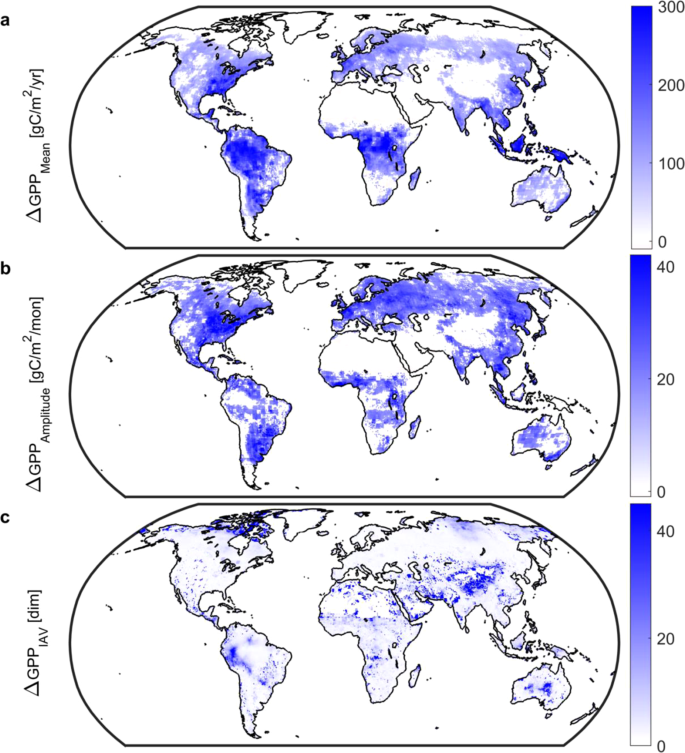
Long-term (1901–2010) changes in gross primary productivity (GPP). Changes in (a), mean annual GPP.; (b), monthly GPP amplitude.; and (c), interannual variability. Mean and amplitude values calculated as the difference between 1981–2010 and 1901–1930 periods; positive values indicate an increase over time. Interannual variability, an index of volatility in land ecosystem carbon metabolism, is the ratio of standard deviations using deseasonalized GPP, e.g., a value of 2 indicates that 1981–2010 variability in gross uptake is twice that of the 1901–1930 period. All maps based on CMIP5 and MsTMIP. White grid cells are water, barren, or exhibited no significant change. Note difference in color scales. Figure created in Matlab version R2019a (http://www.mathworks.com/products/matlab/).
We find that anthropogenic forcings—primarily well-mixed greenhouse gases (see Methods)—are the source of these changes in GPP. Indeed, from the perspective of GPP we had already entered the Anthropocene, where human agency represents the most important geological forcing15, no later than the turn of the 20th Century. Integrated globally, the impactof anthropogenic forcings has increased from -0.1 (1901 decade) to +15.6 Pg C per annum (2001 decade) and acts to enhance GPP. In contrast, natural forcings (solar irradiance and volcanic aerosols) show an ever changing, over space and time, pattern of small effect sizes (typically <1 Pg C per annum globally in absolute value with a mean of -0.02 Pg C per annum from 1901 to 2010; Extended Data Fig. 1) with the largest volatility in the tropics. Spatial footprints in the first decade of both the 20th and 21st Centuries show a predominance of anthropogenic factors (Fig. 2) with changes in GPP across 57% (1901 decade) and 94% (2001 decade) of all vegetated land ecosystems linked to human agency. Through time there is a clear trend toward total anthropogenic control of changes in GPP.
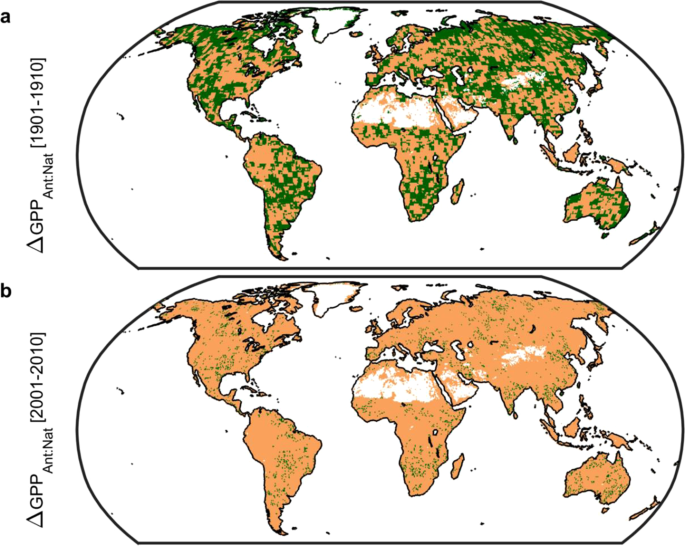
Spatial pattern of changes in gross primary productivity (GPP) due to anthropogenic forcings. (a), Map of 1901 decade. (b), Map of 2001 decade. Areal extent of GPP change due to anthropogenic forcings: 57% and 94% for 1901 and 2001 decades respectively. Values calculated as the ratio of absolute values of anthropogenic to natural forcing-induced changes in GPP using CMIP5 models only (see Methods). A ratio greater than unity (brown) indicates that anthropogenic forcings (primarily well-mixed greenhouse gases) dominate; whereas green indicates natural forcings (solar irradiance and volcanic aerosols) dominate. Figure created in Matlab version R2019a (http://www.mathworks.com/products/matlab/).
Among individual attribution factors considered, changes associated with the CO2 fertilization effect and nitrogen deposition are largest (Fig. 3). The CO2 effect has monotonically increased from +3.7 (1901 decade) to +19.8 Pg C per annum (2001 decade); a fivefold increase now equivalent to 17% of contemporary global GPP2. The impact of CO2 fertilization is most pronounced in the tropics and Southeast Asia (Fig. 3) and shows an increasing trend and spatial footprint poleward from the equator since the 1960’s (Extended Data Fig. 2). Nitrogen deposition (Fig. 3) has similarly acted to enhance GPP. This effect has grown from +1.6 (1901 decade) to +11.1 Pg C per annum (2001 decade) and is focused on industrialized areas in North America, Europe, and China (Extended Data Fig. 2). In contrast, land use and land cover change (LULCC) is associated with a negative impact globally (-1.3 Pg C per annum across all decades or 1% of contemporary global GPP) and the most relative uncertainty (Fig. 3). These impacts —driven by degrading high GPP systems (forests) to low GPP systems (shrublands)—are dominant in the eastern USA, Europe, China, and the tropics. Unlike CO2 and nitrogen deposition, the LULCC effect is less variable in time; it shows a relatively static spatial footprint through the 20th Century (Extended Data Fig. 2).
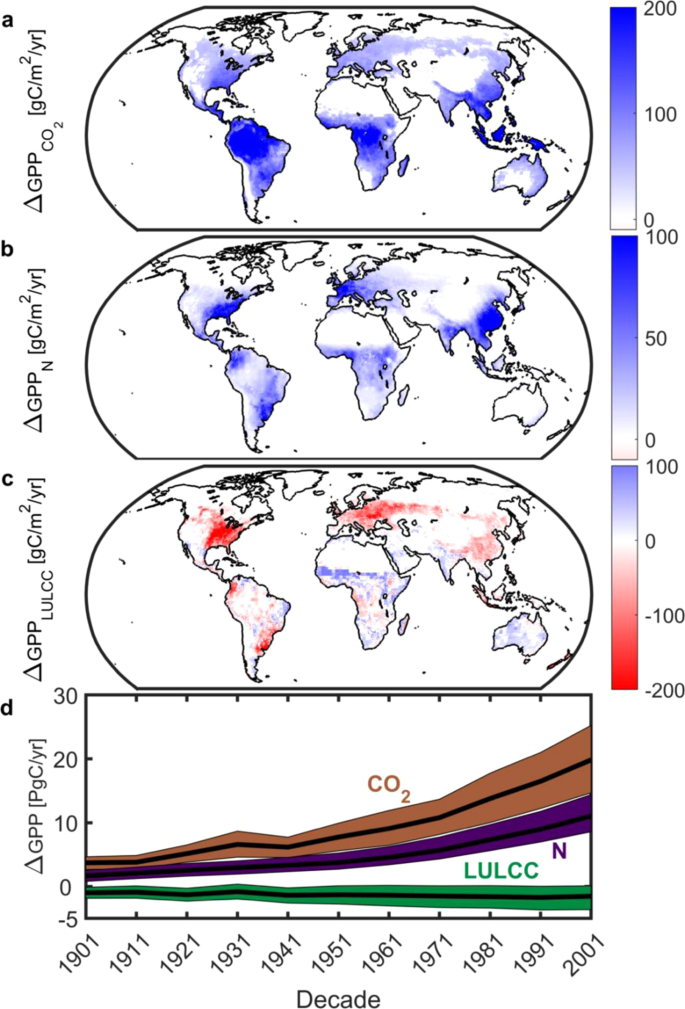
Anthropogenic controls of changes in gross primary productivity (GPP). Spatial long-term mean (1901–2010) changes in GPP due to (a), CO2 fertilization (CMIP5 and MsTMIP); (b), nitrogen deposition (MsTMIP only); and (c), LULCC (CMIP5 and MsTMIP). White grid cells are water, barren, or exhibited no significant change. Note difference in color scales. (d), Decadal changes in GPP due to CO2 fertilization (brown), nitrogen deposition (purple) and land use and land cover change (LULCC; green). Color envelope: 90% confidence interval around mean (black line). Figure created in Matlab version R2019a (http://www.mathworks.com/products/matlab/).
Using a machine learning-based approach to decompose the net climate signal from the MsTMIP ensemble into temperature, precipitation, and radiation effects (see Methods) we find that climate change has functioned as climate fertilization—changes in climate have acted to increase gross uptake. Globally this effect is modest (Fig. 4), with a long-term average of +0.3 Pg C per annum, but has increased in recent decades to +1.4 Pg C per annum (2001 decade), equivalent to 50% of the contemporary net land sink1. Of all three climate effects temperature elicits the largest changes in GPP (Fig. 4) and has the largest spatial footprint (Fig. 5) while changes in radiation exhibit only a weak influence on GPP. Spatially, and in agreement with the effect of growing season temperature on peak GPP16, we find that temperature has enhanced GPP in the mid to northern latitudes. In contrast, 20th Century changes in temperature and precipitation have acted to depress GPP in the tropics (Fig. 4). Even though changes in climate are important regionally and exhibit a similar overall areal extent as LULCC, the spatial footprint of changes in GPP is driven by CO2 fertilization. Across 58% of the vegetated land surface changes in CO2 serve as the most dominant factor (Fig. 5).
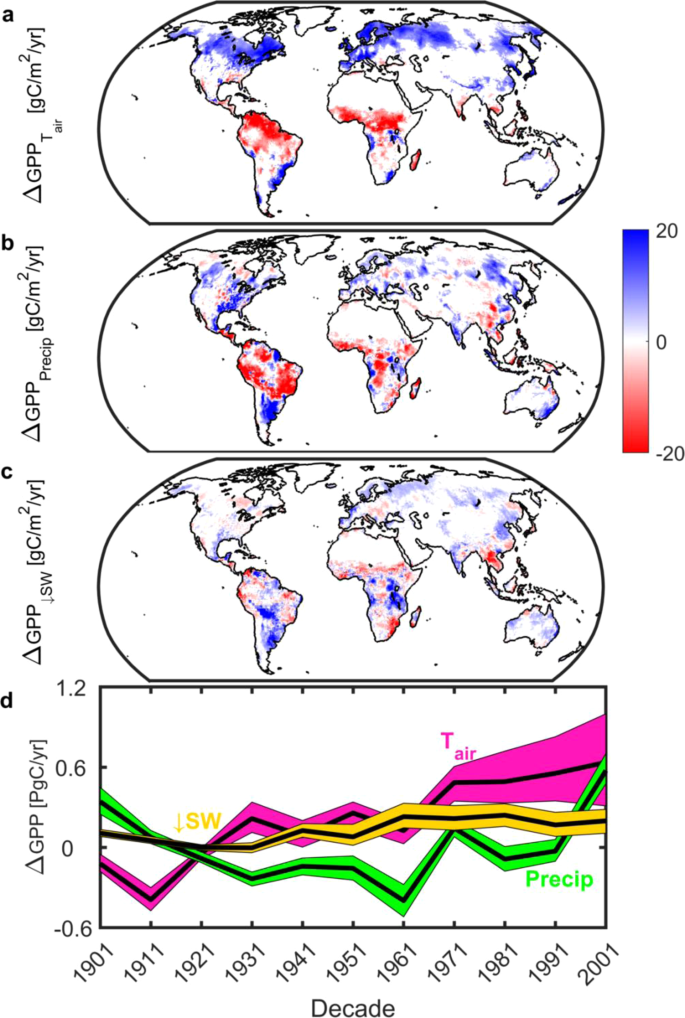
Climatic controls of changes in gross primary productivity (GPP). Spatial long-term mean (1901–2010) changes in GPP due to (a), air temperature; (b), precipitation; and (c), downwelling shortwave radiation. White grid cells are water, barren, or exhibited no significant change. (d), Decadal changes in GPP due to air temperature (cyan), precipitation (green) and downwelling shortwave radiation (gold). Color envelope: 90% confidence interval around mean (black line). All values derived from MsTMIP only. Figure created in Matlab version R2019a (http://www.mathworks.com/products/matlab/).
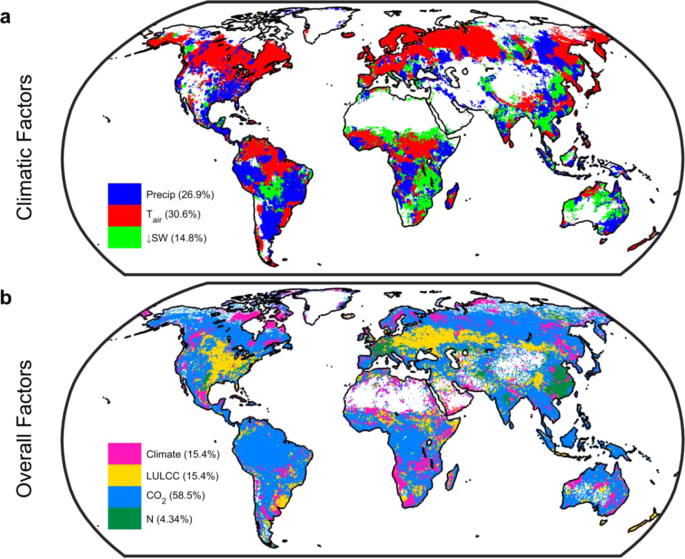
Controlling factors for changes in gross primary productivity (GPP). Spatial long-term mean (1901–2010) changes in GPP due to (a), individual climatic factors (emulator-based; see Methods) and; (b), climate, land use and land cover change (LULCC), CO2 fertilization, and nitrogen deposition (N) factors (based on simulation differencing). Values in parenthesis give percent of vegetated land surface where the effect predominates. Maps derived using MsTMIP models only (see Methods). White grid cells are water, barren, or exhibited no significant change (28% of the vegetated land surface for individual climatic factors and 6% for overall factors). Figure created in Matlab version R2019a (http://www.mathworks.com/products/matlab/).
While ESMs agree that anthropogenic factors have dominated changes in GPP over the 20th Century, care is warranted in interpretation. What constitutes an anthropogenic forcing varies across the CMIP5 ensemble and not all MsMTIP models simulate each sequential control. This is reflected in the confidence bounds (see Methods) for each factor. The total change due to CMIP5 anthropogenic forcings in the 2001 decade is +15.6 Pg C per annum, albeit with substantial uncertainty (+10.4 to +43.5 Pg C per annum). This is lower than but consistent with the corresponding figure from MsTMIP—equating the effects of CO2 fertilization, nitrogen deposition, and LULCC to anthropogenic forcings—of +25.6 Pg C per annum (uncertainty range: +16.1 to +35.8 Pg C per annum). This, in turn, matches the sum, +29.3 Pg C per annum (uncertainty range: +19.6 to +39.7 Pg C per annum), of individual anthropogenic factors (CO2 fertilization, nitrogen deposition, and LULCC) explicitly considered across both CMIP5 and MsTMIP ensembles. This consistency is supported by the similar effect sizes of CO2 fertilization and LULCC individually (nitrogen subsidy is only addressed in MsTMIP) across both ensembles (Extended Data Fig. 3). Finally, adjusting the CO2 effect downward to correct for the missing (and negative) vegetation-carbon feedback component of CO2 fertilization17 lowers this human agency effect to +24.8 Pg C per annum, again consistent with both CMIP5 and MsTMIP ensembles. In any case, the dominance of anthropogenic drivers in controlling changes in GPP since 1901 is clear, with CO2 fertilization and nitrogen subsidy the most important drivers in time, space (for CO2 only), and magnitude.
Despite this secular trend in GPP, there is substantial unresolved ambiguity surrounding both leading anthropogenic drivers in CMIP5 and MsTMIP. Evidence supporting the CO2 fertilization effect—the dominant driver of GPP enhancement since 1901—is supported by first principles of plant physiology but is otherwise mixed. According to recent studies, the CO2 fertilization effect is simultaneously underestimated for GPP in ESMs18, overestimated for NPP (GPP after autotrophic respiration has been subtracted) relative to satellite-derived products19, or not present in biomass growth for undisturbed tropical forests20 or in tree growth for western Canadian subalpine forests21. In contrast, a 100 ppm increase (roughly the 20th Century) in CO2 is linked to a 35% increase in net photosynthesis based on isotopic signatures of deuterium in historic plant material and manipulation experiments22. Furthermore, when warming and CO2 fertilization are considered jointly, the latter is not associated with any growth enhancement, as seen in the Canadian boreal forest23 and in high-elevation forests of central Mexico24. Moreover, there are clear indications of sink saturation, suggesting on upper limit of uptake, especially in forest systems25. Finally, neither CMIP5 nor MsTMIP allow the vegetation-carbon feedback component of increasing CO2 concentrations to be quantified, potentially resulting in a 30% overestimation of the CO2 fertilization effect17.
A similar ambiguity concerns the effects of nitrogen subsidy. These occur in the context of a critical load past which additional nitrogen inputs have potentially deleterious impacts on ecosystem function, from mortality to changes in community composition, carbon allocation and growth rates26,27. For extratropical forests this critical load is estimated at 10 to 20 kg N/ha per annum overall26 but can be significantly lower for specific forest types, e.g., USA northern forests show declined survivorship at as low as 3 kg N/ha per annum27. In tropical forests the knowledge base is more limited and experimental evidence for a significant positive effect equivocal28,29. This holds especially in primary and lowland forests and is linked to phosphorous availability28,30, which is not addressed in either ensemble. Focusing on MsTMIP, where nitrogen subsidy increases by a factor of five, the percent area of impacted extratropical forests where positive nitrogen subsidy exceeds the minimum threshold increases monotonically from 1% (1901 decade) to 29% (2001 decade). External nitrogen inputs also always enhance gross uptake in tropical forests (Fig. 3), with a mean subsidy of 3.5 kg N/ha per annum—increasing monotonically from 1.1 (1901 decade) to 8.6 kg N/ha per annum (2001 decade)—eliciting a mean GPP increase of 30.1 g C/m2 per annum.
Both CMIP5 and MsTMIP heavily condition on the CO2 fertilization effect and—especially for MsTMIP models with carbon-nitrogen coupling9—external nitrogen to drive positive changes in gross carbon uptake. This occurs without any sign of agnostic effects or saturation; both nitrogen subsidy and levels of CO2 are highly correlated (ρ = 0.99) with GPP across decades globally. This is problematic in that resolving the efficacy of both anthropogenic drivers is a prerequisite to reducing the persistent and large uncertainties in the carbon cycle-climate feedback10,31. Beyond this, there are other innovations needed to narrow the range in simulated values. Especially relevant for changes in GPP is the treatment of agricultural systems where there is strong evidence that modeled estimates of GPP are systematically biased low32. As CMIP5 and MsTMIP do not include explicit crop modeling, attributed changes in GPP, particularly in the context of LULCC, are likely skewed. Evidence that recent enhanced global GPP is driven by croplands33 reinforces the nascent trend of embedding agriculture submodules into coupled Earth system models32,34.
More generally, state-of-the-art land modeling frameworks still lack processes that materially impact trajectories of GPP; such as nutrient cycling, dynamic vegetation and disturbance35,36. The increasing complexity of modeling frameworks and questions asked of them itself requires an updated approach to address heterogeneity in process representation, tiling schemes that vary by process within model, and tracking changes in parametrizable ecosystem properties36. Focusing on the lead anthropogenic drivers over the 20th Century, knowledge base improvements for the CO2 fertilization effect and explicit parameterizable linkages between carbon cycling to nitrogen and phosphorus biogeochemistry37 are crucial to better constrain global GPP. This, in turn, points to the need of continuous iteration between modeling, data science, and experimental communities to improve predictive capacity36. As there is already evidence that future estimates of net carbon cycling may be biased upward when nutrient limitation is not considered9,38, a more robust treatment is more urgent still given the diminishing climate policy window to effect meaningful change in the trajectory of global change, past drivers of GPP enhancement notwithstanding.
Source: Ecology - nature.com


