Extraction condition optimization
The tubers of C. yanhusuo were selected, which were irregular and oblate in appearance and 1~2 cm in diameter. The best tubers were big, plump, solid, yellow and bright in inner color. To maximize extraction efficiency and the amount of fingerprint information, we optimized extraction conditions using a univariate approach, which included the optimization of extraction solvent (methanol, 70 vol% aqueous ethanol, 70 vol% aqueous ethanol + 0.2 vol% acetic acid) and number of extractions (1, 2, or 3). The number and area of chromatographic peaks were maximal for 70 vol% ethanol, which was therefore selected as the extraction solvent. The influence of the number of ultrasonication-assisted extractions on extraction efficiency was investigated by extracting powdered samples with 70 vol% ethanol for 1, 2, or 3 times (30 min at a time). Extraction efficiency is increased with the number of extractions, but the peak areas of target compounds did not significantly increase after two times. Thus, the optimal extraction condition was established as 2 × 30 min ultrasonication-assisted extraction with 70 vol% aqueous ethanol.
HPLC condition optimization
Detection wavelength, column temperature, flow velocity, mobile phase, and gradient elution procedure were optimized to obtain as much chemical information as possible and achieve the best separation of adjacent peaks in the fingerprint chromatograms of C. yanhusuo within a short time. Based on the maximum absorption and full-scan experiment data of marker components in the UV spectra of three-dimensional chromatograms obtained by photo-diode array detection, detection wavelengths in the range of 210~350 nm (especially 210, 254 and 280 nm) were tested to maximize the number and resolution of all marker compound peaks. As a result, the peak height varies greatly with the wavelength change. Considering the appropriate peak height of the reference material and the chromatogram of the samples, 280 nm was chosen to record characteristic chromatographic patterns and improve the corresponding baseline. For resolution enhancement, the column temperature (30 or 40 °C) and mobile phase flow velocity (1 or 0.8 mL/min) were considered, and the best peak separation and shape were obtained at 40 °C and 1 mL/min. The investigation of the effect of mobile phase composition (methanol-water and acetonitrile-water with different modifiers such as acetic acid and triethylamine) on chromatographic separation showed that although the peak number was maximized in the case of acetonitrile-water, this system could not achieve satisfactory separation. As the addition of acidic modifiers can increase alkaloid peak separation and minimize peak tailing by restraining ionization24, acetic acid was added to the acetonitrile-water system to further improve peak shape. As a result, the best peak resolution/separation, sensitivity, and selectivity were obtained in the presence of 0.06 vol% triethylamine and 0.06 vol% acetic acid at pH 4.0. In the process of gradient optimization, which involved the testing of different gradient time, procedures, and initial mobile phase compositions, the best separation was attained within 90 min using the optimized procedure.
Validation of the quantitative analysis method
The developed method was validated in terms of precision, stability, and reproducibility. Moreover, a well-linear relationship between the peak area and concentration of each reference compound (R2 > 0.9998) was observed for all analytes within the test range. For precision evaluation, a sample (S6) of medicinal material of C. yanhusuo prepared as described above was subjected to five-fold HPLC analysis on the same day. Stability was analyzed in 0, 2, 4, 6, 12, and 24 h within two days, and repeatability was examined by injection of five different samples prepared using the same procedure. Variations were expressed as relative standard deviations (RSDs). Precision based on the relative retention time of common peaks was in the range of 0.07–0.50%, and that based on bioactive component peak areas was in the range of 0.67–2.27%. The stability (RSD, n = 5) of measurements over two days ranged from 0.15 to 0.61% of the relative retention time and from 0.72 to 3.27% of the peak area. In the case of reproducibility, the RSDs of relative retention time and peak area varied from 0.04 to 0.46% and from 1.00 to 3.68%, respectively. Thus, the results showed that the developed method was sufficiently precise and accurate (RSD < 3%) for quantitative profiling of C. yanhusuo from different regions, meeting the technical requirements of fingerprinting.
HPLC fingerprint establishment and similarity analysis (SA)
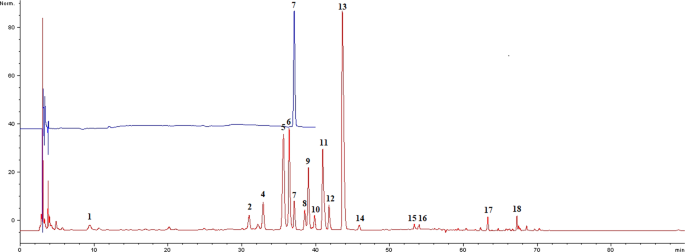
Calibration of THP in HPLC fingerprint. However, the study didn’t identify these characteristic chromatographic fingerprint peaks for C. yanhusuo samples except THP, which was used as the only identification control component specified in Pharmacopoeia of the People’s Republic of China25. As THP is one of the most important active constituents of C. yanhusuo26, its peak was chosen as a reference (retention time = 37 ± 1 min, Peak 7 in Fig. 1).
Position of the THP peak in the fingerprint.
Analysis and comparison of HPLC fingerprints
The chromatographic fingerprints of 23 C. yanhusuo samples originating from different locations and processed by different methods are presented in Fig. 2. In general, characteristic peak selection was based on the criterion that peaks found in each chromatogram of variable-location samples should be well separated under the given chromatographic conditions and have relatively large areas in different profiles27. The reference fingerprint (marked as R in Fig. 2) was established as the median of 23 chromatograms to identify and evaluate the quality of C. yanhusuo, and 18 peaks were extracted as characteristic common peaks. To facilitate identification and analysis, the whole chromatogram was divided into three areas, namely area A (retention time 0–29.0 min), area B (retention time 29.1–45.0 min), and area C (retention time 45.1–90 min). Among the fingerprints of these areas, that of area B was subject to least change and exhibited obvious characteristics, which allowed area B to be used as a characteristic area of C. yanhusuo. Conversely, the fingerprints of areas A and C were broadly variable, featuring chromatographic peaks and peak areas dependent on sample origin and processing method, which could be used as the basis for the identification of this medicinal material.
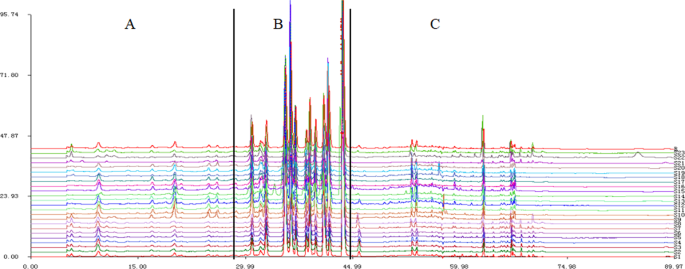
HPLC fingerprints of the 23 C. yanhusuo samples (S1–23, Table 1) and the reference fingerprint (R) obtained by the Similarity Evaluation System for Chromatographic Fingerprint of Traditional Chinese Medicine software (Version 2004A, Chinese Pharmacopoeia Committee, Beijing, China).
Effects of processing on HPLC fingerprints
Samples 1–8 and 22–23 were unprocessed (crude drugs), 9–20 were boiled (cooked drugs), and sample 21 was sulfur-fumigated. For better comparison, we used samples originating from Zhejiang, excluding those produced outside of this province (samples 1–20). It seemed the fingerprints of crude drugs and cooked medicines were obviously different in areas A and C (see Supplementary Fig. S1). As shown in Fig. 3 for area A, the areas of cooked material peaks at ~20 min (peak a), 25 min (peak b), and 26 min (peak c) obviously exceeded those of raw materials, indicating that the corresponding component contents were also higher. For area C, a small peak at ~43 min (peak d) was observed for raw materials, whereas no peaks were found in the case of cooked materials (except for sample 12). The spectra of cooked materials were markedly different from those of raw materials in the retention time range of 55–70 min, e.g., at times above 65 min, almost no peaks were observed for the former materials, whereas some small peaks were detected for the latter.
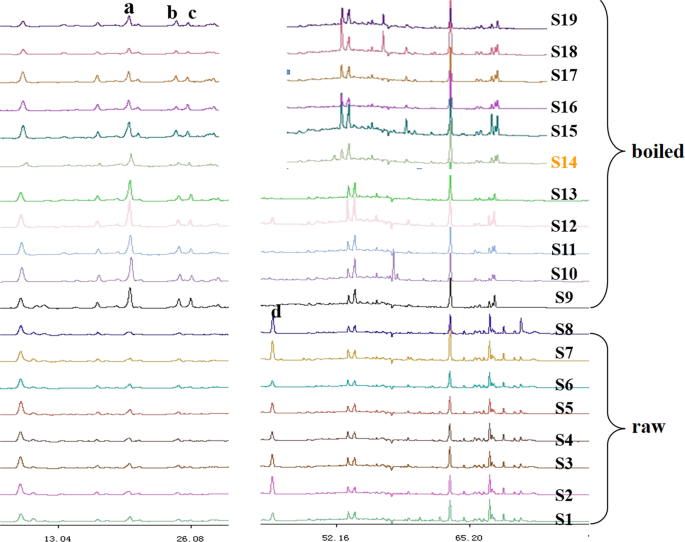
Differences of areas A and C in the fingerprints of C. yanhusuo (raw & boiled).
In addition to the obvious differences between areas A and C, the fingerprint patterns of area B also changed in shape, mainly as follows. Upon going from raw to boiled materials, peak e (~32.01 min) changed from single to double, and the shape of peaks f–h (35–37 min) changed from a decreasing-height ladder to a middle one. Peak i (39.0 min) was similar to peak j (39.8 min) for boiled materials, but the relative heights of these peaks were significantly different for raw materials. The intensity of peak k (40.9 min) exceeded that of peak l (41.7 min) for raw materials, whereas the reverse was true for boiled materials (Fig. 4).
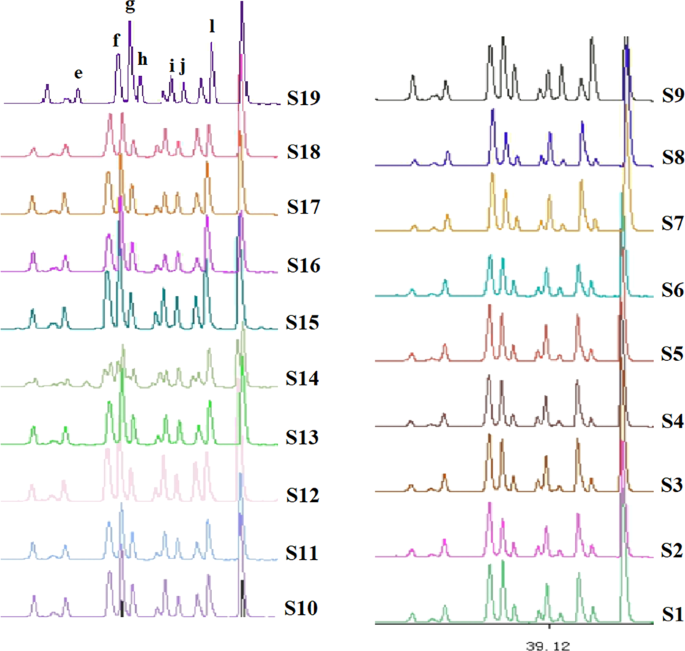
Differences of area B in fingerprints of C. yanhusuo (raw & boiled).
Sample 21, C. yanhusuo produced in Dongyang, Zhejiang Province, and processed by sulfur fumigation, was compared with the boiled material produced in the same location to facilitate comparison. Notably, the former sample was found to contain less constituents than the latter, e.g., peaks a (~20 min), m (~53 min), n (~54 min), and o (~63 min) were absent in the former case (see Supplementary Fig. S2). Therefore, it was speculated that sulfur fumigation may decrease the quality of C. yanhusuo medicinal materials.
Effects of sample origin on HPLC fingerprints
The Panan County of Zhejiang Province is the main area of C. yanhusuo medicinal material production, with the corresponding output accounting for more than 30% of the national market and traditionally featuring excellent quality. Therefore, we systematically investigated the fingerprints of C. yanhusuo produced in Panan, Shanxi, and Jiangsu counties to provide guidelines for the selection of high-quality medicinal materials for the Chinese medicine industry and clinical use. For uniform comparison, unprocessed medicinal materials were used for fingerprint analysis (Fig. 5), which revealed that samples produced in Panan was different from those produced elsewhere. In the case of Shaanxi and Jiangsu samples, peaks in areas A and B were not obvious or absent, whereas a small peak was observed in each of these areas for Panan samples. In area C, no peaks were observed for Panan samples, whereas a minor peak was observed for samples of other origins.
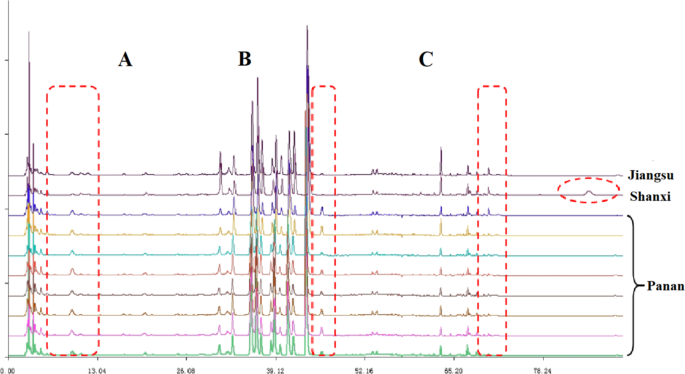
HPLC fingerprints of C. yanhusuo of different geographical origin.
SA of fingerprints of different origins
As the State Food and Drug Administration suggest that all herbal chromatograms should be evaluated in terms of similarity by calculation of the correlation coefficient and/or angle cosine values of the original data28, SA was herein performed to evaluate the similarities and differences between C. yanhusuo samples. As showing in Fig. 3, the chromatographic profiles of the tested samples were generally consistent, although the intensities of some peaks and peak number were subject to some variation. The similarities between the generated reference fingerprint and individual sample fingerprints were calculated as 0.455–0.999 using the similarity evaluation system (can be found as Supplementary Table S1). The similarity values of 21 samples exceeded 0.9, i.e., similar components were present in these samples regardless of geographic location. However, low similarity values of <0.9 observed for samples 14, 16, 20, and 21 suggested that the compositions of these samples might be different from those of samples with high similarity values. Thus, crude herbs and prepared slices were concluded to be significantly different because of the production process and the variable contents of main bioactive constituents. According to Pharmacopoeia of the People’s Republic of China, THP was used as the identification control component. In terms of THP content, S5 was the highest in fresh samples and S17 was the highest in boiled samples. The chemical composition of C. yanhusuo is complex, and its efficacy is not the simple function of one or several effective substances, nor is the higher the content of some components, the better its quality, but depends on the composition and proportion of the whole chemical composition of C. yanhusuo. Therefore, we also need to combine pharmacodynamic research and the correlation analysis of the material basis of secondary metabolites, we can tell which sample was be ‘reference’ of good quality.
Qualitative determination of the HPLC fingerprint of C. yanhusuo by chemometrics
HCA
It is a technique used to sort samples into groups29, has been widely applied to fingerprint analysis, as it permits simple nonparametric data interpretation30 and provides a visual representation of complex data. Herein, a method known as average linkage between groups was applied, and Pearson correlation was selected as a measurement. The applied HCA method classified different herbs by measuring the areas of generic characteristic peaks processed by the similarity evaluation system31.
To assess the resemblance and differences between different C. yanhusuo samples as a whole, hierarchical agglomerative clustering analysis (based on Euclidean distance measurement and shortest-distance clustering, DPS V8.01) of the 23 C. yanhusuo samples was performed based on the relative areas of characteristic peaks. The obtained results (Fig. 6) clearly showed that most Panan samples (except S14 and S8) were clustered together. Shanxi (S22) and Jiangsu (S23) samples were different from others, and S21 (sulfur-fumigated) was classified into a separate group. S14 was considered to have undergone composition changes during boiling. The similarity between S8 and other samples exceeded 0.9, but these two sample groups were still treated as part by cluster analysis, and the exact source and quality of S8 were therefore concluded to deserve further analysis. HCA results were validated against each other and provided further references for the quality evaluation of C. yanhusuo.
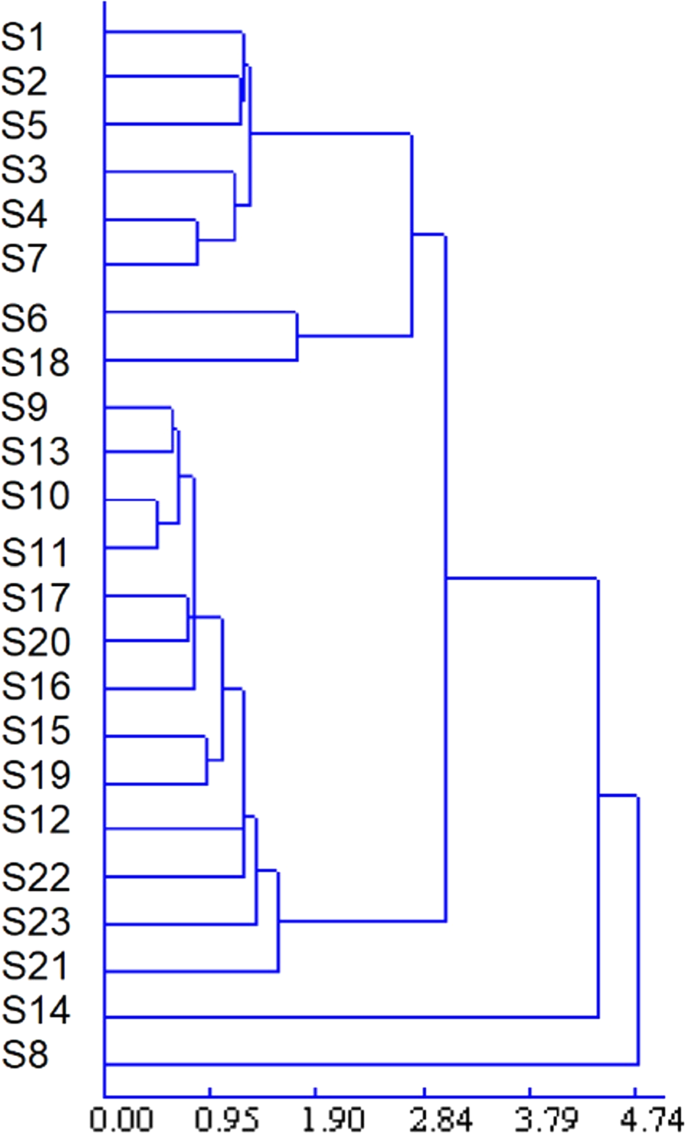
HCA dendrogram for the 23 C. yanhusuo samples.
PCA
Which is an unsupervised multivariate data analysis approach, is applicable when a function of many attributes is believed to be involved in different samples32. Herein, PCA was employed to analyze the relationships between the 23 C. yanhusuo samples of different origin, projecting them to low-dimensional space to observe subtle differences. The resulting score plot is presented in Fig. 7.
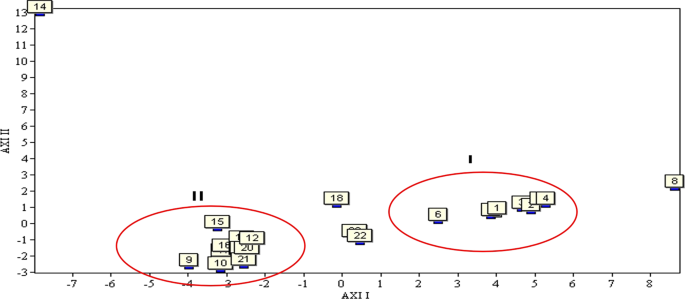
PCA results for the 23 C. yanhusuo samples.
Establishment of a standard HPLC fingerprint of C. yanhusuo from Zhejiang Province
Typical fingerprint selection
By studying the fingerprints of 23 batches of C. yanhusuo and combining their characteristics with other physicochemical identification data, we selected 16 batches (S1–7, S9–13, S15, S17–19) of typical C. yanhusuo samples produced in Panan and constructed their standard fingerprints.
Relative retention time and relative areas of common peaks
After comparison and analysis, 15 common peaks of C. yanhusuo medicinal material were identified (Fig. 8), with peaks 5, 6, 9, 11, and 13 accounting for more than 5% of the total peak area. The total peak area of each batch of chromatographic fingerprints exceeded 90%, in compliance with fingerprinting requirements. The relative retention time of common peaks can be found as Supplementary Table S2.
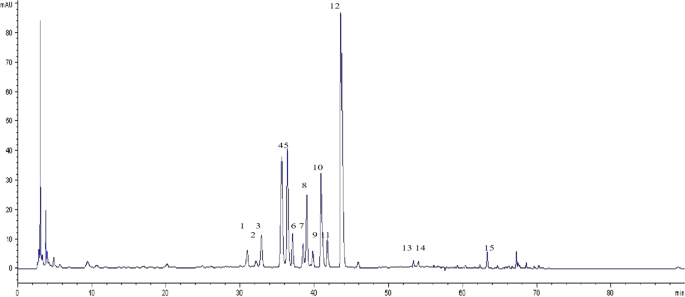
Characteristic peaks of C. yanhusuo fingerprints.
Generation of common patterns
Peaks present in the chromatograms of all samples with reasonable height and good resolutions were denoted as common peaks (in the case of single peaks) or common patterns (in the case of a region containing several peaks). Analysis of a batch of chromatographic fingerprints allowed us to simulate control fingerprint data or control fingerprint generation. That is, to establish a common pattern generation method to synthesize the fingerprint information of all samples33.
For fingerprint standardization, the fingerprints of 16 batches of C. yanhusuo produced in Zhejiang Province were automatically established and matched by using the professional software of ‘Similarity Evaluation System for Chromatographic Fingerprint of Traditional Chinese Medicine’ (v2004 A) (Beijing, China), which was created by the Chinese Pharmacopoeia Committee34. First, the reference spectrum was established, the data were cut, the first 5 min and 80 min parts were removed, and multi-point calibration and automatic matching were carried out. In all 16 batches, 13 distinct common peaks were observed between 5 and 80 min, with relatively high intensity and clear separations from the common mode (see Supplementary Fig. S3). Then, the peak areas and retention time of these 13 common peaks were measured (see Supplementary Table S3). The software automatically calculated and generated the simulated ‘average’ chromatogram (as the representative standard chromatogram of fingerprint) by using the median method34.
Source: Ecology - nature.com
