Total heterotrophic rhizosphere bacterial count
The total counts for the heterotrophic rhizospheric bacteria (THRB) were enumerated at 0, 30, 60 and 90 days of treatments at various concentrations of POS. The result shows that for 1% POS, the THRB counts for contaminated rhizosphere or CR increased significantly (p < 0.05) but slightly from 125 × 107 to 148 × 107 CFU/g, while the count for contaminated non-rhizospheric CN decreased significantly (p < 0.05) from 112 × 107 to 77.3 × 10⁷ CFU/g, the counts for the uncontaminated rhizosphere UR stayed about the same from 243 × 107 to 241 × 107 CFU/g and the counts for the uncontaminated non-rhizosphere UN decreased significantly (p < 0.05) from 202 × 107 to 157 × 107 CFU/g (Fig. 2(a)).
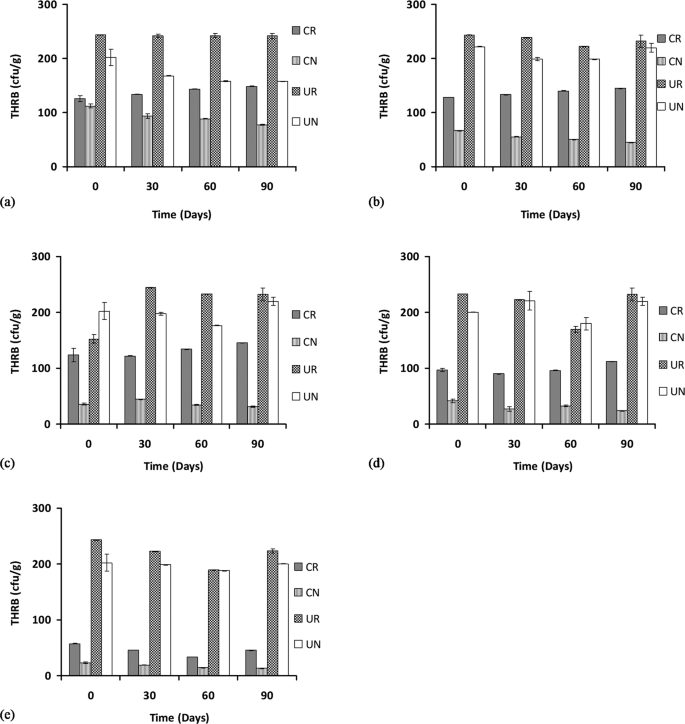
Total heterotrophic rhizospheric bacterial counts at 1, 2, 3, 4, and 5% concentration of petroleum oily sludge labelled (a), (b), (c), (d) and (e), respectively, under various treatments presented as mean ± standard deviation (n = 3). CR: Contaminated rhizosphere, CN: Contaminated non-rhizosphere, UR: Uncontaminated rhizosphere, UN: Uncontaminated non-rhizosphere.
The THRB counts for the 2% POS concentration from 0 to 90 days show a significant (p < 0.05) increase in rhizospheric CR counts from 12.7 × 10⁷ to 144.8 × 10⁷ CFU/g, no significant change (p > 0.05) to the contaminated non-rhizospheric CN count (from 66.3 × 10⁷ to 44.7 × 10⁷ CFU/g), no significant change (p > 0.05) to the uncontaminated rhizospheric UR count (243 × 107 to 232 × 107) CFU/g and also no significant change (p > 0.05) to the uncontaminated non-rhizospheric UN count (from 221 × 107 to 219 × 107) CFU/g (Fig. 2(b)).
The THRB counts for the 3% POS concentration from 0 to 90 days show that the contaminated rhizospheric counts CR were increased but not significant (p > 0.05) (from 123 × 107 to 145.4 × 10⁷ CFU/g), the contaminated non-rhizospheric CN counts were not increased significantly (p > 0.05) (from 35.8 × 10⁷ to 31.3 × 10⁷) CFU/g, the uncontaminated rhizospheric UR counts were increased significantly (p < 0.05) from 152 × 107 to 232 × 107 CFU/g, and the THRB counts in the uncontaminated non-rhizosphere UN were also not increased significantly (p > 0.05) (from 202 × 107 to 219 × 107) CFU/g (Fig. 2(c)).
The THRB counts for the 4% POS concentration from 0 to 90 days shows that the contaminated rhizospheric count CR was not significantly increased (from 96.7 × 10⁷ to 112 × 107 CFU/g), the contaminated non-rhizospheric CN counts were decreased significantly (p < 0.05) (from 41.6 × 10⁷ to 23.7 × 10⁷ CFU/g), the uncontaminated rhizospheric UR counts were not significantly (p > 0.05) increased (from 233 × 107 to 232 × 107 CFU/g) and similarly in the uncontaminated non-rhizospheric UN, the bacterial counts were not significantly (p > 0.05) increased (from 200 × 107 to 219 × 107 CFU/g) (Fig. 2(d)). At the highest POS concentration tested (5%), there were a decreasing trend or no change in overall for the THRB counts. For example, for the contaminated rhizospheric CR counts, a decrease was observed (from 57.7 × 10⁷ to 45.4 × 10⁷ CFU/g), but this decrease was not significant (p > 0.05), in the contaminated non-rhizosphere CN counts, a reduction from 23 × 107 to 13.2 × 10⁷ CFU/g was observed and this reduction was significant (p < 0.05). In the uncontaminated rhizospheric UR bacterial count, a reduction from 243 × 107 to 223 × 107 CFU/g was observed, but similarly, this reduction was not significant (p < 0.05) and finally, in the uncontaminated non-rhizospheric UN counts, there were no significant changes (p > 0.05) observed (from 202 × 107 to 200 × 107 CFU/g) (Fig. 2(e)).
In general, the results show a significant (p < 0.05) increase in the numbers of THRB counts in the uncontaminated rhizosphere (UR) compared to the uncontaminated non-rhizospheric (UN) bacterial counts. Although the microbial community in the rhizosphere is about 10–100 times higher than that of the non-rhizosphere10, the increase in the THRB counts in UR compared to UN as found in this study is marginal. As anticipated, the presence of the contaminant POS significantly reduces the number of THRB counts in both of the contaminated rhizosphere (CR) and non-rhizosphere (CN) treatments over the uncontaminated treatments (UN and UR). The microbial counts were much more pronounced in the uncontaminated soil than the contaminated soil because of the inhibitory effects of POS to the microorganism in general in the contaminated soil. However, there was a significant increase in the number of bacterial populations over time in the rhizosphere treatments (CR), as there were higher bacterial counts after 90 days of treatment compared to that of 30 days while a decrease in THRB counts was generally observed in CN. This shows that the presence of C. cajan favours the growth of THRB bacteria in the soil as found in other studies22,27. The result is also supported by a previous finding28, who reported a total decrease in the number of viable heterotrophic bacteria in soil contaminated with oily sludge.
The hydrocarbon utilizing rhizosphere bacteria (HURB) at 1% POS from 0 to 90 days indicated a significant increase (p < 0.05) in bacterial count in all of the treatments such as in the contaminated rhizosphere CR (from 31.3 × 10⁷ to 131 × 107 CFU/g), in the contaminated non-rhizosphere CN (from 28 × 107 to 54 × 107 CFU/g), uncontaminated rhizosphere UR (from 30 × 107 to 86 × 107 CFU/g) and in the uncontaminated non-rhizosphere UN (from 25 × 107 to 58 × 107 CFU/g) (Fig. 3(a)).
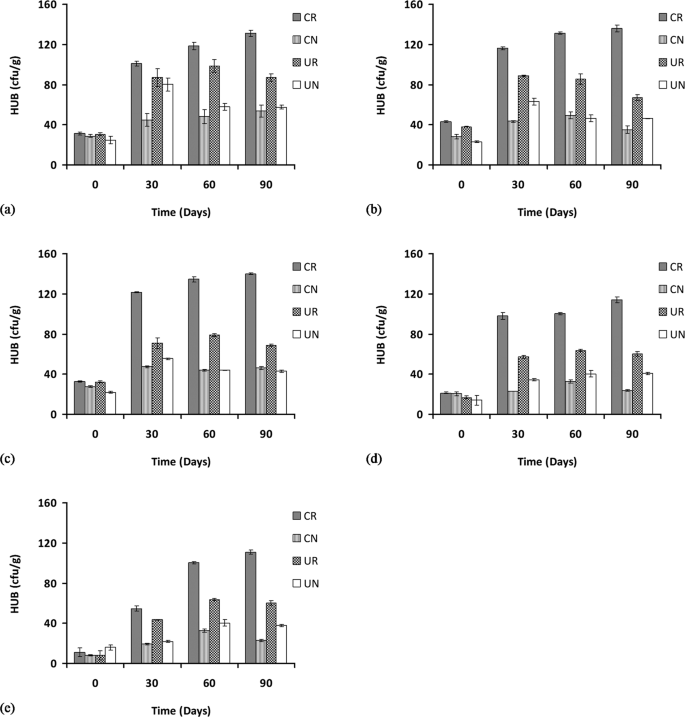
Hydrocarbon-utilizing rhizospheric bacterial counts at 1, 2, 3, 4, and 5% concentration of petroleum oily sludge labelled (a), (b), (c), (d) and (e), respectively, under various treatments presented as mean ± standard deviation (n = 3). CR: Contaminated rhizosphere, CN: Contaminated non-rhizosphere, UR: Uncontaminated rhizosphere, UN: Uncontaminated non-rhizosphere.
In the 2% POS concentration, the HURB counts from 0 to 90 days show a similar increase in counts where the contaminated rhizosphere CR bacterial counts increased significantly (p < 0.05) from 43 × 107 to 136 × 107 CFU/g, no significant increase (p > 0.05) in the contaminated non-rhizosphere CN (from 28 × 107 to 35 × 107 CFU/g), a significant increase (p < 0.05) for the bacterial count in the uncontaminated rhizosphere UR from 38 × 107 to 67 × 107 CFU/g), and a significant increase (p < 0.05) for the bacterial count in the uncontaminated non-rhizosphere UN as well (from 23 × 107 to 46 × 107 CFU/g) (Fig. 3(b)).
Similarly, for the 3% POS concentration, the HURB counts increased significantly (p < 0.05) from 0 to 90 days for all treatments such as in the contaminated rhizosphere CR (from 32 × 107 to 140 × 107 CFU/g), in the contaminated non-rhizosphere CN (from 28 × 107 to 46 × 107 CFU/g), in the uncontaminated rhizosphere UR (from 32 × 107 to 67 × 107 CFU/g) and finally in the uncontaminated non-rhizosphere UN (from 22 × 107 to 43 × 107 CFU/g) (Fig. 3(c)). For the 4% POS concentration, the counts for HURB for CR were significantly increased from 22 × 107 to 115 × 107 CFU/g, while no significant increase (p > 0.05) in the contaminated non-rhizosphere CN was observed from 20 × 107 to 23 × 107 CFU/g. A significant increase was observed for the uncontaminated rhizosphere UR from 17 × 107 to 60 × 107 CFU/g and also for the uncontaminated non-rhizosphere UN from 14 × 107 to 41 × 107 CFU/g (Fig. 3(d)). At the highest concentrations of POS tested (5%) HURB counts increased significantly (p < 0.05) for all treatments. The bacterial counts in the contaminated rhizosphere CR were increased from 11 × 107 to 111 × 107 CFU/g), while the contaminated non-rhizosphere CN counts were increased from 8 × 10⁷ to 22 × 107 CFU/g. In the uncontaminated rhizosphere, the UR counts were increased from 8 × 10⁷ to 60 × 107 CFU/g) and in the uncontaminated non-rhizosphere, the UN counts were increased from 16 × 107 to 38.7 × 10⁷ CFU/g (Fig. 3(e)).
Hydrocarbon-utilizing rhizospheric bacterial counts revealed higher numbers in the contaminated rhizosphere (CR) for all of the POS concentrations tested, although the density tends to decrease as the POS concentration was increased. This result is similar to previous findings29,30,31,32, which include studies on the phytoremediation of soil amended with waste lubricating oil with Jatropha curcaa31 and Hibiscus cannabinus29 where significant increase in hydrocarbon-utilizing bacteria was observed after 30 days of incubation. However, both of these studies require the addition of organic wastes such as brewery spent grain (BSG) and spent mushroom compost (SMC) as additional carbon and nitrogen sources. The results obtained in this work demonstrate the stimulatory effect of rhizosphere to the hydrocarbon-utilizing bacterial population without the need for additional carbon or nitrogen sources.
Considering the complexity of the rhizosphere, a considerable number of microbial communities tend to withstand the toxic effect of the contaminant and are capable of using hydrocarbon as the source of carbon and energy compared to the community in the uncontaminated control. This is similarly reported in a study of epiphytic hydrocarbon-utilizing bacteria where the average number of bacterial density in a given contaminated soil is significantly greater than in the corresponding control, directly indicating that the contaminant is being utilized by the soil bacteria33. The results suggest that microbial enumeration is a direct indicative method to prove the response of microorganisms to hydrocarbons34,35. For a successful and effective phytoremediation process, the bacterial community in the hydrocarbon-contaminated soil must be well connected to the plant’s ability to enhance microbial association in the rhizosphere, resulting in a higher number of hydrocarbon-utilizing bacteria and enhancing their degradative capacity36.
Apart from the presence of petroleum oil which serves as the carbon and energy source, the higher population of hydrocarbon-degrading bacteria in the contaminated soil may also be attributed to the additive effect of the C. cajan roots which release organic compounds to further stimulate the degradation and bacterial growth. The increase in HURB counts in the presence of C. cajans observed in this study are also observed in several similar studies where higher counts of heterotrophic and oil-degrading bacteria were observed in contaminated rhizospheric soil than in the unplanted contaminated soil8,37.
Culture-independent metagenomics analysis
A sum of 59,873 and 59,756 sequences for CN3 and CR3 was found after a sequence optimization method, with an average number of 442.56 and 435.39 sequences for CN3 and CR3, respectively. A sum of 50821 and 47999 reads on CN3 and CR3, respectively, were subsampled from each replicate for further analysis. The calculated bacterial community abundance indices showed an increase in the values for Ace, Cho, Shannon (Shannon-Weaver) and the Simpson’s index in CR3 compared to CN3 (Table 1). In phylogeny, OTU is the most commonly applied microbial diversity unit where OTU is clustered with a cutoff of 97% similarity for the investigation of the abundance of group or species in the microbial community. The difference between CN3 and CR3 was seen in the number of OTU, which were 512 and 650 for CN3 and CR3, respectively, indicating an increase in richness upon the addition of C. cajan. A similar increase in OTU from 48 (control) to 62 (addition of rhizobacteria) is reported during the rhizoremediation of hexachlorobenzene in constructed wetlands38. The coverage indices showed a significant difference in the two treatments. The coverage did not change by much in this study. In general, a reduction in coverage rate indicates higher diversity. In a similar study of rhizoremediation of hexachlorobenzene using T. angustifolia rhizosphere and P. australis rhizosphere in constructed wetlands38, little reduction in the coverage index was observed for T. angustifolia rhizosphere treatment (from 50 to 47.5) while greater reduction in coverage was observed in P. australis rhizosphere soil treatment (from 50 to 29) despite both treatments showing nearly equal efficacy in remediating hexachlorobenzene. This may imply that coverage change alone may not be adequate in describing potential remediating ability of rhizodegraders. Of all the indices used in population diversity studies, the robust Shannon and Simpson indices have been recommended in measuring microbial diversity39, and it was observed that both of the Simpson’s (measured as InvSimpson) and the Shannon values for CR3 were higher than CN3. A change in both indicating an increase in diversity upon the introduction of C. cajan into the contaminated soil, which is a common theme seen in several studies involving phytoremediation using legumes11,38,40. Both measurements of population were lower in CN3, which may be due to the toxic effect of the contaminant on the bacterial community. The shift of soil bacterial community organization is also seen in the metagenomics sequences, and the results showed (Fig. 4a) that the contaminated rhizosphere (CR3) shows a diverse community of bacterial phyla, in comparison to the change of the microbial community structure seen in the contaminated non-rhizosphere (CN3). A lower diversity in CN3 may be the cause of a lower removal rate of petroleum hydrocarbon which has similarly been reported in previous studies40,41 where with an increase in the concentration of the contaminant, this results in an increase in the toxicity which reduces the efficiency of microbial degradation. This shows the important role of plant-like C. cajan, which stabilizes the C:N:P ratio for the effective degradation of hydrocarbon by the microbial community22. On the other hand, some study reported the inability of plant growth-promoting rhizobacteria to acquire nutrient for growth in severely polluted environments41.
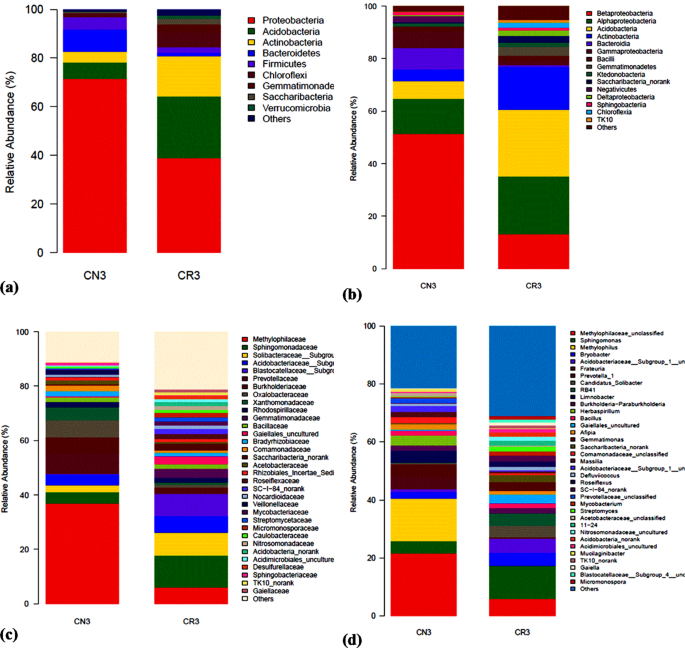
The relative abundance of bacterial taxa at the phylum (a), class (b), family (c) and genus (d) levels without (CN3) and with (CR3) C. cajan in soils contaminated with 3% petroleum oily sludge.
The composition and taxonomic analysis of microbiota amplified sequences were categorized into eight phyla (CN3) and ten phyla in (CR3). The overall bacterial composition of the two treatments varied, as the distribution shows a similar variation between the two treatments in the phylum, class, family and genus level distributions, represented by Fig. 4a to d, respectively. This variation in microbial community is also shown by the PCoA plot, which revealed community-level differences between the contaminated non-rhizosphere control (CN3) and contaminated rhizosphere (CR3) microbiota (Fig. 5).
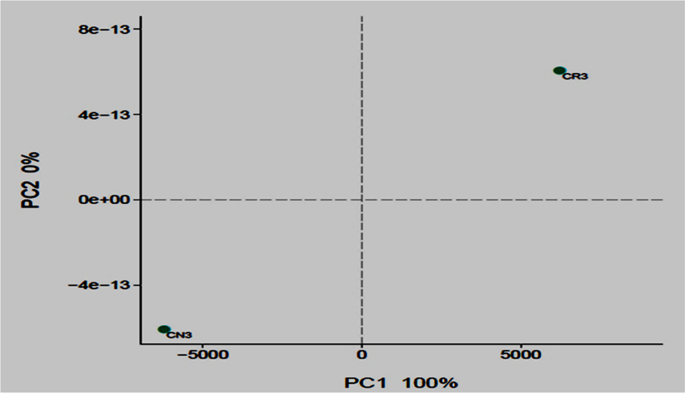
Bacterial 16 s rRNA community comparison of the different treatments analyzed using principle coordination analysis (PCoA). The proportions of variation by each ordination axis are indicated as percentages in parentheses. CN3 (contaminated non-rhizosphere), CR3 (contaminated rhizosphere).
The contaminated non-rhizosphere (CN3) shows a trend of bacterial phylum such as Proteobacteria, Actinobacteria, Acidobacteria, Bacteroidetes, Firmicutes, Chloroflexi, Saccharibacteria and some uncategorized group. The contaminated rhizosphere (CR3) shows Actinobacteria, Proteobacteria, Bacteroidetes, Acidobacteria, Firmicutes, Gemmatimonadetes, Saccharibacteria, Chloroflexi and Verrucomicrobia to be the dominant phyla, and an unclassified group. In both of the treatments, the phylum Proteobacteria constitute the phylum with higher relative abundance accounting for > 60% in CN3 and almost 42% in CR3. In general, the phylum Proteobacteria dominated the communities of CN3 and CR3 at 70% and 42%, respectively. In the CN3, the Proteobacteria was dominated by the genus Rhizobium, Sphingomonas, and Herbaspirillum. The two phyla were not observed in CN3, but the phyla observed were Verrucomicrobia and Gemmatimonadetes. The presence of Verrucomicrobia is an indicator to the rhizospheric effect created by the presence of C. cajan as bacteria from this phylum are mostly found inhabiting grasslands and in subsurface soil horizons, where they were habitually the prevailing bacterial phylum42. Similarly, Gemmatimonadetes tend to dominant in soil with high rhizosphere activities, although their ecology remains poorly understood, and appear to be the dominant phyla in many soil bacterial communities; with bacteria from the phylum Gemmatimonadetes featuring nearly 2% of soil bacterial communities. Nevertheless, very little is understood of their ecology as a result of an insufficient study on the occurrence and ecology of this bacterial group43. The degradation of petroleum oily sludge hydrocarbons, in general, is accredited to indigenous microorganisms which are found in soil, but the presence of C. cajan will stimulate the habitat for the formation of favourable conditions of metabolisms to the microbial communities as demonstrated in this study where the culture-independent metagenomics technique to access a much more in-depth knowledge of the biological processes of petroleum oily sludge degradation during rhizodegradation shows promising results that agrees in principal to what was observed in the experiments.
An assessment at the phylum level identifies the bacteria belonging to the Proteobacteria as the richest community, and the richness was significantly increased. Proteobacteria covers a group of Gram-negative bacteria that have been widely reported to be able to degrade POS41.
Biodegradation of petroleum oily sludge in soil
Gravimetric analysis
The result of oily sludge degradation in the soil shows the effectiveness of C. cajan in plant-microbe bioremediation process. The result of the gravimetric analysis shows that almost 50% biodegradation of the oily sludge was observed at lower concentrations of oily sludge (CR1%, CR2% and CR3%) after 30 days of planting C. cajan (Fig. 6).
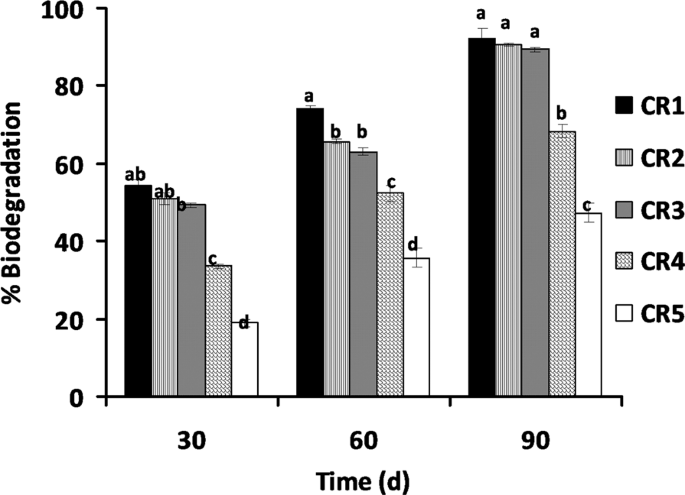
Percentage biodegradation of petroleum oily sludge contaminated soils by C. cajan under different treatments bars (means + SD, n = 3) with different letters within treatment days are significantly different based on LSD (p < 0.05) CR1 to CR5: Contaminated rhizosphere 1 to 5% oil sludge, respectively.
A low percentage of biodegradation (19%) was observed at the highest concentration of oily sludge tested (CR5%) after 30 days of planting with C. cajan. This may be as a result of inhibition at high concentrations of POS. The biodegradation shows significant (p < 0.05) increase after 60 days of planting of C. cajan for all oily sludge concentrations with CR1%, CR2%, CR3% and CR4% showing 74, 65, 63 and 52% biodegradation of POS, respectively, while CR5% was at 37% which also shows a significant increase albeit at a much lower percentage of degradation. A significant (p < 0.05) increase in biodegradation of POS was shown at the 90 days of the planting of C. cajan where CR1%, CR2%, CR3% and CR4% show 92, 90, 89 and 68% degradation, respectively. Likewise, CR5% had the lowest biodegradation at 47%. This result corresponds to the pattern of many studies observed in different plants, and the biodegradation also varies. In a previous study31, they reported that the phytoremediation of soil contaminated with 2.5 and 1% of spent engine oil using J. curcas at day 180 results in the 56.6% and 67.3% biodegradation of waste lubricating oil, respectively. Once the addition of organic waste to J. curcas was carried out, the remediation rapidly increases the removal of 2.5 and 1% spent engine oil by 89.6 and 96.6%, respectively. The variation is that the plant was stimulated with organic waste to achieve 96% biodegradation at 1% spent engine oil concentration whereas in this study, C. cajan being a legume plant, the addition of organic source is not necessary making C. cajan a better phytoremediating plant. Another study in the plant Hibiscus cannabinus for soil contaminated with 2.5 and 1% used lubricating oil for 90 days show the same pattern of biodegradation where the stimulation of the plant with organic waste resulted in the biodegradation of 86.4 and 91.8%, respectively, while in the unstimulated plant much lower biodegradations were observed at 52.5 and 58.9%, respectively, indicating the need for the addition of organic waste in non-nitrogen fixing plants29. Legumes have been shown to independently stimulate biodegradation of various forms of hydrocarbons including poly-aromatic hydrocarbons (PAHs) and their constituents44. In all of the phytoremediation studies, legumes are more effective at remediation than other non-legume plant species tested15,17,20,44,45,46,47,48,49,50. In some studies, the biodegradation of legume was reported to be lower at the beginning of the experiment but significantly increases as the experiments progresses44.
Source: Ecology - nature.com
