Mean dynamic topography (MDT) delineates phytoplankton regional variation
MDT divides the North Atlantic into four regions: subpolar, temperate, subtropical, and Gulf Stream/Sargasso Sea (Fig. 1a) (ref. [23]). Two meridional transects covered these four subregions capturing the initiation of winter deep mixing and the peak of the bloom following the water column re-stratification (Fig. S1).
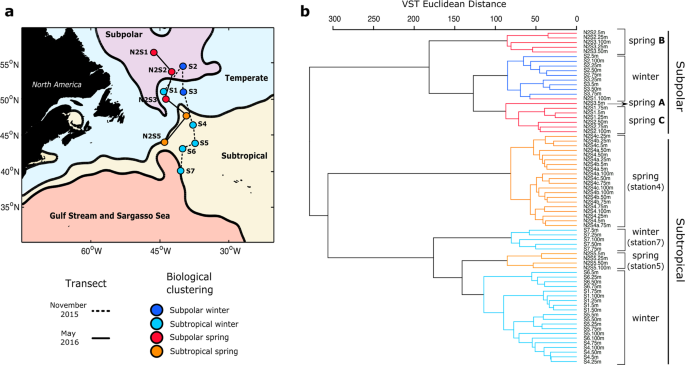
a Map of the western North Atlantic showing the subregions established by the mean dynamic topography analysis. Stations are indicated as circles. Those joined by a solid line were sampled in November 2015 (winter) and by a dashed line in the following spring (May 2016). Stations are color coded by the categorical sample assignments determined in the ASVs hierarchical clustering analysis as shown in (b): Subpolar winter, Subpolar spring, Subtropical winter, and Subtropical spring. b ASVs dendogram defined by hierarchical clustering of samples collected from the upper 100 m water column in winter and spring. Branches of the dendogram colored in navy blue and light blue represent samples collected in early winter from the Subpolar and Subtropical regions of the study area, respectively. Branches colored in red and cyan represent samples collected in the spring from the Subpolar and Subtropical regions, respectively. Within the subpolar category, three spring groups were defined. Spring ‘A’ represents the surface of the most southern subpolar station. Spring ‘B’ represents samples below the MLD at station 3 and above at station 2. Spring ‘C’ represents samples below the MLD at station 2 and above at station 1 (expanded in Fig. 2b).
Genetic profiles were retrieved from the upper 100 m at each station. Normalized ASV counts were used to establish a comparable unit of measurement and calculate a standardized Euclidean distance matrix. Distances representing the similarity between samples were grouped using a hierarchical clustering approach. In hierarchical clustering of phytoplankton ASV frequencies, samples from the same region grouped more closely than samples from the same season (Fig. 1b), indicating that properties associated with water masses strongly influence community composition. Hierarchical clustering did not discriminate subpolar and temperate regions (Fig. 1b), so hereafter profiles from these stations are considered as a single subpolar region. Likewise, Gulf Stream/Sargasso Sea clustered with and was combined with the subtropical region and generally exhibited an ASV profile distinct from the subpolar. The major division observed was between the subpolar and subtropical. Temperature and salinity (T–S) in near-surface water varied between MDT subregions, but were indistinguishable within the subpolar and subtropical (Fig. S2). An anomalous phytoplankton community that did not fit this pattern, winter station 1 (43° W, 51° N), was physically located in the temperate subregion, but its ASV profile clustered with the subtropical stations. Satellite altimetry and sea surface temperature showed that this station was in an anticyclonic eddy that originated in the subtropics (Fig. S3). T–S confirmed that winter station 1 conditions were similar to those of the subtropics (Fig. S2). These findings illustrate the dynamism of North Atlantic hydrography and the importance of transport as a factor contributing to phytoplankton community structure.
Statistical ordination of physico-chemical water properties clustered the stations similarly to the community-based ASV hierarchical clustering, a further indication that phytoplankton community structure is shaped by habitat variables (Figs. S4, S5, S6, S7). In winter, salinity, temperature and the ratio of silicate to total-dissolved-nitrogen (Si:DIN) generally increased from north to south, with the exception of station 1 of subtropical origin, whose physico-chemical properties aligned with station 4 (Fig. S4). In spring, discrete high nutrient availability, low temperature, and salinity distinguished subpolar stations (Fig. S4). As expected, these nutrient differences were reflected not only in shifts in ASV-based community composition, but also in overall surface chlorophyll concentrations (Fig. S5). These shifted from low chlorophyll (0.2–0.5 mg/m3) in winter, except station 3 (1.1 mg/m3), to higher levels in spring (0.4–3.5 mg/m3). Values at subtropical stations were lower and shifted less over the seasonal transition, ranging from 0.4 to 1.7 mg/m3. The maximum values observed were in spring in the subpolar region (2.7–3.5 mg/m3).
The above findings suggest that, in the western North Atlantic, the differences in abiotic factors that delimit regions also create dynamic ecological borders for phytoplankton. This physico-chemical structuring of communities is referred to as “environmental filtering” [48] and it implies that the distribution of specific communities can be predicted from an extensive description of the environment. Alternate perspectives, considered further below, place more weight on biological factors in shaping communities.
Seasonal water column dynamics shape phytoplankton communities within the regional variation
To analyze the seasonal effect within the defined subpolar and subtropical regions, we compared phytoplankton community composition between winter and spring samples using phylogenetic methods that assign ASVs to taxonomic categories [30, 31]. Cyanobacteria and pico-phytoeukaryotes numerically dominated the ASVs in the western North Atlantic during winter (Fig. 2a). In the subpolar region, Cyanobacteria in Synechococcus clades I and IV represented >50% of the ASVs, while the eukaryotic pico-prasinophyte genera Bathycoccus and Micromonas were also notable (>10%).
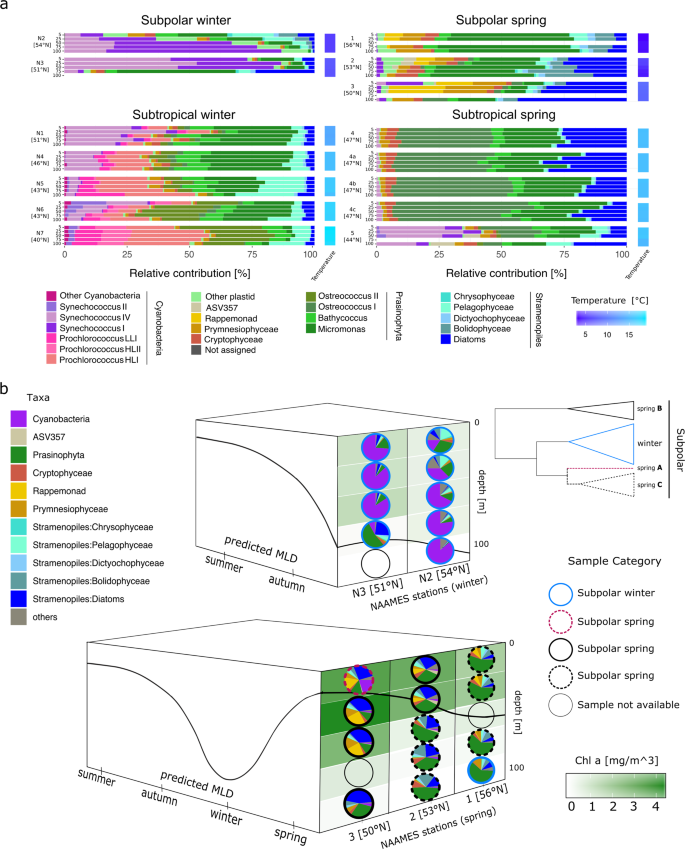
a Relative contributions of phytoplankton taxa for depth profiles at each station. Water column is represented by bars indicating five sampling depths (5, 25, 50, 75 and 100 m) and arranged from surface to deep samples. Stations are organized by the categories defined in the ASVs hierarchical clustering (Fig. 1b). Station 4 in the spring was occupied 4 days, capturing a rapid water column re-stratification event. These profiles are labeled as 4 (May 24), 4a (May 25), 4b (May 26) and 4c (May 27 2016). Water column temperature gradient is depicted as a heat map on the right side of each station bar plots. (b) Diagram depicting the spatio-temporal shifts in the subpolar region phytoplankton community composition, derived from phylogenetic taxonomic assignments. Top: vertical structure of community composition in November 2015, bottom: vertical structure of community composition in May 2016. Height of each box represents depth (0–100 m) and the solid black line represents the MLD. Left side of each box depicts the predicted annual dynamics of the mixed layer. Right side represents MLD (black line) and latitude, most southern in the front and most northern in the back. Vertical distributions of chlorophyll a concentration are represented by the background shades of green. Circle periphery of the pies identifies each sample to any of the defined subgroups from the ASVs hierarchical clustering analysis: winter, spring ‘A’, spring ‘B’ and spring ‘C’. A simplified representation of the ASVs clustering dendogram (subpolar section, Fig. 1b) is shown on the top-right corner.
In the subtropical winter samples, most Cyanobacteria were in the clades Synechococcus IV, Prochlorococcus high light I and II, and low light I. Prochlorococcus relative amplicon contributions increased with decreasing latitude alongside decreases in Synechococcus clades IV and II at the southernmost subtropical stations (stations 5–7). Among eukaryotic phytoplankton, Bathycoccus and Micromonas were again notable (being >30%), with smaller contributions from stramenopile, cryptophyte, and prymnesiophyte algae. Surprisingly, the recently recognized pico-prasinophyte species Ostreococcus Clade OII was also prominent [49], especially moving southwards. A similar apparent jump in OII contribution has been observed at the border of the Kuroshio Current and the Subtropical North Pacific Gyre [50]. An additional surprise was that stramenopiles formed a relatively small part of the phytoplankton community at both subpolar and subtropical winter stations. Moreover, among stramenopiles, the relative amplicon contribution of pelagophytes was higher than that of diatoms, although the latter are typically considered important in high latitude bloom scenarios. Taken together, these observations indicate that pico-size phytoplankton dominated winter conditions. Distinctive communities matched the defined subregions and showed smooth latitudinal taxonomic transitions within them. However, strong dynamic mesoscale features such as those found at station 1 can disrupt these ecological boundaries.
Spring in both regions was characterized by a major reduction of Cyanobacteria and a shift to eukaryote-dominated communities with differences in taxonomic composition from the winter period (Fig. 2a). At subpolar spring stations, the relative contribution of pico-phytoeukaryotes, largely Micromonas, a genus which has been shown to be increasing in the Arctic in association with climate-change [51], decreased from 60% of amplicons to <15%, in a north-to-south trend. Relative contribution of diatoms, prymnesiophytes, rappemonads, [52] and cryptophytes, increased from north to south. We observed considerable variability between the communities at the two subtropical spring stations. Station 4 was consistently dominated by pico-phytoeukaryotes, of which Ostreococcus Clade OI had the highest relative contribution, but other pico-prasinophytes were also numerous. Eukaryotic phytoplankton were similar at stations 4 and 5, but there was a higher relative contribution of Synechococcus (>30%) at station 4, largely clade IV. Thus, in the transition from winter to spring in the western North Atlantic, communities shifted unexpectedly from being dominated by pico-phytoplankton to a diverse assemblage of eukaryotic phytoplankton.
NAAMES cruise tracks were latitudinally oriented and thus captured the seasonal progression of blooms in a time span of days, which otherwise would take weeks for a ship stationed at constant latitude (Fig. 2b). Ordination of community composition revealed dramatic shifts between winter and spring across subregions (Fig. S8). Because of a homogeneously mixed water column, winter ASV depth profiles clustered tightly by station, and followed a latitudinal gradient of dissimilarity. Among spring samples, latitudinal shifts in phytoplankton community structure were evident, but the gradient was uneven. Specifically, subpolar phytoplankton communities were not strictly clustered by station. Instead, they followed a pattern in which communities below the MLD clustered preferentially with those above the MLD of the nearest northern station, suggesting that progressing stratification and associated environmental parameters overtake the influence of surface parameters, as observed in other marine environments [53, 54].
Some phytoplankton benefit from disturbance and recovery dynamics
Within the spatio-temporal phytoplankton community variation, we investigated how ASVs were distributed across regions and seasons (Fig. S9). We identified ASVs enriched in spring and classified them as winter-detected if they were present in both seasons, or winter–undetected if they were absent in winter datasets (Fig. S10 and Table S2). Winter-detected ASVs may represent taxa that benefit from the disturbance and recovery effect [19], growing in winter and contributing to the bloom climax. In the subpolar region, 52 ASVs (21.9% of the total in the region) were significantly abundant in spring (p < 0.01) relative to winter. Of these, the 27 (52%) winter-detected variants were composed mostly of diatoms and prasinophytes. (Fig. S10). Interestingly, three of the most represented ASVs in subpolar spring, Chaetoceros (ASV134) and the rappemonad variants (ASV193 and ASV195), did not have a winter representative and were categorized as winter-undetected. In the subtropical region, 57 ASVs (15.7% of the total in the region) were significantly abundant in spring (p < 0.01). Of these, 27 (47.3%) were detected in winter; these were composed mostly of diatoms, prasinophytes, and chryptophytes. Among the diverse winter-detected organisms common in both regions were Pheocystis, Teleaulax, Minutocellus, Thalassiosira, Micromonas E2, and Ostreococcus Clade OI. Nondetection in the winter of approximately half of the ASVs that were significantly enriched in spring suggests either high differential success for these taxa in the winter-to-spring transition, or transport with water masses.
Pico- and nano-phytoeukaryotes contribute the most to biomass
Perhaps the most surprising observation from the NAAMES campaigns is the unexpectedly low abundance of large phytoplankton cells (micro-phytoplankton; >20 µm) in the spring, including stations where phytoplankton biomass was high. Multiple lines of evidence support this observation. In addition to the numerical predominance of known pico- and nano-phytoeukaryotic taxa in genetic profiling analyses, FCM and IFCB show that the dominance is not only in abundance but also in terms of contribution to total bio-volume (the contribution of phytoplankton to biomass as a function of cell size) (Fig. 3). FCM cell counts in surface samples confirmed high abundances of Cyanobacteria and pico-phytoeukaryotes in the subpolar winter (Fig. 3a). Moreover, the FCM data clearly aligned with Prochlorococcus and Synechococcus ASV frequencies across the regions in both seasons. At subtropical spring station 4, FCM revealed that pico- and nano-phytoeukaryotes were the dominant blooming populations responding to rapid water column re-stratification over the 4-day occupation of this station [41].
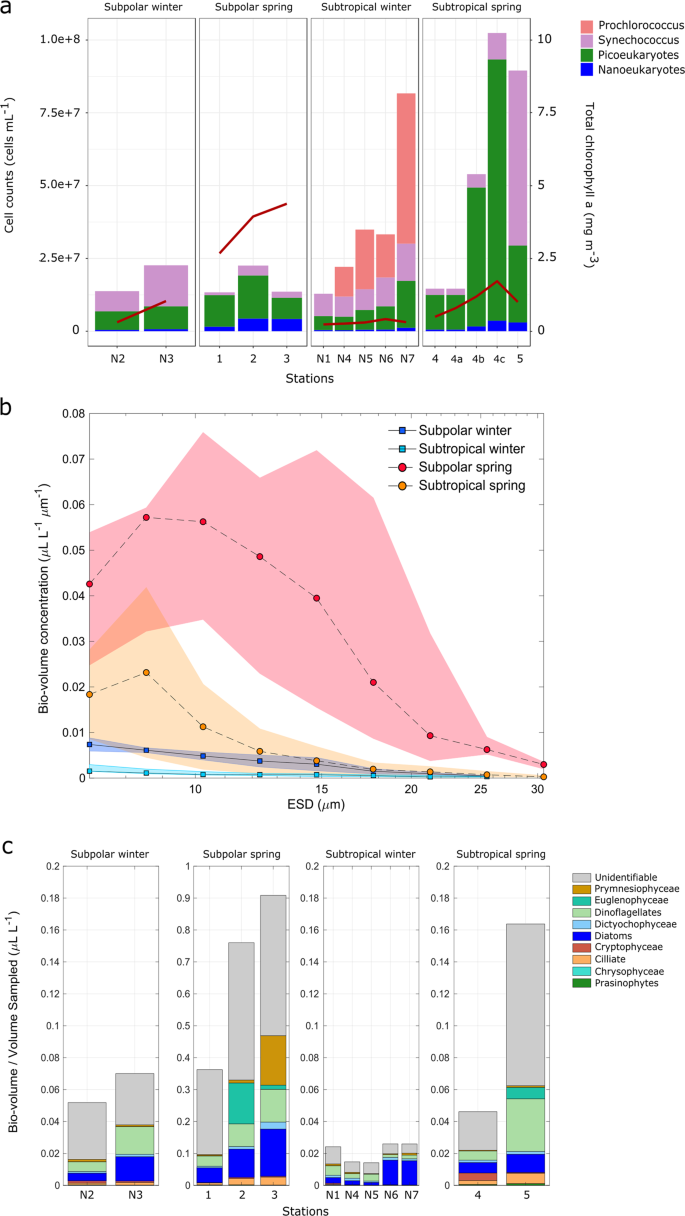
a Flow cytometry cell counts of surface samples. Each bar plot represents the stacked number of cells (right y-axis) for the different taxonomic categories analyzed. Bar plots are organized in four panels grouped by the defined categories. Total chlorophyll a concentrations are shown as an overlapped red line (left y-axis). (b) Total bio-volume distributions of chlorophyll containing taxa collected at the surface (ship intake) and derived from the IFCB images (fraction of cells >8-µm diameter) at each station for both campaigns. Data points and lines indicate the bio-volume average for each category. c Total cell bio-volumes derived from IFCB images (fraction of cells >8 µm diameter). Colors represent the volume contributions of major taxonomic groups. Cells that could not be identified are grouped under the ‘unidentifiable’ category. It should be noted that size fractions differ between the data sources depicted. The FCM data typically represent only cells <40 µm, IFCB captures taxa between 8 and 100 µm, while total chlorophyll a measurements were performed on whole water samples and therefore represent whole community biomass.
Across the NAAMES transect, spring high biomass communities were composed mainly of cells in the pico and nano-size phytoplankton (Figs. 3b, S11 and S12). Bio-volume distributions in surface samples (ship-intake depth) were constructed from curated IFCB data (Figs. 3b and S12). Individual bio-volume distributions by size (Fig. S12) suggested that elevated abundances of nano and lower-end micro size cells (ca. 10–30 µm) likely explain the higher chlorophyll values observed at subpolar stations, relative to pico-phytoplankton cell counts measured by flow cytometry. At the two northern stations, cells of ca. 10-µm diameter were the dominant size class contributing to bio-volume per liter. This trend shifted at the most southern subpolar station 3 to slightly larger cells, where the bio-volume dominant fraction was around 15-µm diameter. At subtropical stations (4 and 5), bio-volumes followed a unimodal distribution, peaking near the 8-μm lower quantitative threshold for IFCB. Averaged bio-volumes by subregion and season (Fig. 3b) showed increased phytoplankton bio-volumes in spring in both regions, as expected. The magnitude of the increase was drastically higher in the subpolar region. Bio-volumes in winter and the subtropical spring were below 0.17 µL/L, while the subpolar spring stations showed a north-to-south increase ranging from ~0.37 µL/L (station 1) to 0.9 µL/L (station 3).
The taxonomic contributions of nano and micro (>8 µm) phytoplankton to the measured bio-volumes were derived from the morphological characterization of IFCB high-throughput image data (Fig. 3c). Within this size-fraction, diatoms and dinoflagellates composed the major bio-volume fraction through regions and seasons. In the high biomass subpolar spring, diatoms and dinoflagellates increased with decreasing latitude. In addition to this trend, some taxa emerged as high contributors at specific stations, such as euglenophytes at station 2 and prymnesiophytes at station 3. ASVs for the major diatom taxa present, Chaetoceros and Minutocellus, the prymnesiophyte Phaeocystis, and other two variants (ASV193 and ASV195) annotated as rappemonads, which are thought to be in the 3–10 µm size range, followed a similar trend of increasing from north to south in the subpolar spring. The co-occurrence of well-known blooming Chaetoceros and colony forming Phaeocystis (detected by ASVs and IFCB), along with nano-size taxa, such as Minutocellus (detected by ASVs), and pico-phytoeukaryotes (detected by FCM and ASVs), in the highest chlorophyll samples of the subpolar spring, suggests that assumptions of large diatom dominance during the bloom in the western North Atlantic may arise either from the use of methods that do not capture or identify smaller eukaryotic phytoplankton cell types or from historical sampling biases favoring the eastern North Atlantic.
Source: Ecology - nature.com
