Genomic similarity within bacterial populations is spatially organized across a meadow
Starting with an undereplicated but quality filtered dataset of 3215 draft quality genomes assembled from samples collected from across the meadow [29], we calculated all pairwise genome-wide average nucleotide identities (ANI) and alignment coverages (roughly analogous to shared gene content; Fig. 1b). We observed a sharp decrease in pairwise ANI for all of the genomes from the meadow around 96.5–97%, similar to the threshold for bacterial species delineation reported recently [53]. There was a more gradual decline in shared gene content. We used the 97% ANI cutoff to cluster genomes into groups of species-like populations and found that some species-like groups contained dozens of near-complete draft genomes, each assembled from a different sample independently. To focus on the populations that were most abundant in the metagenomic data, we selected species clusters with at least 12 genomes estimated to be >80% complete with <10% contamination for population genetics analysis, which resulted in a final set of 467 genomes from 19 widespread species populations (312 genomes are estimated to be >90% complete; Supplementary Table S1). The bacterial species in this set included many commonly reported highly abundant soil bacteria from phyla including Chloroflexi, Acidobacteria, Verrucomicrobia, and Candidatus Rokubacteria, which are known to be abundant globally in soils [1, 6], but remain understudied. Most of the species in this set were likely novel at the taxonomic rank of class, and one likely represents a novel candidate phylum tentatively designated Candidatus ANGP1 (Diamond et al. 2019). Based on measurement of the relative DNA abundance of each population across the entire meadow, these bacteria are some of the most abundant species in the soil, although no individual species contributed >1% of the DNA in a sample (Fig. 1c).
For each of the 19 meadow-wide populations, we tested to see if the meadow plot of origin predicted genetic similarity of the assembled genomes (PERMANOVA; FDR ≤5 %; adjusted p ≤ 0.05). Further, we tested if genomes obtained from the same soil depth were more similar than those collected from different depths. We found that the genetic variation of genomes from 12 of the 19 populations were significantly associated with sampling plot, and that genetic variation within 5 of the 19 populations were significantly associated with sampling depth (Fig. 2a). MDS of the nucleotide identity matrices of genomes from each population shows clear associations with both plot of origin and depth (Fig. 2b). Because the genome assembly from each sample reflects the most abundant sequence variant in each population, this implies that major allele frequencies varied across the meadow for a majority of the populations. While local spatial heterogeneity has been shown to highly explain microbial community composition in soils [54], here we demonstrate that there are also spatial patterns within the genetic variation of some individual species.
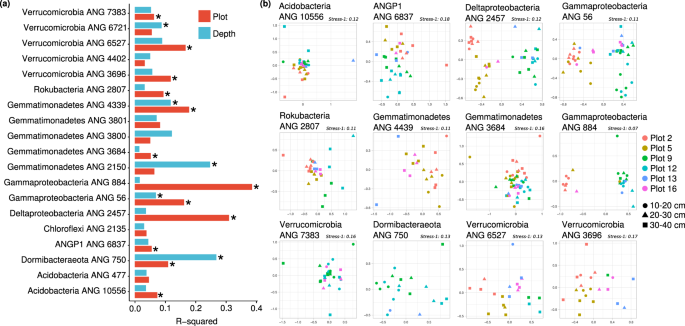
a The percentage of variation in genetic similarity (ANI) of consensus genomes explained by plot of origin (red) and sampling depth (blue). b Multidimensional scaling ordinations of genetic dissimilarities between genomes within each species, for all 12 populations for which sampling plot explained a significant fraction of the variation in genetic dissimilarity (PERMANOVA; FDR = 5%; p < 0.05). The first two axes are plotted, there is a single point for each genome independently assembled for a population, and genomes are colored by sample plot of origin and the point shape indicates the sample depth.
Population nucleotide diversity is high meadow-wide and within soil samples
To assess the genetic variability within each population across the meadow, we calculated the per-site nucleotide diversity of the sequencing reads at each locus for that population. Metagenomic studies have sometimes used either the average similarity of reads to a reference or the total number of SNPs/Mbp as metrics of genetic diversity [26, 55]. We chose to measure nucleotide diversity, also previously measured by [56], because [1] it is less sensitive to large changes in coverage (Figs. S1 and S2) [2], it can be calculated both for a single site and averaged over genes or windows, and [3] it considers not only the number of SNPs but also their frequencies in the population. We found a wide range of per-gene nucleotide diversity values for the 19 different populations (Fig. 3a). Because nucleotide diversity is less sensitive to changes in coverage, we could use it to track how nucleotide diversity changes between the plots spread across the meadow. We calculated nucleotide diversity in pooled mapped reads for each population sampled from the same location and soil depth, within plot, within block (pairs of plots), and across the entire meadow for each species (Fig. 3a). Although nucleotide diversity tends to be higher at the meadow scale compared with the sample scale, the nucleotide diversity within some samples was comparable to that across the entire meadow for many populations, indicating that in some cases high nucleotide diversity persists within soils even at the centimeter scale.
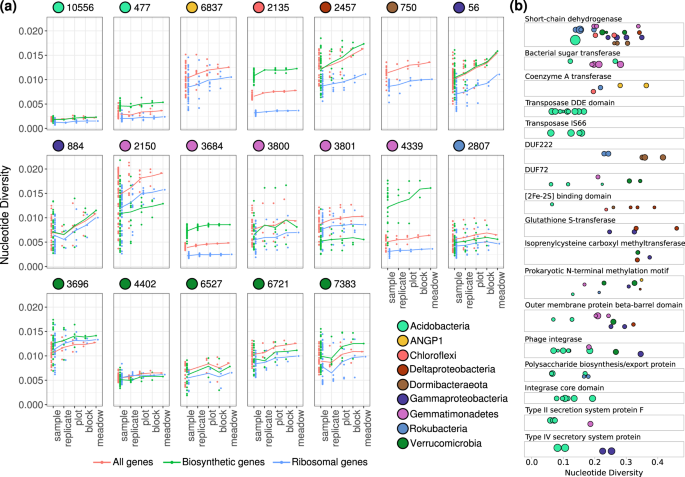
a Distributions of average per-gene nucleotide diversity for each population, measured across increasing scales of sampling. Separated by all genes (red), ribosomal genes (blue), and biosynthetic genes (green) for species that have them (all except species Candidatus ANGP1 6837 and Dormibacteraeota ANG 750). Lines connect the means of each distribution of points across scales. b Nucleotide diversities of genes from protein families that were found to be enriched among genetically diverse genes compared with the average genomic frequencies. Each gene is a point arranged by protein family from the PFAM database, and point size scales with the gene’s length.
In almost all populations, the ribosomal genes consistently had lower nucleotide diversity than the average genes in the genome, consistent with these genes being strongly conserved and under higher purifying selection [57] (Fig. 3a). Biosynthetic genes involved in the production of small molecules, annotated with antiSMASH [43], were found to have significantly higher nucleotide diversity than the genomic average in Chloroflexi and one Acidobacteria species, while having significantly lower nucleotide diversity in one Gemmatimonadetes species (Welch two-sample t test; q < 0.05)(Fig. 3a). Examining all genetically diverse genes with nucleotide diversities greater than 2.5 standard deviations above the mean within each population, we find that protein families for biosynthesis of small molecules and extracellular secretion were significantly over-enriched compared with the genomic averages (hypergeometric test; p < 0.05) (Fig. 3b). Short chain dehydrogenase enzymes and outer membrane beta-barrel domains were significantly enriched among highly diverse genes across several taxa, whereas multiple transposon families were diversifying within Acidobacteria genomes. Across the Acidobacteria, Gammaproteobacteria, and Gemmatimonadetes species studied, secretion system proteins were also diversifying. These genes involved in biosynthesis and secretion may likely have experienced local selective pressures for diversification across soil microbial species.
Homologous recombination is common, but populations exist far from panmictic equilibria
Measuring the impact of homologous recombination on the observed genetic diversity in a population can be accomplished with metagenomic data by measuring linkage disequilibrium of SNPs spanned by paired reads [16, 17]. When recombination occurs within a population, the chance for a recombination event to occur between two sites on the genome increases with the distance between them, resulting in a characteristic signal known as linkage decay. Given ~200 bp reads and intra-read pair distances with a median of 383 bp and a 95th percentile of 500 bp, we could reliably assess genomic linkage of SNPs from 772 bp (median) to 846 bp (95th percentile) bp apart in each population. Consistent with the expectation that natural bacterial populations can undergo extensive homologous recombination, we observed the r2 metric of linkage disequilibrium decay as the genomic distance between two polymorphisms increased (Fig. 4a; Fig. S3). Using the mcorr package, we could estimate the neutral rate of recombination relative to mutation on synonymous third position codon sites for 10 out of 19 populations. While the estimated confidence intervals for these relative rates were large and varied between species, they were well within the ranges reported in the literature [16] for many known highly recombinogenic species, but generally were below the rate reported for a S. flavogriseus population considered to be approaching panmixia [20].
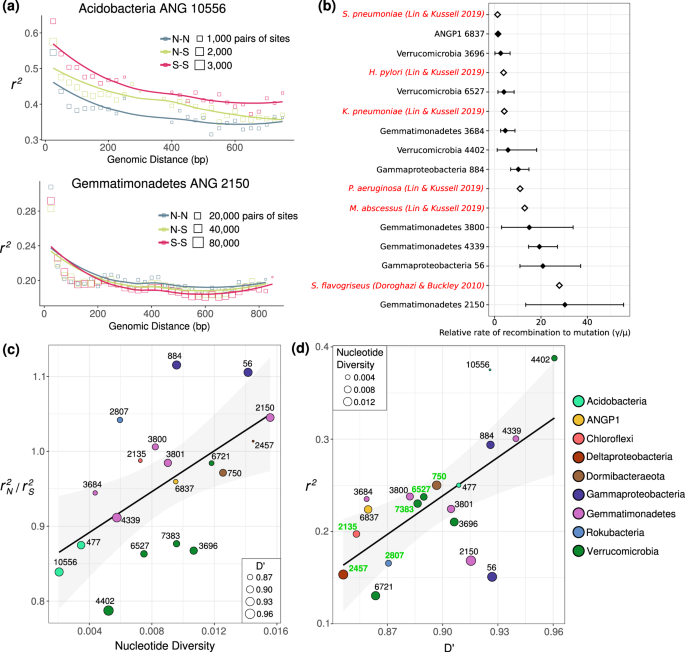
a Linkage decay of r2 for pairs of loci within the population with the lowest nucleotide diversity (top) and the highest nucleotide diversity (bottom). Each square is an average of pairs of biallelic sites at that distance, with the area of the square point proportional to the number of pairs of biallelic sites that went into the mean. Haplotypes (site pairs) are binned by the predicted function of the mutations of each of the paired SNPs (nonsynonymous: N, synonymous: S). b Relative rates of recombination to mutation calculated across the entire meadow for ten populations on synonymous third position codon sites, compared with previous values (red) reported by Lin and Kussell [16] and the value reported for Streptomyces flavogensis by Doroghazi and Buckley [20]. Error bars represent the 95% confidence interval across 1000 bootstraps. c The relationship between nucleotide diversity and r2N/r2S. The mean nucleotide diversity and the mean ratio of the linkage of nonsynonymous-nonsynonymous vs synonymous-synoymous pairs of mutations across species is shown. The size of each point represents the mean D′ value for that species. A linear regression is shown (linear regression; R2 = 0.29; p = 0.009). d The relationship between mean r2 and mean D′ across the 19 bacterial populations studied. Genomes with evidence for multiple operonic competence related genes are labeled in green. A linear regression model is shown (F-statistic: 11.9, Adjusted R-squared: 0.38, p = 0.003).
In the less genetically diverse populations, there was a noticeable higher r2 of synonymous variants linked to other synonymous variants than for nonsynonymous variants linked to other nonsynonymous variants (Fig. 4c). This has been previously observed in hotspring Cyanobacteria, and was explained as a decrease in coupling linkage for slightly deleterious nonsynonymous variants, where recombinants inheriting the doubly deleterious haplotype (of a pair of variants) are selected against [58]. In more genetically diverse populations, this ratio shifts toward nonsynonymous polymorphisms (r2N) having higher r2 than synonymous (r2S) (Fig. 4c). One recent study reported a similar positive rN–rS ratio as a signature of positive balancing selection in Neisseria gonorrhoeae [59]; for six of the 19 populations analyzed here, the genomic average r2N/r2S ratio was greater than 1 (Fig. 4c), also indicating a greater degree of coupling linkage for nonsynonymous variants in these populations. The increase in the r2N/r2S ratio with nucleotide diversity (linear regression; R2 = 0.29; p = 0.009) suggests an increase in the ratio of beneficial to slightly deleterious nonsynonymous SNPs as diversity increases.
Although r2 is often used as a signal to identify the presence or absence of recombination, r2 values <1 can occur with or without recombination. For example, three of four possible haplotypes (pairs of variants) for two biallelic sites could occur due to lineage divergence prior to mutation occurring at one of the sites. D′, an alternative metric of linkage equilibrium, is only <1 if all possible combinations of a pair of biallelic sites are observed [48], which can only occur in the presence of recombination or recurrent mutation. Generally, we found that average D′ for a population linearly correlated with mean r2 (Fig. 4d). Inspection of the distribution of pairs of SNPs separated by <~1 kb revealed that 3 of 4 possible haplotypes is most common, but there was detection of all four possible biallelic haplotype combinations (D′ < 1), at 7% to 36% of all site pairs in each population (Fig. S4). The observed frequencies of the least common of the four SNP combinations also were higher than expected based on sequencing error, although much less frequent than expected from linkage equilibrium, as evidenced by mean D′ values above 0.8. Nonetheless, the extensive appearance of D′ < 1 at a significant fraction of loci, along with a signal of linkage decay with genomic distance across all populations, provides firm evidence for ongoing processes of within population homologous recombination, albeit to different degrees between organisms.
Given evidence for recent homologous recombination, we searched the genomes for genes that could confer natural competence, such as homologs of the ComEC gene with all three functional domains [60], and identified loci with additional genes involved in DNA uptake and recombination [61] (Supplementary Table S3). We found that the presence of a ComEC homolog with multiple adjacent operonic recombination-related genes was strongly associated with the lowest values of D’ (Fig. 4d). Thus, it is likely that natural competence is a common mechanism that facilitates homologous recombination for abundant soil bacteria.
Gene-specific selective sweeps contribute to divergence of alleles across the meadow
In neutrally evolving local populations, nucleotide diversity is expected to increase monotonically with population size [47]. Across populations, as we did not see a relationship between nucleotide diversity and relative abundance (Fig. S5; linear regression; p = 0.88), purely neutral growth and processes cannot explain the observed differences in nucleotide diversity between these populations. Similarly, we also did not observe a significant relationship between diversity and abundance within species for 14 of the 19 populations (Fig. S5). Except for populations with the lowest nucleotide diversity, ratios of nonsynonymous to synonymous polymorphisms for each population are consistently low. This trend, as also observed in lake metagenomics [62] and whole genome comparisons [63], further indicates that purifying selection has eliminated slightly deleterious mutations in the populations that have accrued more nucleotide diversity (Fig. S6; linear regression; R2 = 0.25; p = 0.018). In all species except the least diverse population (an Acidobacterium), nonsynonymous variants also had consistently higher values of D′ than synonymous variants. Further, as genome-wide D’ decreased (more recombination), the degree to which nonsynonymous variants were more linked than synonymous (D’N/D’S) increased (Figs S7; S8). As the number of observed recombination events increased, nonsynonymous linkage increased in comparison to synonymous linkage. This effect is consistent with stronger selection on nonsynonymous variants with an increase in diversity: both purifying selection and positive selection would increase D’ for nonsynonymous SNPs.
Soil ecosystems are exceptionally heterogeneous, and environmental factors can change over millimeter distances, potentially due to changes in aboveground plant productivity, soil geochemistry, plant litter composition, and soil particulate structure [64]. While it is difficult to tease apart the effects of changing abiotic parameters over spatial scales, it is possible to examine how allele frequencies change over the scales within our study design. We calculated the pairwise fixation index FST for each gene between allele frequencies from the three meadow blocks for every species-group (Fig. 1b). For most populations, mean gene FST values were low (<5%), consistent with dispersal of most alleles between blocks (Fig. S9). For a minority of populations, mean gene FST values were consistently >10%, indicating that there was significant geographic organization of genetic structure at most loci across the genome (Supplementary Table S4). Therefore, while the total variation in genome-wide major consensus alleles is often well explained by meadow geography, most individual alleles have a high chance of being found at fairly similar frequencies across the meadow.
When specific loci are characterized by significantly higher FST than the background average for the genome, it is characteristic of population-specific (in this case, spatially defined) selective pressures acting on that locus [65]. To identify genomic regions of unexpectedly high FST, we scanned over a moving 5 gene window and tested if that region had a mean FST greater than 2.5 standard deviations above the genomic mean. We removed genes with either coverage 2 standard deviations above or below the mean coverage in either block from this analysis (Supplementary Table S5). To define the length of the genomic region with elevated FST values, we extended successful windows until the mean FST fell below this cutoff. This test at first identified 48 loci of elevated FST within some microbial genomes, despite those genomes having low average FST (Fig. S10). To further test for evidence of recent selection at these loci we looked for a statistically significant average increase in linkage and a significant change in nucleotide diversity compared with the genomic average in one or both of the blocks (Fig. 5a). We noticed that both signals of purifying selection (characterized by low N:S ratios) and a reduction in genomic coverage (potentially indicating gene loss in some portion of the population) often correlated with low nucleotide diversity in genomic regions, and based on this, caution against identifying gene-specific selective sweeps in metagenomic data based solely on a reduction in nucleotide diversity or SNP frequency. While we found many loci with unusual FST or strong changes in nucleotide diversity, our stringent criteria narrowed that set down to 8 high FST loci with significantly increased rates of linkage compared with the genomic background (Fig. 5c; Fig. S10). These loci also had significant changes in nucleotide diversity within blocks when compared with their genomic averages (Fig. 5b, c). All of these loci showed decreases in nucleotide diversity, consistent with selective sweep events in one or multiple meadow blocks. Genes at these loci also had higher N:S ratios than genomic averages, possibly consistent with either recent selection acting on beneficial nonsynonymous mutations or a local accumulation of slightly deleterious nonsynonymous genetic hitchhikers.
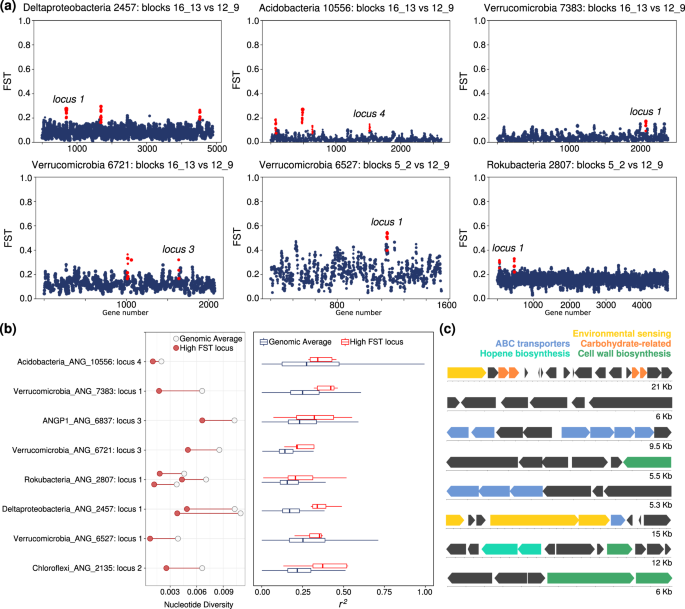
a Values of FST for genes across the genomes of six bacterial populations. Each point is a gene, and the size of the point is determined by the number of SNPs within that gene. Plotted is the mean FST for that gene. Loci with significantly higher FST than the background are highlighted in red, and those that passed further filtering are labeled by their genome-specific locus numbers used in part (b). b Left: Nucleotide diversity at highly differentiated loci (red circle) compared with the average (empty circle) for each population. Right: The extent of linkage disequilibrium at highly differentiated loci (red) compared with the genomic average (black) for each population. c Gene diagrams and annotations of highly differentiated loci (genome and loci identities given in b). Each block indicates an open reading frame, and blocks are colored by a subset of predicted functions.
Some loci with evidence of recent differential selection across the meadow contained transporter genes (Fig. 5c, Supplementary Table S6), which could indicate selective pressures for uptake of different compounds between sites. A Verrucomicrobia population also showed evidence of a selective sweep occurring at a putative hopene biosynthesis operon, often involved in regulating membrane stability. Within a Deltaproteobacteria population, a highly differentiated locus encoded for numerous genes involved in two-component systems and histidine kinases, potentially related to environmental sensing and response. Taken together, these multiple genomic signals suggest that gene-specific selection partially drives differences in population genetic structure across meadow soils.
Source: Ecology - nature.com
