Contents and mathematical statistics of trace elements in groundwater
The statistical results of the concentration of 13 trace elements in the 58 groundwater samples are shown in Table 1. The average concentrations indicate that Ba, Mn, Zn, Fe and As are the dominant elements in the 13 trace elements with 0.28, 0.077, 0.072, 0.017 and 0.027 mg/L, respectively. In contrast, the mean of Se, Cr, Pb, and Ni are rather low, which is around 1.3–8.5 μg/L. The average concentrations of Mo, Cu and Co are much lower than others, at 0.40, 0.21 and 0.12 µg/L, respectively. The minimum values of other trace elements, except for Ba, Mn, Zn, and Fe are all below the detection limit. Among the 13 trace elements in samples, As is the only one for which the average concentration exceeded WHO drinking water quality standard, that is 0.01 mg/L. While China’s drinking water quality standard GB5749–2006 sets the same upper-limit for As, it allows the tolerable value up to 0.05 mg/L for drinking water that was directly provided from non-center water supply. However, the concentrations of some trace elements in certain samples exceed China (GB5749–2006) and/or WHO standard30. According to the WHO drinking water quality standard, As is the main concern in study area as its over-standard concentration is found in 37.9% of the samples. The concentrations of Se in about 36.2% samples are higher than that of China’s standard, though they are all within the WHO standard. Cr, Mn, Ni, Pb, and Zn in several samples also exceed China drinking water quality standard. The concentrations of Cd in all groundwater samples were lower than the detection limit of our ICP-OES, despite many studies pointing out that Cd was the main pollutant in the Chang-Zhu-Tan urban agglomeration4. Due to the relatively high over-standard rates (showed in Table 1) of As, Se and Mn, their risk to human health in the study area are of concern.
In terms of coefficient of variation (CV), the CV of various trace element mass concentration (As, Co, Mn, Ni, and Zn) in groundwater is more than 100%, and the variation coefficient of the trace element determination method itself is less than 10%, indicating that the trace element content in each sampling point is quite different. High CV often indicates the potential pollution by human activities. The variation coefficients of Ni, Zn, and Mn in the study area are 411.2%, 238.1%, and 225.1%, respectively, which were classified as strong variation. This was consistent with the fact that there are relatively rich deposits of non-ferrous mineral resources. Se and Mn concentrations were affected by human activities, including agricultural, mineral, and urban industrial processes4.
The result of Pearson correlation analysis of the 12 trace elements and pH are showed in Table 2. Cd is excluded in the table due to its extremely low concentrations. Ba and Cr contents were significantly positively correlated as well as that of Ni, Cu, and Co. Zn and Mo also showed a significant positive correlation. Se and Pb were significantly negatively correlated (Table 2). The correlation among other trace elements was not significant, indicating that the source and transport pathway in groundwater are different from other trace elements.
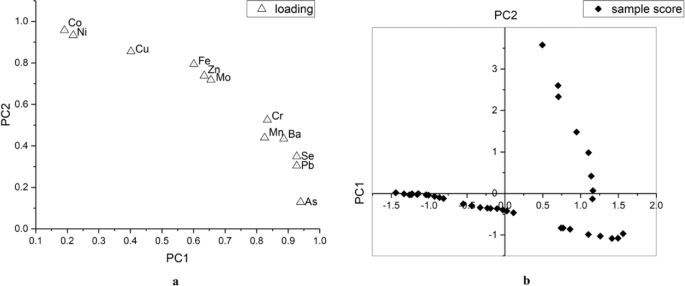
The results of PCA with a varimax rotation were presented in Fig. 2. The eigenvalues of the first two extracted factors are higher than 1, explaining about 94.1% of the cumulative variance contribution rate. Principal component 1 (PC1) was mainly loaded with As, Pb, and Se, while the principal component 2 (PC2) strongly correlated to Co and Ni. Cd was excluded from PCA due to the concentrations of Cd in all samples were below the detection limit of our ICP-OES.

Graphical display of (a) the loadings of trace elements on PC1 and PC2 and (b) the scores of samples on PC1 and PC2.
The loading plot (Fig. 2a) confirmed the results of the correlation analysis. There are relatively strong correlations between Co and Ni, Zn and Mo, Se and Pb. PC1 was dominated by As, Pb, and Se which might indicate that natural source has a significant influence on PC1 due to relative high background value of As in the soil of the study area31. Similarly, Mn and Ba, relatively enriched in the soil of study area, had high loading on PC1. Quite high loadings of Co, Ni, and Cu on PC2 could be explained by the strong association of these three elements in ores. Due to the prosperous metallurgical industry in cities Zhuzhou and Xiangtan, a significant amount of Co, Ni, and Cu in ores was released into the environment. Therefore, we defined PC2 as an anthropogenic source.
Figure 2b is the plot of scores of all samples on each principal component. According to the plot, most points located around the X-axis, which indicated that most samples had a relatively low absolute value of score on PC2. Only few points had high score on PC2. This result might prove that the groundwater from most sampling sites largely remained natural statues represented by PC1, while only a few sites were polluted by human activates.
Spatial distribution characteristics of trace elements
Compared to the national standard, the over-standard rates of Se, As, and Mn in the samples are 37.93%, 32.8%, and 12.1%, respectively.
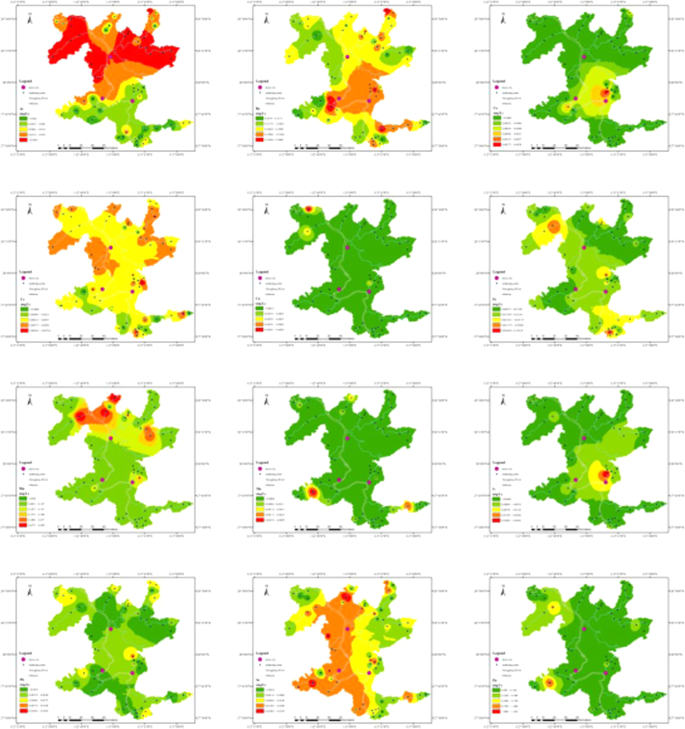
It can be seen from Fig. 3 that the maximum concentration is three times higher than the upper limit of the national standard for drinking water (0.01 mg L−1). From the perspective of spatial distribution, Se content of groundwater on both sides of the Xiangjiang River exceeds the national standard. Also, regions with high Mn content in this research area are mainly distributed in the upper reaches of the Xiangjiang River. The variation coefficient of Mn (227.09%) is quite large, which is a high-intensity variation. The Xiangjiang River basin is an economically developed and urbanized area in Hunan province. Within the basin, the mining and metallurgical industries are relatively well-developed. Zhuzhou Metallurgical Corporation, Shuikoushan Mining Bureau, and Xiangtan Iron and Steel Group are distributed along both sides of the Xiang River32. These developed industries cause pollution of trace elements, that is Mn and Se in rivers. At the same time, the production and domestic sewage polluted by the upstream point source enters the groundwater15, which enhances the ion exchange between soil Mn and some components in the groundwater as well as increases the content of Mn in the groundwater.

Distribution of the trace element contents in groundwater. (ArcGIS Desktop. 10.3. ESRI, California, US. https://desktop.arcgis.com).
The As in groundwater, as shown in Fig. 3, had similar tendencies as those of areas with high concentration area of C(As) > 0.01 mg/L in the north of Xiangtan and Zhuzhou city. Areas with As concentration higher than 0.05 mg/L were mainly along the Laodao River and Weishui River. The average background value of As in the Chang-Zhu-Tan Urban agglomeration soil is higher than China’s average level, with 7–16 mg/kg for paddy soil and 10–22 mg/kg for red soil. This may cause the As in soil to leach to the water in vadose zone and the As in bed rock to transfer into the groundwater in aquifer. The even distribution of As in the north of the study area also implied that the natural source was the dominant source.
China’s standard value of Zn in groundwater is 1 mg·L−1. Based on the spatial distribution characteristics of Zn, it was observed that Zn exceeds the limit at G48, which is located in Tuoxia village, Shitan town, Xiangtan city, Hunan province. In the sampling survey, it was found that there was no industrial source around. With the adjustment of the agricultural industrial structure, the scale of animal husbandry has been gradually developed, and the number of livestock and poultry breeding has increased exponentially. In some areas, a certain scale of animal husbandry has been formed. Zn is widely used as a feed additive in large-scale livestock and poultry breeding, which leads to a large amount of Zn in livestock and poultry excrement. When livestock and poultry excrement is applied as organic fertilizer to the soil, plants cannot fully absorb Zn, leading to Zn enrichment in soil. In the process of rainfall erosion, a large amount of sediment can enter the waterbody33 and Zn will adsorb and migrate together in the sediment34. Moreover, the interaction between surface water and groundwater will lead to Zn pollution in groundwater. In this study, ingestion is the main way to increase the Zn content in humans. The risk value of Zn through ingestion is nearly 100 times that of dermal absorption, suggesting that the intake of water is more likely to lead to toxic levels than dermal absorption.
The spatial distribution of Ni, Cu, and Co are similar, with the highest content mainly concentrated in the Longtoupu Xinglongshan Village, Zhuzhou City, Hunan Province. The Xinglongshan village has a key dispatching industrial park in Hunan province – Xinglong Industrial Park. Zhuzhou Tianlong Chemical Industrial Company, together with the Tianli Chemical Industry, Xinglong Construction, and White Carbon Black Fine Chemical Industry, constitute the Xinglong inorganic silicon chemical industry cluster. The industrial wastewater discharged by these chemical enterprises contains a large amount of Ni, Cu, Co, and some other trace elements, which enter groundwater through precipitation and runoff, thus increasing trace element content in groundwater35. Also, in the northwest region of the study area, the content of other trace elements, except Co and Ni, in the Weishui River basin is relatively higher. It is possible that these trace elements were from the mining and smelting activities and were transported with hydrologic gradients36.
The spatial variation of both carcinogenic substance (Cr) and non-carcinogenic substance (Ba) was less than 100%, that is 50.57% and 28.22%, respectively. Relatively low variation implied Cr and Ba in groundwater were less influenced by human activities. It can also be seen from the spatial distribution map that the content of Cr and Ba was evenly distributed throughout the study area, indicating that the high content of these two trace elements may be caused by natural non-point source pollution. Generally, Ba in waters is primarily derived from natural sources of weathering and subsequent pedogenesis37. Though Cr in all the samples met the standard and was distributed evenly, several sampling sites had relatively high Cr concentrations, which were significantly greater than average value. This indicates the influence of localized human activities.
Pb, Mo, and Fe elements are distributed in a scattered pattern in space, and the areas with high content mainly include the Ma’an Village of Zhuzhou city, the Lishutang Village of Zhuzhou county, the Xinglongshan Village of Zhuzhou city, the Yunnong demonstration area of Ma’an Village of the Zhuzhou city, and the Shitan Town of the Xiangtan City, which may be related to the surrounding point source pollution. Sewage generated by chemical plants, automobile repair factories, and rural waste that is discharged directly into the river without treatment, leads to the increase of Pb, Mo, and Fe content in groundwater. This is consistent with findings of other researchers15,38 that Pb mainly comes from lead deposits, soot emissions from coal-burning, and agricultural inputs.
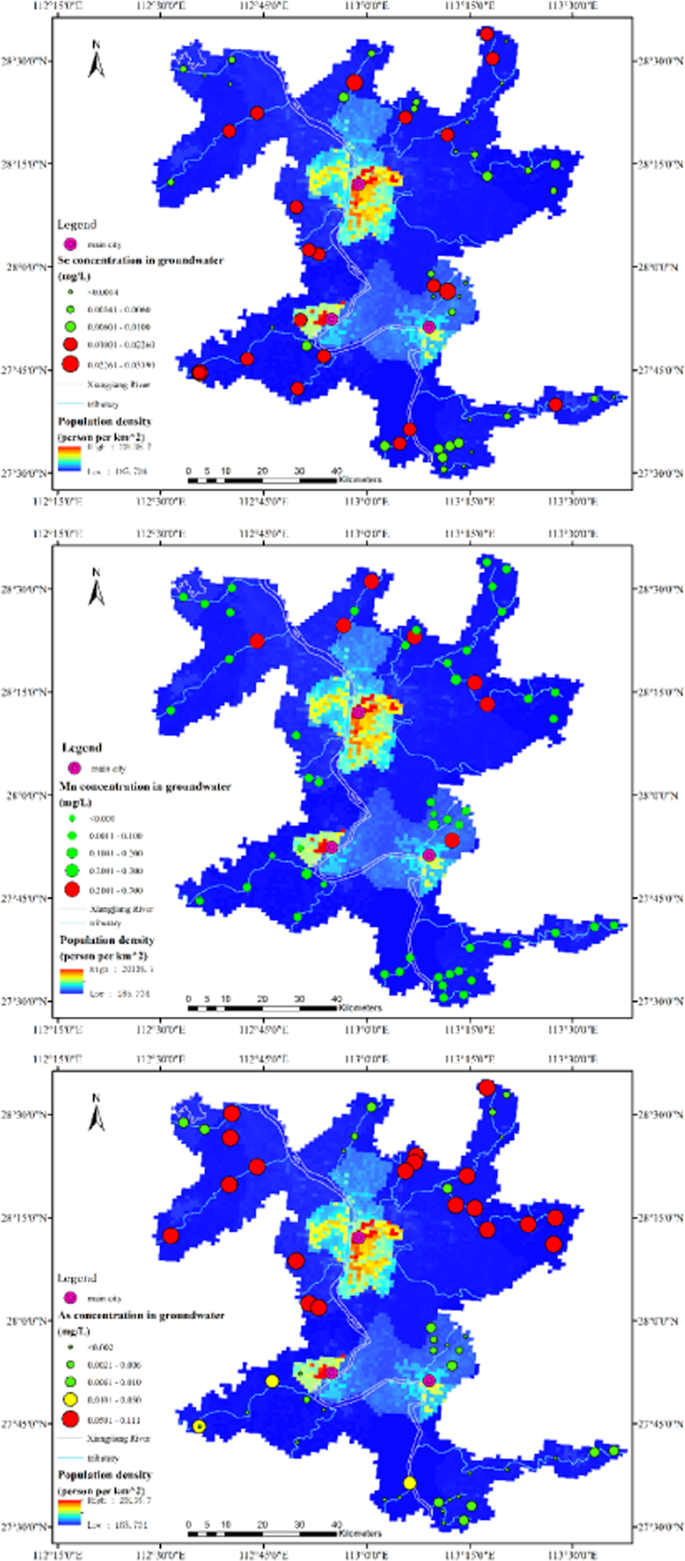
To understand the relationship among trace elements distribution, risk patterns, and population distribution, we draw the figures about the concentrations of Se, Mn and As in samples against population density (Fig. 4), due to their significant over-standard rate.

Spatial relationship between concentration of Se, Mn, and As against population density in study area. (ArcGIS Desktop. 10.3. ESRI, California, US. https://desktop.arcgis.com).
There were 37.93% of all samples with over-standard Se concentration. According to Fig. 4, most of those high concentration points were at the west side of Xiangjiang River, where has rich coal reserves and a long history of coal mining. Se is usually an associated mineral of coal, especially the lignite deposits. Other high concentration points of Se along the Laodao River might be a result of copper mining and smelting in the northeast of study area (Fig. 4). All these high concentration areas are not only threatening the health of people living in, but also posing risks to downstream big cities with high population density.
The sampling sites with over-standard Mn concentration were discretely distributed in the north of study area. Mn concentrations of other sites, however, were far lower than the over-standard ones. That might indicate small-scale human activities which usually would not pose risks to downstream.
Concentration of As in 32.8% of samples exceed the Chinese groundwater standard (0.05 mg/L). Most of these samples deriving from the sampling points located around Changsha city, along with the Laodao River in the northeast and Weishui River in the northwest (Fig. 4). Due to the special geological conditions of study area, high As concentrations in rock bed have significant influence on soil and adjacent groundwater. Considerable amount of As could be transferred from groundwater to tributaries by groundwater discharge and directly move into Xiangjiang River, which is the drinking water source for Changsha, a city with more than 8 million people dwelling in.
Health risk assessment
Based on the health risk assessment model, the health risk and carcinogenic risk caused by trace elements through ingestion and dermal absorption of trace elements in groundwater in the core area of the Chang-Zhu-Tan urban agglomeration were calculated. In general, when HI is less than 1, the health risks to human are within acceptable risk levels. As shown in Table 3, HQ of non-carcinogenic substances (Ba, Cu, Fe, Mn, Mo, Ni, Pb, Se, and Zn) caused by drinking water and skin contact are all less than 1. The health risk values caused by 12 trace elements in groundwater are within the range of 1.64 × 10⁻⁴ to 1.25 × 10⁻¹. HQ of Mn and Ba is the highest, while the HQ of Cu is the lowest. Çelebi et al.21 also demonstrated that higher HQ value of Mn was found in groundwater of Melen watershed, Turkey. Mn is a basic element of metabolism and is derived from foods for human consumption. Of all the target tissues, the brain is the most sensitive to Mn. Drinking Mn-rich water causes neurological diseases.
Although drinking Mn-contaminated water has shown no carcinogenic or mutagenic effects, it can cause high blood pressure39. Therefore, Mn and Ba levels in groundwater need to be closely monitored.
For each of these trace elements, HQ ingestion is higher than HQ dermal, which means that the health risks of various non-carcinogenic substances caused by ingestion are higher than those caused by dermal absorption. In terms of the method of ingestion, the exposure risk of Ba element is the highest (1.23 × 10⁻¹), while that of Cu element is the lowest (1.63 × 10⁻⁴). The sequence of health risk associated with are non-carcinogenic drinking water is, as follows: Cr > Co > Mn > Ba > Pb > Cd > Se > Zn > Fe > Mo > Ni > Cu. Cr has the highest health risk of 2.40 × 10⁻² through skin contact, while Cu has the lowest exposure risk of only 9.79 × 10⁻⁷. The order of skin exposure risk of various trace elements is Cr > Co > Mn > Ba > Pb > Cd > Se > Zn > Fe > Mo > Ni > Cu. In addition to Cr, the health risk value of dermal absorption exposure was 1–3 times smaller than that of ingestion. In general, the health risk of 13 trace elements through ingestion and dermal absorption was less than 1. This indicates that in well waters in the core area of the Chang-Zhu-Tan urban agglomeration, the health risks caused by the trace elements of As, Ba, Cu, Fe, Mn, Mo, Ni, Pb, Se, and Zn through ingestion and dermal absorption are small, and they will not pose obvious harm to the exposed population.
In this study, the contents of carcinogens Cr, Pb, and Cd did not exceed the standard value of groundwater in China (Table 1). The TCR value is 5.79 × 10⁻⁵, which is within the acceptable risk level (10−6 ~ 10−4). Among the ways of ingestion, Cr was the highest (5.00 × 10⁻⁵), which is 12.5 times and 12.8 times of the carcinogenic risk of Pb and Cd, respectively. Hunan province ranks sixth in China in terms of Cr emissions. The Cr emission in the Chang-Zhu-Tan area accounts for about one-third of the total Cr emission in Hunan province15. Therefore, Cr appears to be the main pollutant source to produce cancer among these trace elements. Special attention should be given to the management of Cr pollution in the waters in the study area. So far, although China has formulated groundwater environmental quality standards, the evaluation model of health risk of carcinogens in water still needs to apply the evaluation model recommended by EPA, which is influenced by different regions, residents’ height and weight, drinking water intake rate, and life expectancy. Currently, there is no agreed limit for acceptable maximum carcinogenic and non-carcinogenic risk levels in China. Therefore, this study is only a preliminary assessment of the health risk of groundwater in the core area of the Chang-Zhu-Tan urban agglomeration. Future work should focus on these specific problems to improve the health risks of the water environment in China’s urban agglomeration construction.
It is important to note that the determination of trace element pollutants in our study of other elements through ingestion is far higher than that of dermal absorption, and the amount of Cr by ingestion and dermal absorption risk value is 3.34 × 10⁻⁵ and 2.40 × 10⁻⁵, respectively, and cancer risk value of Cr element is high. Therefore, the dynamic change of groundwater in the Cr should be monitored closely. Besides, all kinds of trace elements on human health hazards are not independent, but there is a certain inner link. While the interaction among various risk factors, environment, individual genes, and lifestyle together determines the level of health risks, there is no unified way to assess the health risks caused by various mixed risk factors. This will also be the topic of further research.
Source: Ecology - nature.com


