Moscow
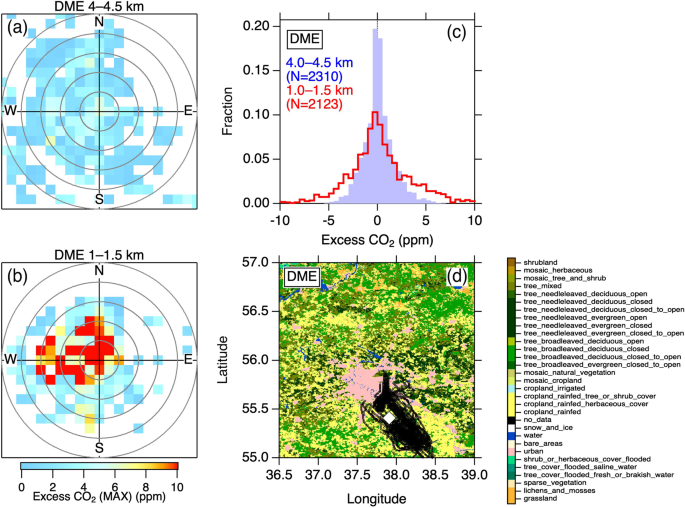
We analyzed appearance of high CO2 events in two altitude layers (4.0–4.5 km and 1.0–1.5 km) over Moscow Domodedovo Airport (DME) as a function of wind direction and speed (Fig. 1a,b). These plots indicate wind direction and speed in which high CO2 events were observed in the measurement area. At altitudes of 4.0–4.5 km, almost no CO2 enhancements in any wind direction and speed are evident (Fig. 1a), indicating that variability of CO2 enhancement (defined as excess CO2; see Methods) is small in the free troposphere. In contrast, at 1.0–1.5 km, it is seen that high CO2 events were associated with winds mainly from the northwest sector (Fig. 1b). At altitudes of < 2 km, our measurement aircraft was primarily in the southeast of the Moscow metropolitan area (pink area in Fig. 1d) in all cases and influenced by CO2 emissions from the city when advected from northwest. In addition, the fact that high CO2 events appeared with relatively low wind speed (<15 m s−1) suggests that a presence of strong emissions close to the airport is likely. The Moscow metropolis covers an area of ~50 km in the northwest-southeast direction, a distance an air parcel with a speed of ~15 m s−1 traverses in ~1 hour. Longer residence time of an air mass over the metropolitan area would allow city emissions to be more integrated into the air mass, leading to results consistent with the observations of high excess CO2 at low wind speeds. Histograms of excess CO2 values at both altitudes (Fig. 1c) shows that the excess CO2 at the lower altitude undergoes higher variability (i.e. larger spread of the histogram), and it is likely that the urban plumes contributed to the increased CO2 variability with decreasing altitude.

Variability of atmospheric CO2 enhancement over Moscow Domodedovo Airport (DME). (a,b) Maximum excess CO2 values observed in wind direction (angle) and speed (distance from the center) bins at 4.0–4.5 km and 1.0–1.5 km altitude (a.g.l.), respectively. Circles in grey represent every 5 m s−1 wind speed. (c) Histograms of excess CO2 at 4.0–4.5 km (solid purple) and 1.0–1.5 km (solid red line) altitudes. Note that excess CO2 = 0 means that the CO2 data point lies close to the climatological seasonal variation over the airport, whereas large deviations indicate excursion from the representative seasonal variation. (d) The CO2 measurement positions at altitudes of <2 km (black circles). The open diamond is the location of DME. The land cover data are from a global land cover map product36 and the map was generated by Igor Pro 7 (https://www.wavemetrics.com).
Tokyo
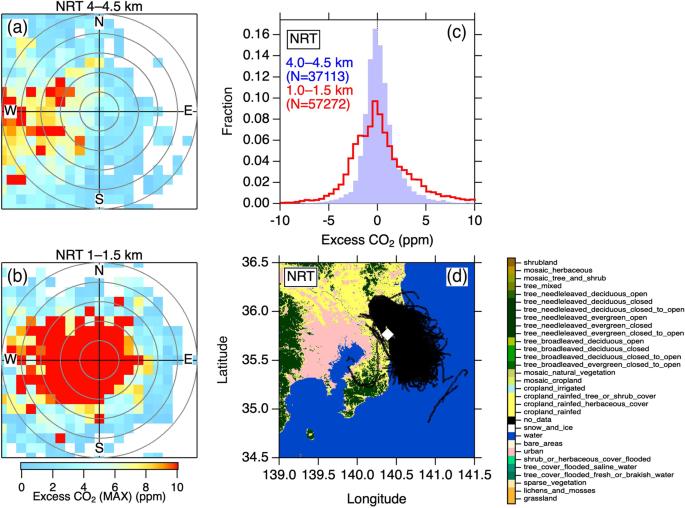
Similarly, we analyzed the data over Tokyo Narita Airport (NRT), located ~60 km to the east of the Tokyo agglomeration center (Fig. 2). The flight tracks at <2 km altitudes over NRT are roughly located on the eastern edge of the metropolitan area (Fig. 2d). We found that high CO2 air masses were associated primarily with air parcels with relatively weak wind speed from the west of the measurement positions (Fig. 2b). The high excess CO2 values (>10 ppm) were associated with <20 m s−1 westerly and <10 m s−1 easterly. The Greater Tokyo Area is ~100 km wide, the distance a westerly air mass at <20 m s−1 would pass over in > ~1.5 hour. Along with the DME analysis, this result suggests that an adequate residence time of >1 hour over the metropolitan area provides measurable accumulation of CO2 up to ~1 km altitude in the overlying air mass. At the higher altitudes (Fig. 2a), transport of high CO2 was observed in the westerly at relatively high wind speed (>10 m s−1). It is again seen that the variability of excess CO2 is larger in the lower layer (Fig. 2c).

Same as Fig. 1, but for Tokyo Narita Airport (NRT).
Cities worldwide
We applied the above analysis to all of the 36 airports worldwide. At ~1 km altitude over many airports, we identified characteristic wind direction sectors where high CO2 events were observed, and in each case the wind direction corresponded well to the geographical location of the urban agglomeration of the nearby large city (Supplementary Fig. S3–S36). High CO2 enhancements were usually observed at relatively low wind speeds (roughly < 15 m s−1). Vertical distributions of excess CO2 indicate that, in most cases, the ~4 km altitude is above the boundary layer, and thus the associated CO2 histograms reflect the free tropospheric conditions. In contrast, the histograms in the 1.0–1.5 km layer show considerable broadening at many airports, indicating the presence of nearby surface fluxes that cause fluctuations in CO2 in the overlying atmosphere. Therefore, at most airports, the lowermost altitude layers of the CONTRAIL measurements are under substantial influence of CO2 emissions from the nearby urban area.
The above results point to the possibility of a relationship between the magnitudes of atmospheric CO2 variability and of associated urban CO2 emission. We used standard deviation (SD) of excess CO2 as an indicator of the magnitude of the short-term CO2 variability observed at all airports (Fig. S2). We observed SD exceeding 5 ppm at heights 1 km and lower over several airports, but at every airport, it decreases to <2 ppm at higher altitudes, i.e. the free troposphere (Fig. S37). Although the SD varies seasonally at heights less than or around 1.0 km over some airports (e.g. NRT), the seasonality in the SD is not common over most airports. For the data analysis below, we therefore calculated the annual SD values, regardless of the data gaps at individual airports.
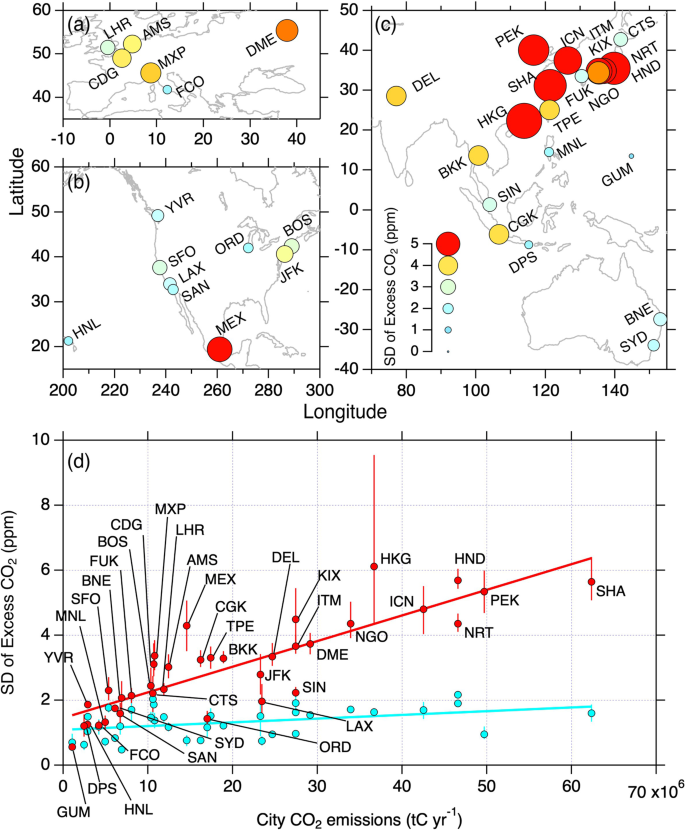
We found that CO2 variability at 1.0–1.5 km altitudes is largest over some Asian cities, and moderately large over some cities in Europe and North America (Fig. 3a–c). Large CO2 variability is associated with urban areas with largest populations in the world; for instance, Tokyo (corresponding airports are NRT and HND) is ranked as the world largest urban agglomeration by population in 2010, and Delhi (DEL), Mexico City (MEX), Shanghai (SHA), and Osaka (ITM and KIX), over which we found the large SD values, are all listed in the top 10 population cities11. The most airports with small SD and vertical gradient are located in coastal areas, and the associated cities are relatively small in CO2 emissions (Table S1).

Variability of CO2 enhancements over cities worldwide. (a–c), Maps of the SD values at 1.0–1.5 km altitudes. Size and color of the circles indicate magnitude of the SD (see the legend in panel c). (d) Relationship of the SD at 1.0–1.5 km (red) and 4.0–4.5 km (light blue) altitude bins with city CO2 emissions based on the ODIAC dataset26,27. Solid lines are least square fits to the data at respective altitude bins. Airport codes are indicated for the data from 1.0–1.5 km. The error bars represent range of the SD calculated by a Bootstrap method (N = 1000).
We plotted the airport SD as a function of CO2 emission from the nearby associated city for 2010 (Fig. 3d). Here we aggregated CO2 emissions within 50 km to the east, west, north and south from a representative city center such as city hall, main station and local government building based on the ODIAC (Open-source Data Inventory for Anthropogenic Carbon dioxide, version ODIAC2015) dataset26,27. It is seen that, in the free troposphere (4.0–4.5 km), the SD is small (<2 ppm) over all the airports, irrespective of the intensity of CO2 emission from a nearby city (R2 = 0.16); in contrast, at the low altitude (1.0–1.5 km), the SD has a significant correlation with city CO2 emission (R2 = 0.73), suggesting considerable influence of the urban CO2 emissions on our measurements. A significant correlation (R2 = 0.68) is likewise observed for the data below 1 km, but with a larger scatter and a less compact correlation plausibly due to higher variability and less number of data. It is notable that there are some exceptional cities whose variabilities show excursions from the general trend; the SD values over Singapore (SIN), Los Angeles (LAX), and Chicago (ORD) are as small as those in the free troposphere; those over Hong Kong (HKG), Osaka (KIX), and Mexico City (MEX) are disproportionally high with large uncertainty. Here we used the ODIAC dataset, as it provides up-to-date gridded estimates of anthropogenic CO2 emissions. It is noted that the use of different anthropogenic CO2 emission datasets would not significantly affect the present result, given the fact that the existing CO2 emission datasets (including ODIAC), with their major differences originating in the downscaling of national totals, correlate well with each other at the spatial scale of the current study (100 km × 100 km) or even smaller28.
Despite various factors that could contribute to the CO2 variability over airports, our results strongly suggest that the intensity of the nearby urban CO2 emissions is the primary component of the magnitude of the observed CO2 variability (Fig. 3d). Our analyses of the wind pattern (Figs. 1, 2 and Supplementary Figs. S3–S36) indicate that the CO2 variability at ~1 km altitude is, to a large degree, driven by the advection of high-CO2 air masses influenced substantially by CO2 emissions from the nearby city. It is likely that larger CO2 emissions enhance contrast of atmospheric CO2 mole fraction between their downwind and other locations, which makes fluctuations observed during multiple flights larger. The observed correlation may suggest that our lowest measurable altitude (1.0–1.5 km) is plausibly the height region where city-scale (~tens of km) emission imprint is distinct, and in which smaller-scale heterogeneity due to spatial pattern of emissions and local meteorology is relatively smoothed out. Previously, ground measurements in Paris showed that more urbanized part of the city showed larger CO2 variations due to spatiotemporal variations of nearby anthropogenic emissions15. Moreover, the present result is consistent with a previous modeling study23, which showed, by analyzing the CONTRAIL CO2 vertical profiles over NRT, that the magnitude of the atmospheric CO2 variability in the boundary layer is highly sensitive to the magnitude of anthropogenic local fluxes.
Source: Ecology - nature.com


