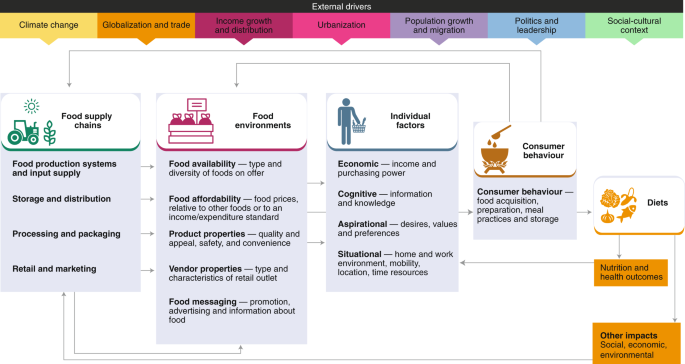
Limited data availability is a challenge that hinders all data visualization tools — the Dashboard included. The DataDENT Initiative showed that in many data visualization tools there are no data for the indicators of interest, data are out of date, trend data are not available, data are only available for a small number of countries, or data are not available at the geographic level needed such as sub-national data12. Given these limitations, the Dashboard can also be used as a tool for advocacy. We hope that flagging important indicators that have limited or no data will generate more data collection and sharing. More data are needed, especially for diets, individual factors, consumer behaviour and food environments, as well as disaggregated data at sub-national levels. We are reaching out to research groups around the world from various disciplines and sectors who are willing to work with us and share data.
The dietary data included in the Dashboard are from the Global Burden of Disease study. While these are the most accessible data currently available, they are from modelled estimates that may under- or over-represent actual dietary intakes. While there may be typical diets in some countries, there is also a lot of variation and thus individual dietary intake data that are nationally representative are critical, but this does not exist. Thus, data are needed on dietary intakes for people in different age groups, genders and in different regions. The World Bank’s Living Standards Measurement Study (LSMS) includes data on food consumption and expenditures, which would be a useful addition to the Dashboard, but these data would need to be processed in a comparable way to the Global Burden of Disease data to be included. Specifically, household expenditures on various items would have to be combined such that expenditures on individual dietary risk factors, including vegetables (as a whole group), legumes, nuts and seeds, sugar-sweetened beverages, processed meats and other food groups, can be determined. Additionally, household expenditures would need to be analysed to determine expenditures on food components that are dietary risk factors, such as expenditures on fibre and sodium.
For individual factors — a person’s economic status, knowledge, aspirations and life situation — limited information is available. Of all these, the Dashboard only has robust data for economic factors (that is, income). Data on individual information, knowledge and preferences, as well as food acquisition and consumer behaviour, would further strengthen understanding of the relationship between food systems, behaviour and diets. For example, it would be useful to better use the LSMS and other Household Consumption and Expenditure Surveys (HCES) data to characterize food acquisition at the household level in a centralized data repository. Additionally, while there are data on food sales, that data were determined to be more of a reflection of the food environment and food prices rather than food acquisition. Further, there are limited data available for consumer behaviour related to food preparation, meal practices and storage. These areas of consumer behaviour, more commonly addressed in smaller-scale qualitative studies, are all critical determinants of diets and health, and we urgently need to collect data to better understand them and take informed action.
Food environments also need better and more complete data. While food availability, food prices and access to specific food outlet types (often in urban areas) have been fairly well characterized, we have limited data available on other aspects of the food environment, such as food quality and safety. In particular, food safety indicators are needed to assess contamination of food with toxins, chemical contaminants and adulteration, in addition to statistics on foodborne illness in light of the Ebola epidemic and COVID-19 pandemic. Food marketing and packaging data are also needed to shed light on desirability and convenience of foods — much of these data may be collected but are inaccessible behind paywalls. Another critical gap is the understanding of how individual factors interact with food environment characteristics to determine the desirability and convenience of certain foods13.
The Food Systems Dashboard will be launched 1 June 2020 and can be accessed at foodsystemsdashboard.org. The Dashboard will continually be updated with new data, new indicators and sub-national data when available. Over the course of 2020, the Dashboard will be piloted among policymakers in several countries with distinct food system challenges, including Tanzania and Indonesia, as well as others to be determined in the future, to assess usability, utility, and sub-national data collation for deeper food systems analysis.
The Food Systems Dashboard is a community resource that we believe has the capacity to allow policymakers to understand their national food systems and the challenges they face, to prioritize and decide on actions to improve diets for health. We are seeking more data from those working in food metrics and databases, more partners and, ultimately, more users to contribute to, and avail of, this resource.
Source: Ecology - nature.com


