The following chapter presents the insights gathered from the reconstruction of the historical dimension of wildlife trends and species occurrence gathered from the secondary data (literature and document) analysis followed by the expert interviews and community questionnaires.
Wildlife and human-wildlife conflict trends
Table 1 presents population estimates of the elephant, blue wildebeest, plains zebra, lion and African buffalo for all KAZA TFCA countries. Elephant populations in Namibia and the other KAZA countries have steadily increased since 1934. Plain’s zebra numbers considerably increased in Namibia, but decreased in Botswana, Zambia and Zimbabwe. While the Namibian lion and buffalo populations have remained at a constant level, lion populations in the other KAZA countries decreased. Buffalo numbers increased in Botswana and decreased strongly in Zimbabwe. After sharp declines in wildebeest populations around 1965, they are recovering in both Namibia and Botswana. A more detailed description of wildlife trends can be found in Supplementary Material 6.
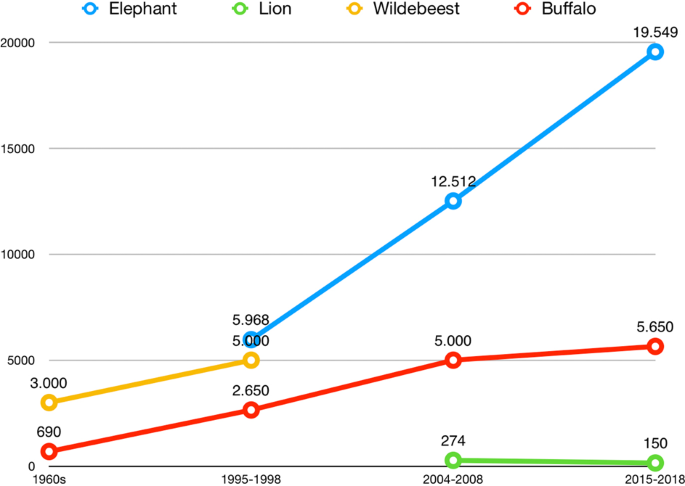
Wildlife numbers in the table above represent species populations for the whole country. Figure 2 shows wildlife trends for four of the five studied species in the Namibian component of the KAZA TFCA. Unfortunately, no disaggregated data by region was available for the Plain’s Zebra and older surveys for the Zambezi and Kavango Regions do not exist. The data from 1995 to 2015/2016 shows that elephant numbers in the Namibian component of KAZA have more than tripled. The region hosts most of Namibia’s elephant population estimated at 22 754 in 2016. Lion populations have declined. However, this estimate for 2018 by the IUCN Cat Specialist Group was not based on new data. Both wildebeest and buffalo populations increased as well. No recent information or aerial surveys have been published since the study of Estes and East in 2009. However, wildebeest seem to recover after they reached their lowest level between the 1960s and 1980s17. Buffalo populations have also increased considerably since the 1960s. The estimate of the most recent buffalo population (5650 heads) is based on buffalo sightings during the 2018 conservancy game counts conducted by NACSO in the region. The buffalo population in 2018 is thus likely to be a severe underestimation as it does not account for buffalos living outside of conservancies and conservancies that have not been surveyed.

Wildlife trends for the elephant, blue wildebeest, plains zebra, lion and African buffalo in the Namibian component of the KAZA TFCA. The graph depicts the wildlife numbers for four species (elephant in blue, lion in green, wildebeest in yellow and buffalo in red ) in the three regions (Kavango East, Kavango West and Zambezi) that constitute the Namibian component of the KAZA TFCA.
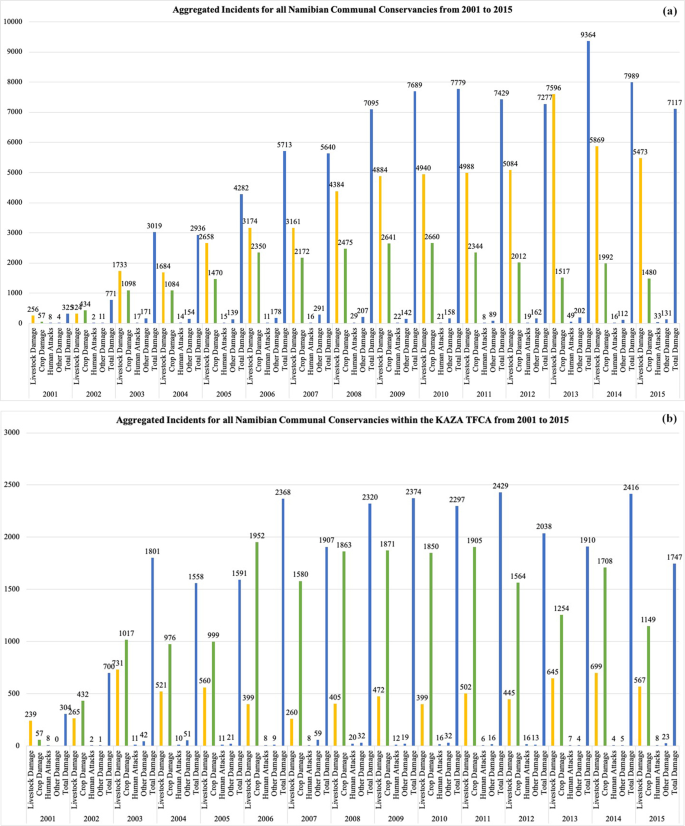
Data on reported human–wildlife conflict incidents for all conservancies employing the Event Book System in Namibia and conservancies located in the KAZA TFCA over the last 15 years show different trends. Reported incidences of human–wildlife conflict in all investigated conservancies (Fig. 3) were initially low. From 2003 to 2013 the reported incidents increased and then decreased between 2013 and 2015. Reported incidents in conservancies within the KAZA TFCA (Fig. 3) increased until 2003. Thereafter, incidents remained relatively constant with upward and downward fluctuations. Taking into account all studied conservancies in Namibia, predation of livestock by wildlife is the main challenge. Considering data from the conservancies that lie within the KAZA TFCA alone, crop damage is reported more often (on average around 71% of all reported incidents between 2002 and 2015) than in the Namibian context. Crop damage has decreased in these conservancies since 2012 and livestock predation is increasing. Human attacks and other damages, for example to infrastructure, are much less common (less than 5% of all reported incidents).

Reported human-wildlife conflict incidents in all conservancies that lie within the KAZA TFCA (n = 21) and in all investigated Namibian conservancies (n = 85). Map (a) shows the trend in human-wildlife conflict in all communal conservancies in Namibia between 2001 and 2015, while map (b) shows the trend in incidents in the communal conservancies lying within the Namibian component of the KAZA TFCA. The graph shows incidents of livestock damage (yellow), crop damage (green), human attacks (black) and other incidents (dark blue) as well as the total incidents (blue).
Reconstruction of historical occurrence of selected species
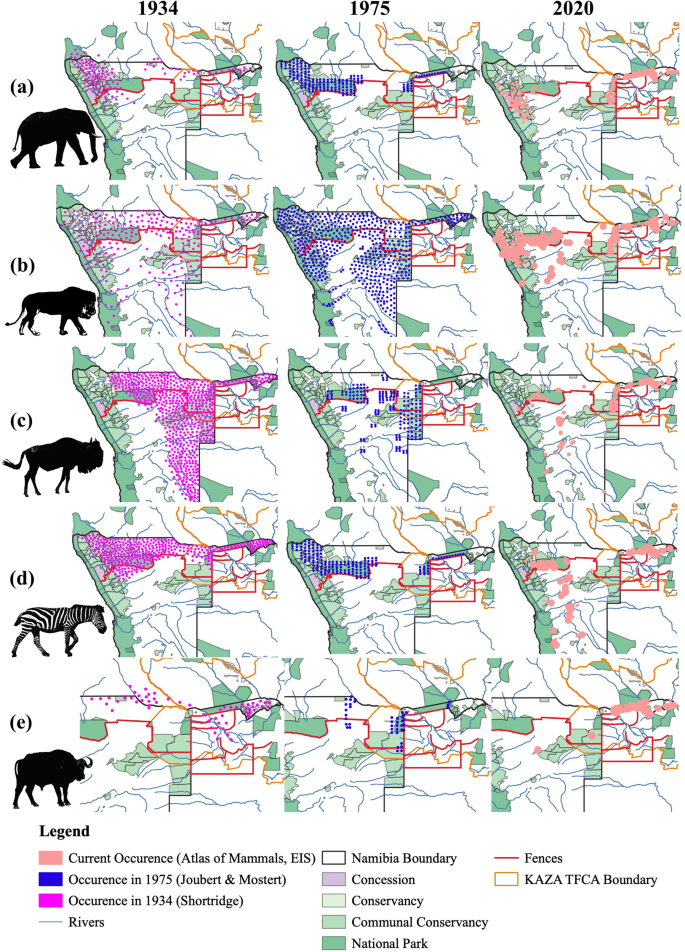
Figure 4 shows the occurrence patterns of the five selected species in 1934, 1975 and the most recent range from the Atlas of Mammals29. Lion and elephant populations expanded their range between 1934 and 1975. Their most recent range is considerably smaller than in 1975 and they are increasingly restricted to protected areas in the Namibian component of the KAZA TFCA and around the Etosha National Park. In the past, the African buffalo had a limited range along the Okavango and the large rivers in the north-east. Today, there are no more buffalos along the Okavango River in north-central Namibia, but they occur all over the north-east. The range of the two migratory species, plain’s zebra and blue wildebeest, was considerably smaller in 1975 than 1934. However, both species were able to recover some of their former range due to reintroductions to farmland and private reserves.

Occurrence patterns of the elephant, lion, blue wildebeest, pains zebra and African buffalo in 1934, 1975 and the most recent range. The map shows the distribution of the elephant (a), lion (b), blue wildebeest (c), plains zebra (d) and African buffalo (e) in 1934 (purple), 1975 (blue) and the most recent range (pink) indicated in the Atlas of Mammals (Atlasing of Namibia Initiative, Environmental Information Service Namibia) mapped using QGIS 3.1214. The size of the points is a result of different grids used for the data collection, which is explained in more detail in the methodology and Supplementary Material 1. In addition, it shows the location of fences (red), rivers (blue) and protected areas (different shades of green with increasing protection).
Figure 4 shows larger fences in Namibia and Botswana. Furthermore, the wildlife dispersal areas for 1934, 1975 and the current range based on the Atlas of Mammals and Carnivores are mapped. Fences seem to have a considerable effect on elephant, buffalo and to a certain degree also blue wildebeest. Shortly after the construction of a game-proof fence, the so-called “veterinary cordon fence” or “Red Line in Namibia in 1975, the range of the blue wildebeest was severely restricted, apart from a few smaller populations that survived south of the fence. The Atlas of Mammals also suggests a considerable influence of fences on wildebeest range. The plain’s zebra range also seems to be considerably influenced by fences -especially in the north-east. For both zebra and wildebeest, outliers can be explained by reintroductions on private game farms. The effect of fences on the buffalo population seems to be significant. Buffalo range is cut off along the border fence with Botswana to the west, the Red Line to the south and the Caprivi fence in the Bwabwata National Park. In 1975, elephants occurred south of the Red Line. In the current range elephants are restricted to protected areas (Etosha NP, Khaudom NP, Mangetti NP). Within the Bwabwata National Park their range is cut off along the border with Botswana in the south-western part. Lion range is less influenced by the Red Line in the Etosha/Kunene area, where they occur on both sides of the fence, but is much more restricted in the north-east, where it is cut off by the border fence with Botswana, the Caprivi fence, as well as the Northern and Southern Buffalo fences in Botswana.
Human component: poverty, population density & land-use
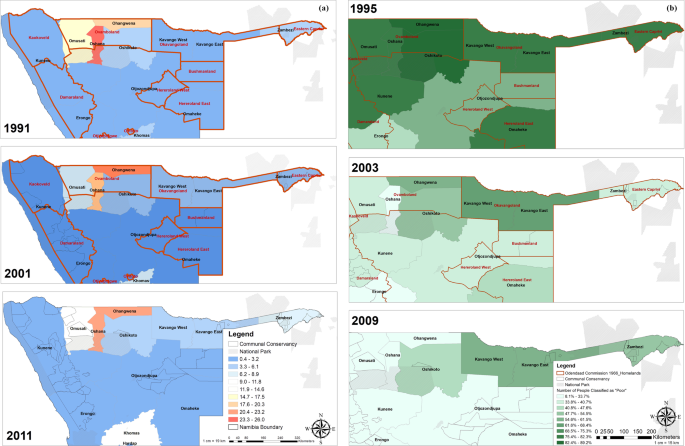
Population density is high in the northern regions of Namibia compared to the rest of the country, especially in some of the former black “homelands” such as Ovamboland, Okavangoland and Eastern Zambezi (Fig. 5). Based on population and housing census data of the Namibia Statistics Agency, there has been an overall increase in population from around 1.4 million in 1991 to around 2.1 million in 2011. As a result, population density has increased across the country. For example, the population density in the Zambezi region has increased from 4.9 inhabitants/km2 to 6.2 people/km2. Density in the Kavango region increased from 2.7 to 4.6 inhabitants/km2 and from 0.9 to 1.4 inhabitants/km2 in the Otjozondjupa region30,31.

Population density by region in 1991, 2001 and 2011 and the number of people classified as poor by region in 1995, 2003 and 2009. The figures show the population density (a) and poverty level (b) over time for northern Namibia mapped using QGIS 3.1214. Population density is indicated in people per square km: low values are indicated in dark blue and while high values are indicated in dark orange. Black homesteads -to which indigene communities were relocated under South African administration- are outlined in red. The level of poverty (% of people classified as poor) ranges from light green (low) to dark green (high). Light grey areas indicate national parks.
Based on the population censuses of the Namibia Statistics Agency (NSA), the number of people classified as “poor” has been reduced considerably since independence in 1990 (Fig. 5). The proportion of the population classified as poor was reduced in the Kavango (76.3% in 1993/4 to 55.2% in 2011) and Otjozondjupa regions (60.1% in 1993/4 to 33.7% in 2011). The Zambezi region, which had the highest proportion of “poor” people (81.3%) in 1991, also experienced a decrease in 2003/04 (36.5%). However, the proportion increased again to 50.2% in 201132. Although poverty in the Namibian component of the KAZA TFCA has been reduced significantly since independence it remains at a relatively high level compared to the rest of the country.
Displaying data on irrigated areas, livestock density and cropping activity in Namibia shows considerable agricultural activity in the Namibian component of the KAZA TFCA (Fig. 1). High livestock densities (max. 10 livestock units/km2 33 occur in the eastern Zambezi region, especially along the border with Zambia. Even within conservancies livestock densities can be high. In the central Zambezi region, a considerable area is under cultivation. Smaller areas with fields can be found all over the region and within conservancies. Two larger irrigated areas can be found in the Zambezi region, one in the Central Zambezi region and one within the Bwabwata National Park. Cattle are allowed within the multiple-use zones of the Bwabwata National Park and communities have small crop fields. Another “hotspot” of agricultural activity is along the border with Angola with relatively high livestock densities and a number of irrigated areas. The rest of the Namibian component has relatively low agricultural activity.
Expert interviews & community questionnaires
Expert Interviews were conducted with two representatives from the University of Namibia Department for Wildlife Management and Ecotourism, two local and two international NGOs, a government and a KAZA representative, as well as one external consultant and two representatives from community organisations. Two female experts and nine male experts were interviewed. Most participants, who answered the community survey, were between 25 and 35 years (46.3%) and 18 and 25 years (23.9%) old. Thus, the majority of respondents was relatively young and mostly male (64.2%). Ninety-five point one per cent of survey participants were members of a conservancy. The majority of respondents are members of the Kyaramacan Association in Bwabwata National Park (17), Dzoti (7) and Bamunu (7) conservancies. Surveys were also completed in Balyerwa, Kwandu, Mashi, Mayuni, Sobbe and Wuparo. Eleven respondents could not be assigned to a conservancy, either because they were not members or because they did not answer the question.
All experts agreed that the main challenge Namibia is facing is dealing with human–wildlife conflict. This increase was confirmed by communities living in the areas: Sixty per cent of the surveyed community members felt that human–wildlife conflict had increased over the past years, while 32.3% reported a decrease. The most common problems caused by wildlife were crop damage (87.9%) and livestock predation (69.7%). Loss of human life (18.2%) and damage to households (9.1%) were less frequent. The majority only experienced human–wildlife conflict a few times a year (59.1%). Others (18.2%) came into conflict a few times a month or every other month (12.1%). The elephant was stated as one of the main conflict species by 92.3% of respondents, followed by the buffalo (44.6%) and lions (43.1%). While the elephant was seen as a conflict species in every studied conservancy other species were more localised. For example, lions were reported as one of the main species causing major conflicts in Balyerwa, Bamunu, Dzoti, Sobbe and Wuparo, while inhabitants of the Bwabwata National Park, Mashi and Mayuni conservancy did not consider lions as a main conflict causing species in their area.
According to the experts, human–wildlife conflict can be driven by competition for food and space. Livestock is an important investment strategy for many local communities and livestock predation was thus a direct threat to their livelihood and survival. Wildlife, on the other hand, was a collective good. Not every community member benefited and in conjunction with poverty and hunger, this aggravated human–wildlife conflict. Communities, who indicated that they benefited very little, were mainly respondents who did not belong to a conservancy. Most respondents who indicated that they “strongly benefited” from wildlife also indicated that they “strongly valued” wildlife (p = 0.011, N = 61, Value = 21.346, df = 9). Respondents who indicated that they ‘benefit very little’ reported increases in human–wildlife conflict, while 56% of respondents who ‘strongly benefit’ perceived decreasing conflicts (p = 0.011, N = 61, Value = 16.675, df = 6).
All expert interview partners stated that wildlife numbers had increased considerably inside and outside of protected areas over the past years, although considerable numbers were poached. The increasing wildlife numbers reflect the success of the community based natural resource management (CBNRM) programme. This was confirmed by community members: When asked about ecological changes taking place in the region, 68.6% of survey respondents indicated that more wildlife was coming into the area in which they lived. This was especially the case for the Balyerwa, Bamunu, Dzoti, Sobbe and Wuparo conservancies. Groups of a particular species were increasing, according to 57.8% of respondents (17.8% no changes, 24.4% decrease) and species, that had not been in the area before were now coming to the area (56.1%).
According to experts, population density in the Namibian component of the KAZA region is high compared to the rest of the country and more people are moving into the area. Agricultural activities increase with the influx of people. Livestock is often mismanaged spurring further conflict, due to a lack of protective measures especially in an open system without fences. Generally, natural resources are becoming more important for the economy every year and wildlife, through tourism, has become one of the main contributors to the Namibian economy. Wildlife-based activities have a competitive advantage over other land-use activities, since they are better adapted to the (semi-) arid conditions. Community survey results suggest a significant association (p = 0.002, N = 37, Value = 17.146, df = 4) between changes in household income and changes in tourism. Cross-tabulation also confirms that income increased as tourism increased. The importance was likely to increase with the expected impact of climate change.
All interviewed experts were convinced that increasing wildlife and human populations are the main reason for an increase in human-wildlife conflict. However, most (55.1%) of surveyed community members associated increasing human–wildlife conflict with the presence of poachers followed by increasing wildlife populations (46.9%), increasing human populations (22.4%) and water scarcity (18.4%). Thirty of 34 survey respondents (88%) who claimed that poaching increased also reported increases in human–wildlife conflict. Eighteen of 27 (66%) respondents who claimed that poaching decreased reported decreases in human–wildlife conflict (p = 0.000, N = 65, Value = 31.018, df = 4).
According to the interviewed experts, once successfully implemented, the KAZA TFCA could improve the movement of wildlife. Furthermore, connectivity could positively support ecosystem functioning and enhance biodiversity. Communities agreed and believed that the KAZA TFCA would be “very successful” in conserving biodiversity (52.8%), conserving cultural heritage (41.5%), creating a network of interlinking protected areas (52.1%), becoming a prime tourism destination (51.2%) as well as reducing poverty (46.7%). Almost one-third (27.3%) of survey respondents appreciated the concept because it aims to create space for the free movement of wildlife and 20% hoped that KAZA would build capacity in natural resource management, to achieve a more sustainable coexistence of humans and wildlife. Experts suggest that by securing corridors wildlife from areas with very high wildlife densities could disperse into less crowded areas. This would reduce pressure on the land and natural resources and minimise interaction and conflict with people living in areas with high wildlife density. On the other hand, an open and connected system could encourage poaching. In addition, due to the increased movement of wildlife, Namibia could become a wildlife transit route and human–wildlife conflict could increase.
To successfully encourage the dispersal of wildlife across the member countries the conditions within the countries need to be the same. Common ground on veterinary diseases and fences have to be found. In some areas, fences protect wildlife from the invasion of cattle. Social problems would also have to be addressed more seriously to make the concept successful. In addition, ways to control illegal settlement and disease outbreaks have to be found as they spread faster over open borders. Bottom-up planning, awareness campaigns, capacity building and programmes targeting poverty and livelihood enhancement are required to change the attitude of people towards wildlife and the KAZA TFCA. Activities need to be communicated to local communities, so they could see the direct and indirect benefits, e.g. the construction of schools and clinics. This needs to go hand-in-hand with increasing benefits from tourism and hunting and employment opportunities. Local communities should be provided with alternatives to agriculture. Above all, for the KAZA TFCA to become successful, political stability in the region is required and joint strategies to control wildlife and forest crime have to be implemented. Poaching in the region was a transboundary issue and facilitated by open borders, different policies and legislation of the individual countries.
Source: Ecology - nature.com


