Study overview
An overview of the technical variations associated with the three important stages of metagenomic nucleic acid extraction workflows such as sample homogenization (H), lysis protocol (L) and DNA purification (P) techniques is shown in Fig. 1. A detailed assemblage of the different metagenomic isolation methods including important technical variables is shown in Supplementary Fig. S1. Supplementary Table S1 indicates the standard methods (S1-S16) of metagenome DNA purifications that were used in the present study.
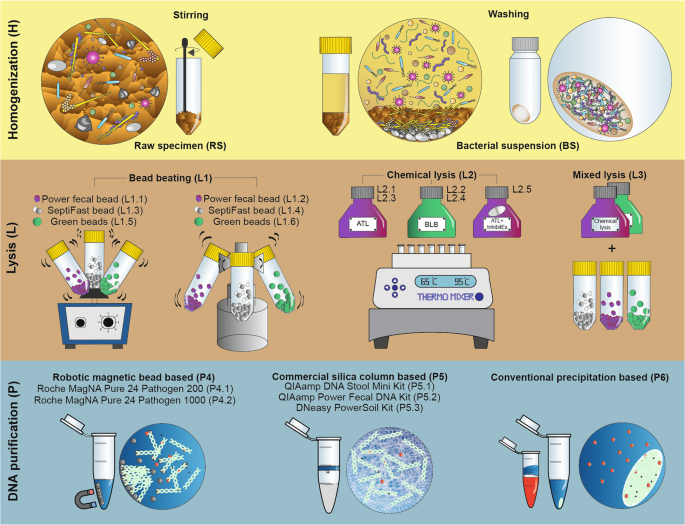
Detailed delineation of the different stages of metagenome DNA extraction approaches involving sample homogenization (H), lysis protocols (L), DNA purification methods (P). Direct lysis of the biologically diverse faces (raw specimen: RS) has the power to get access to both planktonic and sessile cells. Processing bacterial suspension: BS obtained by multiple washing steps free-floating bacteria can be separated from the indigestible compounds of the feces and manure particles. To compare the efficiency of lysis methods in disintegrating Gram-positive and Gram-negative cell boundaries, bead mill (L1), chemical cell disruption (L2) based techniques and the mixture of those (L3) were performed. To separate nucleic acids from sample lysates robotic magnetic bead (P4), manual silica column (P5) based commercial and manual nucleic acid precipitation based conventional (P6) techniques were used.
General description of sequencing results
16S rRNA gene based (V3-V4 region) amplicon sequencing was carried out on Illumina MiSeq platform generating a total of 13.257.362 reads with the mean read count of 138.097 ± 31.408 (mean ± SD) reads per sample in a range of 77.997–382.901 reads. Quality filtering with the dada2 software resulted an average denoised read count of 70.987 ± 17.676 per sample and after the merging process the read count dropped to an average of 63395 ± 16586 reads per sample. At the end, the average of non-chimeric reads was 45748 ± 11107 per sample.
DNA yield, quality, sequencing metrics and biodiversity
Several DNA extraction protocols have been tested for fecal microbiota community profiling. In 16.6% of the purified samples PCR amplification was inhibited. Importantly, in 87.5% (14 of 16) of these samples the phenol-chlorophorm method was applied (Fig. 2a). No apparent correlation was observed between DNA concentrations and the number of amplicon sequence variants (ASVs), whereas data rankings showed an obvious proportionality between the ASV numbers and the Shannon’s diversity indexes (Fig. 2b, Table S2). Based on these results, MagNa Pure 24 – Pathogen 200 Protocol seems to be an ideal choice to extract community DNA from bacterial suspensions and achieve high resolution of community composition with rare taxa.
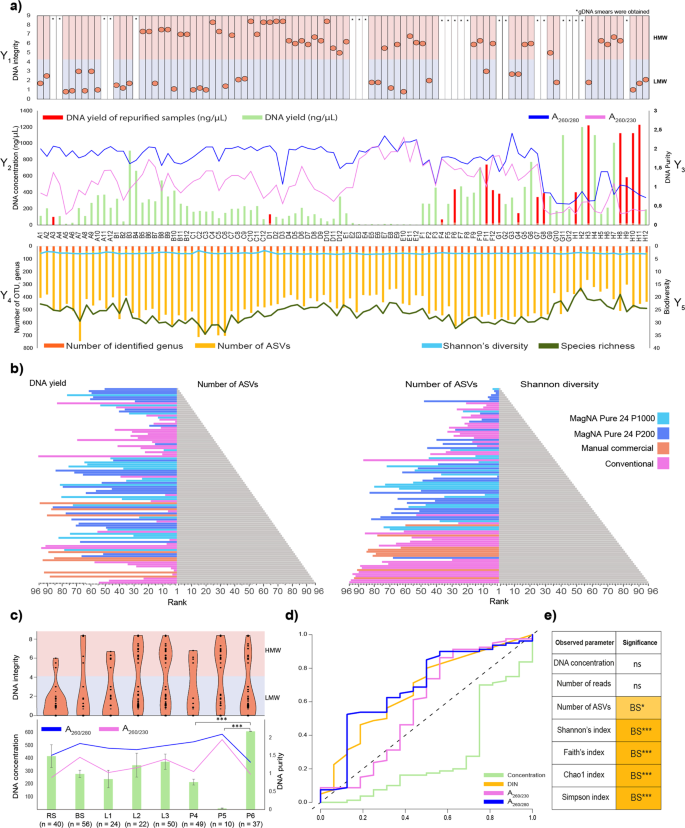
The effect of DNA yield and quality on downstream sequencing and observed community diversity. (a) On the Y1 axis of the DNA integrity (DIN) data are displayed for every sample elutes (A1-H12) sequestering high molecular weight (HMW) and low molecular weight (LMW) samples. Display of genomic DNA integrity (DIN) was done automatically by the TapeStation Analysis Software on the basis of the electropherogram intensity of the samples. Y2 axis represents total DNA yields (ng/µl). Total DNA extraction yields presented in ng/µl (bar-charts) of DNA per sample. Y3 axis shows the respective absorbance ratios A260/A280 and A260/A230 (line charts). Y4 axis presents sequencing metrics (number of identified genus, number of ASV). Y5 axis displays post-sequencing ecological inferences (Shannon’s diversity and species richness). (b) Pyramid plots display the results of rankings of every single method considering DNA yield in relation with the number of ASVs and obtained Shannon’s diversity indices. (c) Reports of DNA concentration and quality metrics from the point of view of the technical influential variables. Data shown are mean values with standard deviations. Violin plots represent the distribution of HMW vs. LMW DNA bands. (d) ROC represents the influence of extraction efficiency and suitability of the isolated nucleic acids quantities in downstream library preparation. (e) Significant differences observed in parameters between sample homogenizations. Asterisks report statistical significance; *P ≤ 0.05, **P ≤ 0.01, ***P ≤ 0.001, while “ns” stands for non-significance.
Sample homogenization and DNA purification have significant influence on DNA yield
The effects of sample homogenization, bacterial cell lysis and DNA purification methods on DNA concentrations are shown in Fig. 2c. For all tested parameters, the average concentration, quality and integrity of purified DNA were established. The highest DNA concentrations were obtained by feces homogenization by stirring (RS). In the case of RS, an average of ~1.5-fold increase in DNA yield was observed in comparison to bacterial cell suspensions (BS). Mixed lysis proved to be more effective than bead-beating resulting in ~1.57-times higher amount of nucleic acids. Conventional DNA precipitation methods resulted in the highest DNA yield (P < 0.0001) compared to the magnetic bead-based (3-fold increase) and silica column based (56-fold increase) methods. However, poor DNA quality (A260/A230 1.3 ± 0.55) was observed in the majority of samples. The MagNa Pure 24 robotic platform managed to extract a large amount of good quality DNA, as indicated by optimal A260/A280 1.8 ± 0.21–1.89 ± 0.2 absorbance ratios. The Qiagen kits were also able to generate acceptable values in the range of 1.8–2.2. No correlation was found between the fragmentation status of the metagenomic DNA (i.e. high molecular weight – HMW (DIN ≥ 4.5) versus fragmented low molecular weight – LMW (DIN < 4.5)) and yield or purity.
The quantity and integrity of extracted nucleic acids have no effect on library preparation
Receiver-operating characteristic (ROC) analysis was performed with the outcome of amplicon PCR (succeeded, not succeeded) as the binary classifier. Area under the curve (AUC) values with 95% confidence intervals (95% CIs) and standard deviation (±SD) were calculated (Fig. 2d). Interestingly, absorbance ratios and shearing were associated with 2.4-times higher AUCs (mean AUC 0.64 ± 0.0822) than DNA concentration. For DNA concentration, the AUC was = 0.2746 (95% CI 0.1213–0.4280; P value of <0.004 ± 2.88), and for A260/A280 and A260/A230 absorbance ratios the AUCs were = 0.6910 (95% CI 0.5388–0.8432; P value of <0.013 ± 2.46) and 0.5820 (95% CI 0.3966–0.7674; P value of < 0.386 ± 0.86), respectively. DNA integrity (DIN) AUC was 0.6719 (95% CI 0.5244–0.8194; P value of <0.024 ± 2.28). From our data we conclude, that DNA purity has the strongest predictive power on successful amplicon PCR. Intriguingly, the lowest correlation was observed between the DNA concentration and successful downstream PCR amplification.
Bacterial cell suspensions had a prosperous effect on the community diversity
Sample homogenization through the preparation of bacterial suspensions significantly improved the assessment of community diversity (Fig. 2e). These results are in line with our previous observations that pure DNA samples are conducive in obtaining diverse communities.
Standard protocols strongly affect sequencing metrics and observed biodiversity
We evaluated the impact of 16 standard metagenome DNA isolation protocols [S1-S8 (RS), S9-S16 (BS)] on sequencing metrics (Supplementary Table S1). S1, S9, S2, S10 designate MagNa Pure 24 robotic methods, S3-S5, S11-S13 represent Qiagen kit-based manual methods, and S6-S8, S14-S16 denote conventional, phenol-chlorophorm DNA purification methods. Number of reads, non-chimeric reads, ASVs and community diversity metrics; Faith’s PD, Chao1 index, Shannon’s diversity indices, Simpson’s evenness are shown in Fig. 3. Conventional approaches coupled with BS consistently resulted in the highest community diversity especially when applying chemical (S15) or mixed (S16) lysis. Regarding the RS samples, S7 surprisingly performed the worst, whereas the highest biodiversity was achieved by S1, which at the same time generated the lowest read counts. This paradox was also observable in the case of S16 providing the second highest biodiversity and the lowest read counts. In the case of the BS samples, conventional DNA extraction approaches and the MagNa Pure 24 method with Pathogen 200 protocol resulted in high diversity estimates, while the commercial QIAmp kits S11, S12 recovered the least diverse communities. The Qiagen DNeasy Power Soil Kit produced similar diversities regardless of the sample homogenization method.
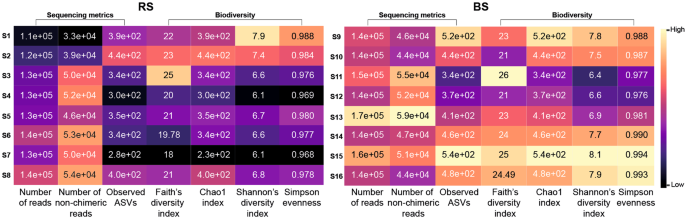
Overall performance of the concomitant batch-effects of 16 stool community DNA isolation approaches. S1-S16 designate metagenomic DNA isolation methodologies performed on raw specimens homogenized with stirring (RS) or washing to obtain bacterial cell suspensions (BS). Comparison of the sequencing and biodiversity metrics of the standard metagenome DNA purification methods. (S1, S9): MagNa Pure 24 Pathogen 200 protocol, (S2, S10): MagNa Pure 24 Pathogen 1000 protocol, (S3, S11): QIAamp DNA Stool Mini kit, (S4, S12): QIAmp Power Fecal kit, (S5, S13): Qiagen DNeasy Power Soil kit performing according to the manufacturer’s instructions. Performance of the conventional DNA isolation was also investigated coupled with different lysis protocols (S6, S14-bead-beating; S7, S15-chemical lysis; S8, S16-mixed lysis).
Violating variations in overall taxonomic profiles
The effects of sample homogenization (RS vs. BS) standard metagenome isolation approaches (S1-S8 vs. S9-S16) on observed community composition are shown in Fig. 4. Differences of normalized abundance data were attained by considering 8 phyla, 15 classes, 29 orders, 47 families, 72 genera and 22 species. Graphical representations were done by calculating the log2 differences in taxa abundances between RS – BS linked metagenome isolation approaches. Taxa with relative abundances lower than 1% were discarded from the analysis. Remarkably different taxonomic profiles were obtained when comparisons were made between subsets of RS vs. BS samples. This may be due in part to elevated concentrations of PCR inhibitors and nucleases in samples obtained from raw specimens compared to bacterial suspensions.
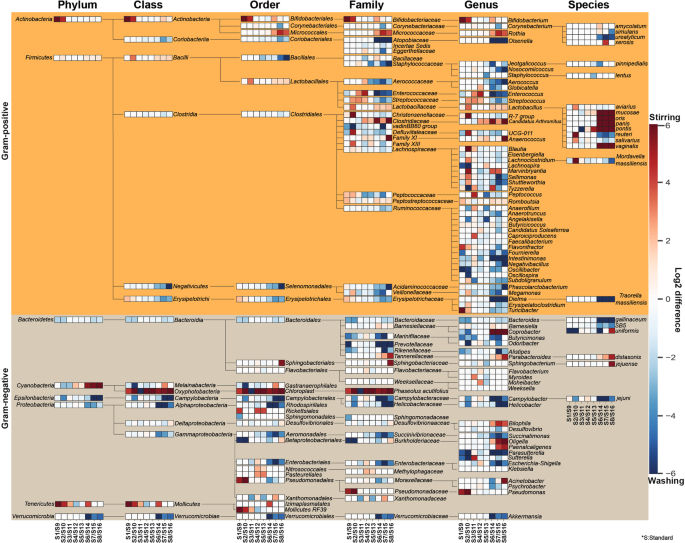
Remarkable abundance variations were observed in community structures. Composite heat map was created to pronounce the distortions in taxonomic profiles on the basis of normalized abundance data associated to eight standard metagenome DNA isolation methods for comparison of the impact of two different sample homogenization strategies (RS vs. BS). Extents of differences are illustrated on the composite heat-map with gradient colors where red scale represents dominance of taxa owed to processing raw specimens homogenized due to stirring; log2(RS/BS) >0 whereas blue scale represents the overrepresentation of taxa associated to bacterial suspensions; log2(RS/BS) <0. Significant shifts in abundances of the 143 taxa affected by the batch-effects can be observed.
Impact of batch-effects on beta-diversities
Principal coordinate analysis (PCoA) resulted in five cluster groups (cluster1 – cluster5) with different spatial ordinations. Different profiles were delineated in the case of BS (cluster1, 2, 3) in comparison to RS (cluster4, 5) samples (Fig. 5a). Dissimilarities in community compositions largely arise from the depletion of residents of sessile biofilm communities associated with solid organic particles in feces. In general, lysis protocols had no profound impact on the β-diversity profiles (Fig. 5b), except for MagNa Pure 24-based applications, where bead-beating based (cluster1) vs. mixed lysis techniques (cluster2, 4) showed a strong influence on differences in community compositions (Fig. 5b,c). Cluster3 displays a strong correlation between bacterial suspensions and DNA precipitation methods indicating a very high consistency. The choice of sample homogenization was not relevant in the case of silica membrane-based methods – P5 (Fig. 5a,c). Samples corresponding the robotic MagNa Pure 24 method were split into two subclasses with regards to sample homogenization (cluster1, 2 vs. cluster4), from which cluster2 exclusively represents bacterial suspensions where DNA was isolated with the Pathogen 200 protocol (Fig. 5c). Our observations based on PCoA plots were statistically strengthened by computing distance-based dissimilarity matrices to unravel protocol effects with significant influence on overall community variations (Fig. 5d). Bar lengths indicate within group compositional differences while between sample distances were calculated on the basis of quantitative (Bray-Curtis, weighted UniFrac) and qualitative (Jacquard, unweighted UniFrac) dissimilarity-based statistics.
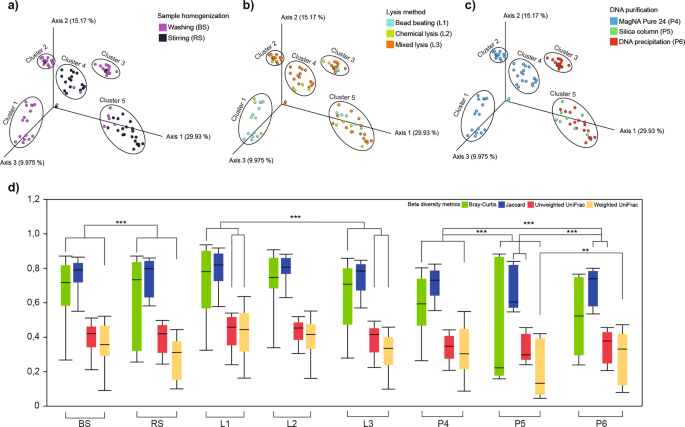
β-diversity distributions summarize the differences provoked by batch-effects related to metagenome DNA purification protocol variables. The summarization of the beta-diversity relationships is represented in three-dimensional scatter plots. Three principal coordinates plotted against each other summarizing the compositional differences among samples due to (a) sample homogenization (b) bacterial lysis (c) DNA purification. (d) Whisker plots represent the interquartile ranges (IQR) with min/maximum values and the median. Outlier values outside 1.5 times the interquartile range are omitted for clarity.
Detailed evaluation of the bacterial cell lysis protocols on DNA yield, purity and community diversity
We compared bead mill based and chemical lysis methods and estimated their effects on DNA yield, purity, downstream PCR amplification and biodiversity. Alterations in mechanical lysis techniques did not produce statistically significant differences (Fig. 6a). A remarkable gain in DNA amount was observed when samples were lysed by bead mills (326 ± 110 ng/µl) relative to chemical lysis (101 ± 148 ng/µl). To achieve chemical lysis, ATL, BLB buffers and the inhibitor absorbent InhibitEX Tablet were used (Fig. 6b). We found a significant positive association between the application of the ATL buffer and the DNA purification efficiency. Pretreatment with InhibitEX Tablet resulted in purified nucleic acids with reasonably good quality showing an overall positive effect on the purity and success rate of downstream PCR reactions, while exerting a detrimental effect on DNA yield. One can assume that nucleic acids prone to adsorb to the particles may be eliminated by the centrifugation step. Stool samples subjected to InhibitEX Tablet showed significantly lower Shannon’s diversity indexes, which may be associated with bacterial DNA loss. The use of both ATL and BLB buffers resulted in high quality and, yield of DNA. Strong positive correlation was observed between Shannon’s diversity and the application of the BLB and ATL.
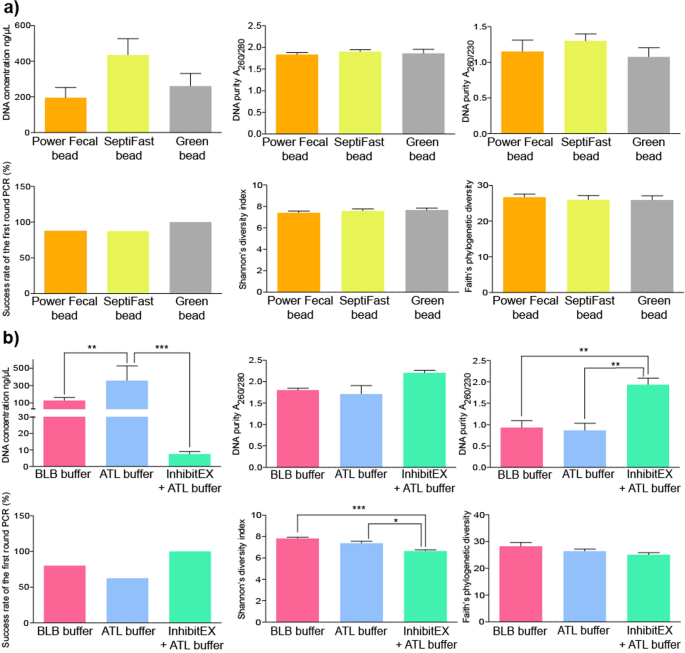
Comparison the effects of sample lysis. Bar charts displaying the effects of sample lysis on DNA yield (ng/ul), purity, downstream PCR amplification, estimated alpha diversity (Shannon’s index, ChaoI index, Faith’s PD) provoked by different (a) mechanical bead-mill based and (b) chemical lysis protocols.
Significant shifts in Gram-profiles
Significant distortions were detected in the Gram-positive and Gram-negative distribution profiles due to sample homogenization strategies (Fig. 7a,b). Interestingly, homogenization of feces due to stirring (RS) represented constant Gram ratios (17% Gram-negative vs. 83% Gram-positive) irrespective of sample lysis. In the case of raw specimens, mild distortions were seen between the MagNa Pure 24 – P4 robotic and the conventional phenol-chlorophorm method – P6 (Gram-positive 86% vs. 83%, Gram-negative 14% vs. 16%), while profound alterations were introduced due to silica column methods – P5 (Gram-positive 71%, Gram-negative 29%). In the case of bacterial suspensions, diverse results were obtained. Bead mill-based mechanical lysis resulted in highly balanced Gram-positive (52%) vs. Gram-negative (48%) ratios. The choice of sample homogenization exerted the least profound effect on the Gram-distributions of stool bacteria when DNA was recovered with silica column-based methods (Gram-negative: 29% vs. 33% vs. Gram-positive: 71% vs. 67%).
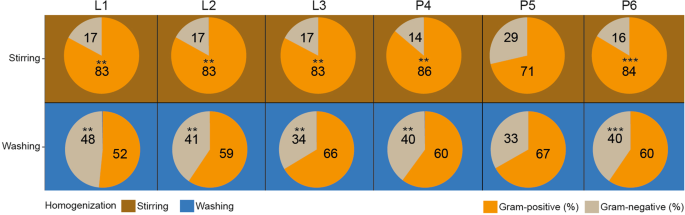
Profound sample homogenization mediated impact on Gram-distributions. (a) The aggregate effects of sample homogenizations joint to lysis protocols and DNA purification methods were estimated. (b) In the case of the different batch-effects Gram-positive and Gram-negative abundance comparisons were made between samples homogenized with stirring and washing. Asterisks report statistical significance; **P ≤ 0.01, ***P ≤ 0.001, while “ns” stands for non-significance.
Distortions in the core microbiota
To assess the effects of technical variables, core microbiomes were constructed by considering taxa represented in at least 50% of all sample aliquots. Complex comparisons in core bacteria distributions were made on all taxonomic ranks except species (Fig. 8). Different methods of sample homogenization resulted in pronounced differences in core microbiota abundances. Although the majority of the core microbiota fall into a limited number of phyla and classes, their relative proportions showed remarkable alterations (Fig. 8a). Four phyla (Bacteroidetes, Firmicutes, Tenericutes, Proteobacteria) and four classes (Bacilli, Bacteroidia, Clostridia, Gammaproteobacteria) displayed large differences in relative abundance. Fold changes of log2 abundance ratios (RS/BS) were used to estimate over- and under- representations of taxa (Fig. 8b). Homogenization by stirring resulted in increased Gram-positive members of the phyla Firmicutes (RS: 81.4% vs. BS: 60%), whereas bacterial suspensions provided higher abundance values for the Gram-negative Bacteroidetes, Proteobacteria and Epsilonproteobacteria (28.68% vs. 12.62%, 6.57%, vs. 3.06%, 1.9% vs. 0.69%) (Supplementary Table S3). On both taxonomic ranks the shortest box lengths were obtained with the Qiagen Kit based DNA separation methods (P5) indicating the highest concordance attained. Negligible alterations in abundance were observed for Actinobacteria (RS: 1.14% vs. BS: 1%), Cyanobacteria (RS: 0.54% vs. BS: 0.56%), and Tenericutes (RS: 0.2% vs. BS: 0.16%). In contrast, bacterial suspension favors Verrucomicrobia in conjunction with mixed lysis (BS: 1.27% vs. RS: 0.18%) or the phenol-chlorophorm method (BS: 2.62% vs. RS: 0.3%). More complex effects were observed on the class level. Homogenization by stirring resulted in increased representation of the major class Bacilli (RS: 56%) relative to bacterial suspensions (BS: 25.54%), but the latter favors prominent classes such as Clostridia (32.12% vs. 23.43%), Bacteroidia (28.68% vs. 12.62%) and Gammaproteobacteria (5.78% vs. 2.41%). Our results also demonstrate that commercial, silica column-based DNA isolation platforms introduce the least amount of variation in core community profiles.
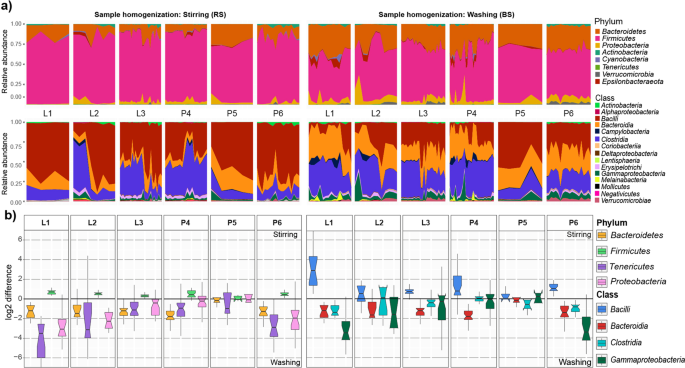
Complex representation/delineation of the dependence of the distribution of the core bacteria of broiler (Gallus gallus domesticus) according to different batch-effects of metagenome DNA extraction protocols. Distortions in the observed relative abundances on phylum and class level are shown. (a) Area plots show the relative abundance variations of the protocol variations in the 50% core microbiota compositions in relation to sample homogenization strategies. (b) Estimated log2 values of the proportions (stirring-RS/washing-BS) of abundance values associated with protocol batch-effects of dedicated phyla and classes showing clear distortions. The horizontal line is plotted at a value of 0 corresponding to equal proportions of values associated to differences in sample homogenizations. Box lengths indicate within sample variations.
Technical artifacts and in silico taxonomic classification influence the proportion of quality reads and species resolution
In addition to DNA extraction methods, technical aspects of in silico bioinformatic analyses also contribute to biases. We performed a comparison of metabarcoding analyses by using two sequencing databases; GreenGenes (GG) and Silva (S). At the phylum, class and order taxonomic levels, more than 99% of the reads have been successfully classified irrespective of the reference datasets. On average, Silva was able to rank more reads 97.95 ± 2.03% at the family level in comparison to GreenGenes (90.28 ± 2.84%) (Supplementary Table S4). The difference was more pronounced at the genus level (S: 95.99 ± 1.42 vs. GG: 78.86 ± 5.8%). As shown in Fig. 9a, the choice of sample processing (BS vs. RS) did not have a significant effect on the proportion of ranked reads (family: 98.91 ± 1.19%, genus: 97.05 ± 2.95) of the two taxonomic ranks. With Silva, the choice of metagenomic DNA purification method did not affect ranked at the family and genus levels significantly (94.67 ± 5.33%). Remarkable differences were observed between species ranking capacity of the two databases. On average, 87.12 ± 3.86% of the species were not traced by Silva, whereas GreenGenes was able to identify 51.74 ± 8.22% of the reads. The higher proportions of ranked reads at the species level showed no correlation with the number of the identified species (Fig. 9b). Silva and GG were able to identify a total of 87 species, but only 13 were identified by both databases. In 85.05% of the cases S and GG identified different species. Figure 9c represents the 30 most abundant species, of which only 4 species (Lactobacillus vaginalis, Lactobacillus salivarius, Lactobacillus pontis, Bacteroides uniformis) were detected by both S and GG. In these 4 cases, similar abundance values were calculated with the two databases. The use of GG led to significantly higher abundance estimates for Streptococcus alactolyticus, Lactobacillus helveticus, Faecalibacterium prausnitzii, Escherichia coli, Barnesiella viscericola and Alistipes finegoldi.
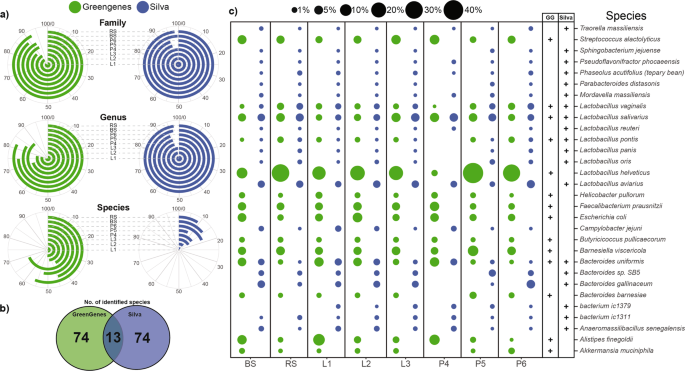
Dependence of the proportion of the classified reads across family and genus levels and remarkable ambiguity in the species resolution. (a) Polar plots show the percentages of the identified reads at family (L5), genus (L6) and species (L7) taxonomic levels bound to protocol manipulations. Angles of the radial coordinate systems represent the percentages of identified reads at dedicated taxonomic ranks. Increasing percentages are ordered in clockwise orientation. (b) Bubble charts are shortlisting the relative frequencies of the 30 most abundant species representing the species mining power of the Silva and GreenGenes annotation tools.
Community taxonomy compositions suffer from biases of different kinds
We quantified the cumulative effects of protocol variables sample processing (H; homogenization), lysis (L) and DNA purification (P) by assessing alpha-diversity distributions (Fig. 10a). Chemical lysis (L2) combined with MagNA 24 Nucleic Acid Purification (P4) and conventional precipitation-based techniques (P6) followed by bead-beating (L1) proved to be relatively robust to sample processing (BS vs. RS), but chemical lysis (L2) coupled with conventional precipitation-based methods (P6) was highly sensitive to different of homogenization.
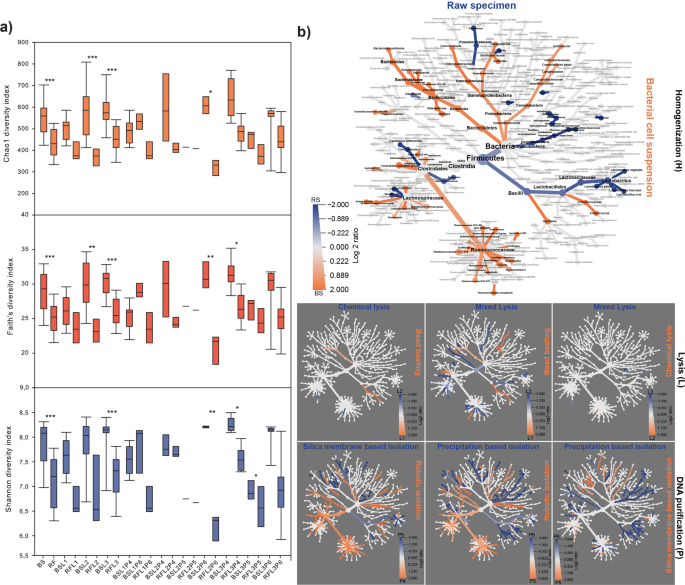
Quantitative and qualitative representation of the protocol batch-effects on community diversity and the taxonomic classifications. (a) Alpha-diversity distributions summarize the related to metagenome DNA purification protocol variables. Whisker plots represent the interquartile ranges (IQR) with min/maximum values with significance (*P ≤ 0.05, **P ≤ 0.01, ***P ≤ 0.001) and the median. (b) To unravel significant distortions a composite figure with seven community heat trees was made to represent the effects of correlated parameters of sample processing (H), lysis (L) and DNA purification (P) on community taxonomy. The annotated tree functions as a key for the unlabeled trees. Colored taxons represents the extents of log2 differences in taxa abundances. For instance, the annotated tree on the left allows a quantitative representation of diversity distortions by correlating the parameters of sample pre-processing (RS vs. BS) where taxa colored blue is enriched in RS samples shown in the column and those colored orange are enriched in BS shown in the row.
To address the aggregate effects of technical variables on community taxonomy data heat trees were generated (Fig. 10b). Pairwise comparisons between parameters provide insights into the taxonomy shifts. To visualize differences between the massive data sets hierarchical structures of taxonomic classifications were developed, where the size of nodes and edges correlate with the abundance of clades. The taxonomic heat-trees reveal taxonomic lineages the detection of which may be challenging in the presence of a particular variable. Our analysis demonstrates, that the choice of sample preprocessing is of particular importance for the discrimination of lineages with relatively large nodes in orange (p_Bacteroidetes, p_Proteobacteria, c_Bacteroidia, c_Gammaproteobacteria, o_Bacteroidales, o_Enterobacteriales, f_Ruminococcaceae) and blue (p_Firmicutes, c_Bacilli, o_Lactobacillales, f_Lactobacillaceae, f_Lachnospiraceae). Grossly differences were observed between lineages from the aspect of the DNA preparation methods.
Source: Ecology - nature.com
