Study area
We selected historical nesting sites in Texas to examine disturbance caused by UAV surveys on a mix of colonial waterbird species. Due to variability in nesting strata among colonial nesters, we chose study sites in two distinct regions of Texas: coastal islands along the Gulf Coast and forested wetlands in the Trinity River Basin (Fig. 1). We utilized two colony sites on the Gulf Coast (Green Island and East Flat Spoil Island) and one colony site along the Trinity River (Josie Lake).
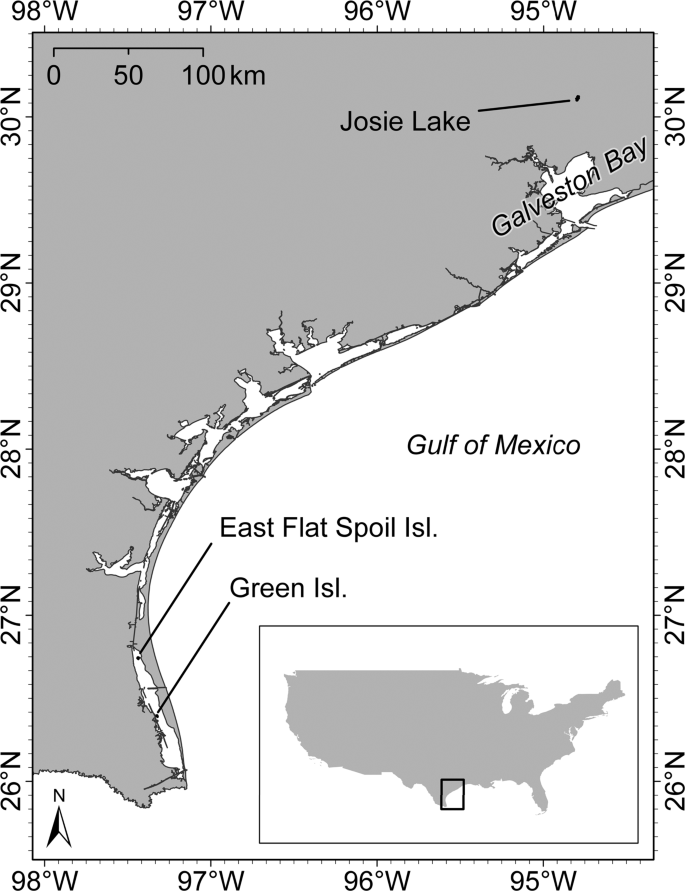
Colonial waterbird nesting sites that were surveyed with an unmanned aerial vehicle (UAV), Texas, USA.
Green Island is a 12-ha vegetated island situated in the lower Laguna Madre – a narrow hypersaline coastal lagoon that extends ~185 km from Corpus Christi Bay to the southern tip of Texas36. It is a large breeding site for Reddish Egrets (Egretta rufescens) and Roseate Spoonbills (Platelea ajaja) and is a stop-over site for neotropical migrants37. At Green Island, we observed a colony composed of six waterbird species (Table 1). East Flat Spoil Island, located just north of Green, is a 1.2-ha dredge-spoil island with a mix of low-lying vegetation and bare ground habitat. At East Flat Spoil, we observed a colony mostly comprised of five waterbird species. Josie Lake is situated in the lower Trinity River Basin, which has a humid subtropical climate and is predominantly forested38. Many waterbird species use Josie Lake to nest and forage, however at the time of our study we only observed four species at this site.
Surveys
We flew surveys horizontal to the ground in a back-and-forth transect pattern at a speed of 3–5 m/s, and did not approach birds from any other angle26,28. Strip transects allow for a series of overlapping photos to be captured, which can later be processed into a mosaicked, georeferenced orthophoto32. Since a georeferenced aerial photo is what managers would likely use to estimate the number of breeding pairs in a colony, we utilized methods beneficial for this type of data capture. Surveys were conducted with a consumer-grade quadcopter UAV (Phantom 3, DJI, Shenzhen, Guangdong, China) with procedures standardized across all survey missions. The UAV was deployed and brought to altitude roughly 250 m away from the edge of the nesting colony, which was confirmed with a laser range finder (Nikon Aculon IK-714141, Nikon Inc., Tokyo, Japan). The UAV was then flown in a series of sequentially decreasing survey heights of 122, 91, 61, and 46 m above ground level (AGL). We chose these survey heights because it was expected that within this range we could get optimal resolution of aerial photographs with the stock DJI camera (FC300X 1/2.3” CMOS, DJI, Shenzhen, Guangdong, China). Furthermore, an upper limit of 122 m was used due to local regulations prohibiting higher-altitude flights without federal authorization. Each survey was conducted immediately after the other, with the UAV taxied downward to the side of the colony. We conducted flights such that a single battery could be used across all survey transects. Thus, the area surveyed (~1 ha) did not vary greatly among colonies.
Research was conducted in accordance with guidelines, experimental protocols, and regulations of the Texas State University Institutional Animal Care and Use Committee (approved protocol #50). Per FAA regulations, a certified remote pilot operated the UAV below 400 ft. (~122 m) in non-restricted airspace and maintained line of sight during all flights.
Behavioural observations
Behavioural observations can be used to quantify an animal’s biological response to stimuli39,40. We placed video cameras at the periphery of each nesting colony to capture animal behaviour before, during, and after UAV overflights. At Green Island, we positioned cameras in an established bird blind. We placed cameras in areas with an open field of view and selected a random azimuth for adjusting position of the camera lens. If camera frame happened to fall outside of the nesting colony or within the same subset of birds that another camera was focused on, we selected a different azimuth. Camera setups were placed 50–100 m away from the colony because we assumed they would not interfere with the behaviour of nesting waterbirds. Set-back distances vary among waterbird species36, so all researchers retreated to ≥250 m away from the colony after video cameras were set to record. It was assumed investigators did not cause additional disturbance, since the farthest set-back distance found in the literature was 178 m for Black Skimmers41. We waited ≥20 min following video camera setup to commence surveys, which we assumed would allow birds to return to a baseline level of disturbance prior to UAV surveys. Time stamps on video recordings were synced to the watch of a field observer, who noted the time for each survey. Flight start and end times were delineated by the appearance of the nesting colony in the aircraft’s first-person view mode. Although not exact, this provided consistency for when the UAV was transecting the colony site. Horizontal distance of the UAV to sampled birds was not calculated, given the small and consistent size of surveyed areas.
We used scan sampling, an instantaneous behavioural observation of a group of animals, to capture their behaviour39. Since the coloniality of nesting waterbirds is known to have anti-predator advantages, it stands to reason that birds often react to nearby conspecifics or heterospecifics41. We chose four behavioural categories a priori to assess the extent of disturbance caused by UAV: vigilance, wing flapping, standing at or walking away from the nest, and escape behaviour (i.e., flight). For escape behaviour we tallied birds flying through camera frame as well as flushing from a nest. We reasoned that if UAV surveys caused more birds to initiate escape behaviour, there should be more birds flying within the camera frame during those sample periods. Some species were rarely seen during sample periods so were excluded from analysis (Table 1), and some individuals could not be positively identified to species due to distance from the camera, so they were pooled into two categories, tern spp. and heron spp. We assumed unidentified terns at East Flat Spoil to be a mix of Gull-billed Terns, Forster’s Terns (Sterna forsteri), and Sandwich Terns (Thalasseus sandvicencis) based on recent surveys.
One observer (J.R.B.) gathered data from video playback, to eliminate any variation that would arise among multiple observers. Video playback was observed without sound and without the aircraft in frame, so as not to bias observations when a flyover occurred (i.e., J.R.B. was not privy to the occurrence of a survey). Every minute, J.R.B. slowed down video playback to one-third speed, recorded the time, and tallied the behaviour and species of each bird in frame for a total of four seconds. This time period could then later be attributed to its respective treatment group for analysis. We chose a four second sample due to logistical constraints with analysing large groups of birds for extended periods of time. We thought of this time period as a sample of behavioural reactions. If a bird exhibited more than one behaviour during the sample period, the more severe behavioural reaction was recorded (e.g., if a bird was vigilant and then flew from the nest, “escape behaviour” was recorded). Tallies of behavioural reactions were pooled among cameras, since there were two to three cameras used per colony. Logistical constraints prevented us from using three cameras on certain colonies (i.e., vegetation obstructing view). Behavioural responses were assigned weights of 1–4 to differentiate between mild to severe reactions, ranging from vigilance to escape behaviour. Similar methods for indexing disturbance behaviours have been used in other studies13,26. We calculated an overall disturbance score with the equation:
$$frac{({V},times ,1),+,({W},times ,2),+,({O},times ,3),+,({E},times ,4)}{N}$$
(1)
where V, W, O, and E represent the tally of birds that displayed vigilance, wing flapping, off nest standing or walking, and escape behaviour, respectively. N represents the total number of individuals during the sample period.
Statistical analysis
All analyses were conducted in R 3.6.042. We included sample periods that spanned five minutes before and after UAV overflights, so the effect of AGL on colony behaviour could then be compared to a baseline level of disturbance. To test the hypotheses that overall disturbance and escape behaviour (i.e., flight) at the colony-level would not increase, we built and analysed mixed-effects models with R packages lme4 and nlme. These colony-level models were constructed using data in which species were pooled. We used linear models if model assumptions were met (i.e., homoscedasticity and normality), but if there was an indication of non-normality we used binomial generalized linear mixed-effects models with a logit link. Predictor variables included a categorical treatment variable (i.e., pre-flight control, 122 m, 91 m, 61 m, 46 m, and post-flight) and a count index of each colony. We chose to include count index as a predictor in the model because colony size may influence the disturbance to nesting birds41. The pre-flight control period was specified as a reference category to which the other levels could then be compared. Since a new cohort of birds were filmed after each overflight, we specified “flight mission” as a random grouping factor, within which we nested treatment. Treatment was included in the random term to avoid issues with pseudo replication.
We investigated the influence of species on both disturbance score and escape behaviour using a similar modelling approach. Using unpooled data, we built linear mixed-effects models that contained an interaction effect between species and treatment. We used sum-to-zero contrasts for the species variable. To ensure independent observations and a proper grouping of species, we nested species within treatment within flight mission as a random grouping factor.
Samples were taken over a temporal scale, so we tested for autocorrelation of residuals using a Ljung-Box test. If temporal autocorrelation was apparent in the model, we incorporated an AR(1) covariance structure using R package nlme. Each full model (i.e., with both random terms for intercept and slope) was tested against a reduced random intercept-only model by likelihood ratio test43. We calculated marginal and conditional R-square values to assess goodness-of-fit44. For linear and generalized linear models, we used restricted maximum likelihood and Laplace approximation for estimating model parameters, respectively. We established the cut-off for statistical significance (α = 0.033) using false discovery rate to correct for multiple comparisons45. Parametric bootstrapped 96.7% confidence intervals (N = 1,000 iterations) were used to test hypotheses of the fixed effects.
Source: Ecology - nature.com
