Effect of starvation
Food deprivation is often deemed to increase aggressive behaviour in various invertebrates and vertebrates21,22,23. When the food resources are sparse, individuals exhibit increased aggression in order to secure more food24. Previous published studies have shown that non-social Drosophila males are more aggressive compared to the non-social females4,6. Here the effect of food deprivation on aggression was examined under (a) non-starvation, (b) 2 h starvation and (c) 12 h starvation conditions. The aggression of non-social (single reared flies from the pupal stage) males D. suzukii, is quantified using the fighting latency within 3600 s (time taken to initiate fighting). As shown in Fig. 1a, the fighting latency decreased significantly (One-Way ANOVA, F(2, 72) = 12,261.6 p < 0.05) when flies were starved for 2 h. Interestingly, the effect of the long-term food deprivation (12 h) results in a significant increase of fighting latency compared to both 0 h and 2 h starvation phase. The latency for none and 2 h starvation was between 97 to 163 s and 62 to 76 s respectively, with a mean value of 141 ± 25 s (mean ± standard deviation, s.d) and 67 ± 19 s (mean ± s.d) respectively. On the other hand, the latency for 12 h starvation was between 328 to 499 s, with a mean value of 437 ± 87 s (mean ± s.d).
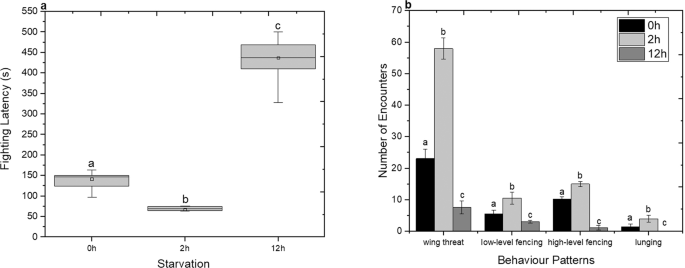
Effect of starvation on aggression of D. suzukii non-social males. (a) Aggression was quantified with the fighting latency. Grey columns indicate the median ± 25% area. The center line indicates the median value of data. The minimum and the maximum value represented by whiskers. Statistical difference was evaluated by One Way ANOVA Test and the significant level was at p < 0.05 (n = 25). Different letters indicate statistical differences. (b) Aggression was quantified with the frequency of behaviour, which is the number of encounters within 3600 s. Non-starvation in black bars, 2 h starvation in light grey bars and 12 h starvation in grey bars (mean ± s.d). Statistical difference was evaluated by One Way ANOVA Test and the significant level for both cases was at p < 0.05 (n = 25). Different letters indicates significant differences.
Subsequently the offensive actions of paired non-social males were studied as a function of food deprivation conditions by measuring the frequency of individual aggressive events25. Fig. 1b shows the frequency of encounters using wing threats, low or high level fences and lunges exhibited by non-social males that were either well fed or had been held in 2 h or 12 h starvation. Flies which had been held in 2 h of starvation exhibited more frequent aggressive events than those that had been held in 12 h starvation or those that were well fed (One-Way ANOVA wing threat: F(2, 72) = 2,891.17 p < 0.05; low-level fencing: F(2, 72) = 204.04 p < 0.05; high-level fencing: F(2, 72) = 116.16 p < 0.05; lunging: F(2, 72) = 230.99 p < 0.05). Specifically, long term food deprivation reduces the individual frequency of aggressive patterns. As such, this finding contradicts the initial assumption that the long term of food deprivation would lead to higher intensity of aggression.
Based on this observation, it was important to determine the effect of starvation on the locomotion. For this the locomotor effect of food deprivation in non-social males was evaluated using mobility assay26. A significant increase in locomotor activity between the 0 h and 2 h starvation phase was observed, followed by a significant decrease between the 2 h and 12 h starvation periods (One-Way ANOVA F(2, 9) = 50.7; p < 0.05) (Fig. 2). It is evident that the long-term starvation treatment reduces the locomotion which results in a reduction of aggressive behaviour. Changes on aggressive behaviour within starvation conditions were just as likely to be attributed to changes in locomotion.
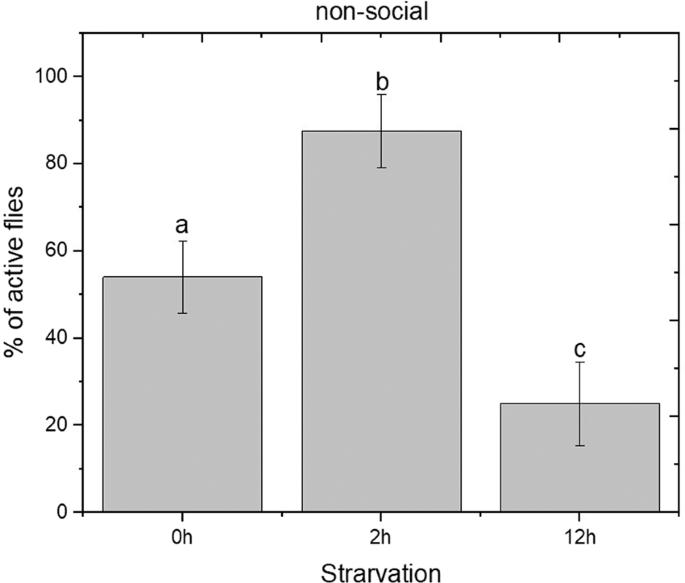
Effect of starvation in locomotion activity of D. suzukii non-social males. Activity was scored as the % of active flies within the 60 s. Statistical difference was evaluated One Way ANOVA Test and the significant level was at p < 0.05 (mean ± s.d) (n = 24). Different letters indicates significant differences.
Ethogram of Drosophila suzukii aggressive behaviour
Based on the aforementioned results, a 2 h starvation phase was applied to the rest of aggressive experiments. In an attempt to provide an entire determination of D. suzukii aggression, numerous fights between same sex pairs were performed and analyzed as shown in the ethogram of Table 1. In fact, the aggressive behaviour patterns were differentiated from the sex. A pair of females or males showed various types of aggressive behaviour in the observation chamber over the testing period (Fig. 3) (Supplementary, Video S1).
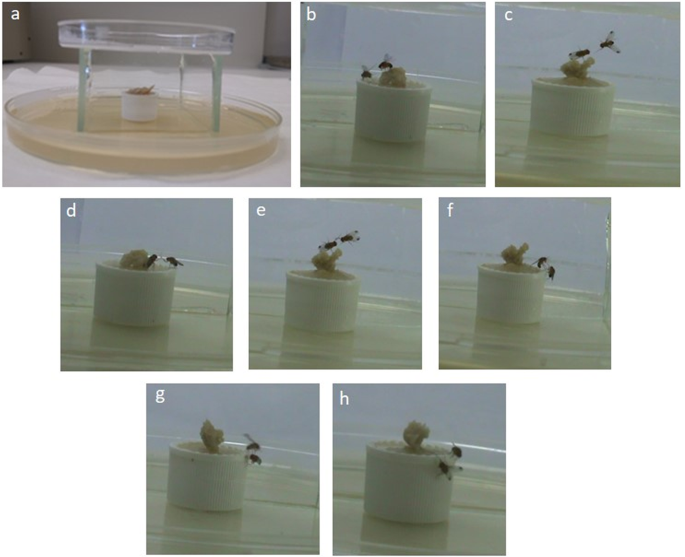
Photos taken by video analysis of non-social male D. suzukii aggression assay. (a) Experimental chamber. (b,c) Wing threat was observed from different optical angles. (d) Low-level fencing in which one fly extends his middle leg, and taps opponent’s leg. (e) High-level fencing in which both flies extend their forelegs simultaneously, (f) Lunging in which one fly rears up on its opposite legs and snaps down the opponent. (g) Flying attack in which male suddenly flies and attacks by thrusting its body over the opponent. (h) Defensive wing threat in which defender fly flicks its wing to a 45° angle.
Offensive actions are separated in two categories: a) that in which the flies do not come in contact and b) that in which they come in contact with other individuals. When a pair of flies is introduced into the observation chamber, they express an initial aggression using specific actions but without any physical contact. These actions include the wing threat which involves the raising of the wings at a 45°–90° angle erection for <1 s, and a tapping threat in which the flies extend their middle legs without touching the opponent. Wing threats were also observed when flies approach each other during all types of offensive actions. Soon after flies tend to approach and chase each other (slowly or fast). During the approach one fly lowered his body and moves to the direction of the opponent and in the chasing, one fly runs after the other.
One of the most frequent offensive actions within the contact category is the movement of leg extensions, which can be either low or high level fencing. In the case when one fly extends the middle leg there is a low level fencing while when both flies extended their forelegs simultaneously there is a high level fencing action. Another observed offensive action was lunging, in which a male reared up the front legs and snapped down the other fly. Moreover a flying attack was observed in which male that is expected to win suddenly flies and attacks by thrusting its body over the opponent. At the same time the aggression intensity of the males could initiate at a low level, and escalate during the male-male interaction, although in some cases a high level aggression can be observed from the initial stages. Usually offensive actions are followed by grooming behaviour. During the encounters it is observed that weak fly (looser) falls backwards from the food cup onto the agar surface. The observed defensive actions include walking, running or flying away either from the opponent or from the surface of the food cup, accompanied usually with a flicking wing action.
Most of the behaviour patterns were common between males and females but some of them were sex-specific. Wing threat, chasing, lunging, flying attack, fall and flying away are typical of male insects. Both sexes displayed low or high level fencing but the duration of such behaviour was not always the same. Such actions usually lasted for more than 3 s in males, but were always less than 3 s in females. Low level fencing while feeding and staring at each other showed to be specific to females. Most often females extended one leg and tapped the opponent (low-level fencing), and on rare occasions they face each other (high-level fencing). Females were not as aggressive as were males toward each other.
Environmental and social factors eliciting aggressive behaviour
The aggressive behaviour of many Drosophila species has shown to be affected both by social experience and environmental factors1. For this, aggression bioassays between same sex of D. suzukii flies are performed in order to establish how socialization influences the number and the kind of encounters. Bioassays were set up in such way as to study simultaneously the effect of age and the photophase. Six different fly ages (1d, 2d, 3d, 4d, 5d and 6d day old) were evaluated during five hours after the beginning of photophase (lights on at 07:00 am) of 12 h:12 h L:D (Light:Dark). Males that were up to 3-day-old regardless of social status and experiment control time exhibited low number of encounters compared to older males. Males that were 4-day-old performed the highest number of encounters (Fig. 4a for non-social males and 4b for social males). A decrease in the number of encounters was observed at the age of 5 and 6 days old. It was observed for example that at 09:00 am when males were 4-day-old of either social status, the number of encounters were higher than those exhibited by younger (1 and 2 days old) and older males (5 and 6 days old) (One-Way ANOVA, non-social: F(5, 114) = 13031.46, p < 0.05; social: F(5, 114) = 1154.01, p < 0.05). In addition, aggressive behaviour for all ages and for both social and non-social D. suzukii males varied during the course of the day. The time of experiment seems to have also a strong effect in aggression. During the first 2 h after the beginning of photophase (07:00 am and 08:00 am), the number of encounters of either age were low. After those hours the number of encounters reached a maximum value on 3rd hour (09:00 to 10:00 am), followed by a sharp decrease (One-Way ANOVA, non-social: F(4, 122) = 13960.82; p < 0.05, social: F(4, 122) = 1816.39, p < 0.05).
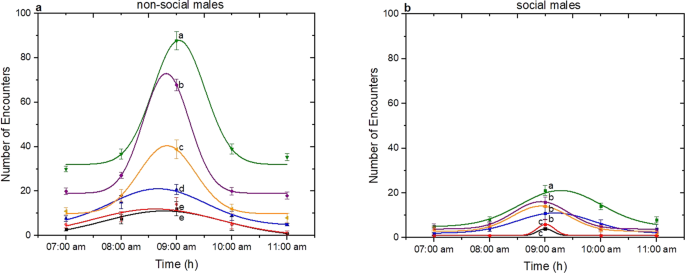
Effect of photophase and age on aggression of D. suzukii non-social and social males. Aggression was quantified as the sum of encounters’ number within 3600 s. For both social status six different fly ages (1d-black, 2d-red, 3d-blue, 4d-green, 5d-purpple and 6d-orange) were tested during five hours after the beginning of photophase (07:00 am to 11:00 am). Data were analyzed using Gaussian distribution and for a) non-social males 1d-R2 = 0.985, 2d-R2 = 0.923, 3d-R2 = 0.987, 4d-R2 = 0.962, 5d-R2 = 0.997, 6d-R2 = 0.971, and for b) social males 1d-R2 = 1, 2d-R2 = 1, 3d-R2 = 0.94564, 4d-R2 = 0.96358, 5d-R2 = 0.94307, 6d-R2 = 0.99298. Statistical difference was evaluated by One Way ANOVA Test and the significant level was at p < 0.05 (mean ± s.d) (n = 25). Different letters indicates significant differences.
The effect of photophase in aggressive behaviour was confirmed with the quantification of fighting latency for both social and non-social 4-day-old males. It is found that fighting latency was lower on 3rd hour after the beginning of photoperiod (09:00 am to 10:00 am) and was significantly different during the other times. This tendency was similar to both social and non-social males, as shown in Fig. 5 (One-Way ANOVA non-social males: F(4, 122) = 835.05; p < 0.05 social males: F(4, 122) = 419.43; p < 0.05).
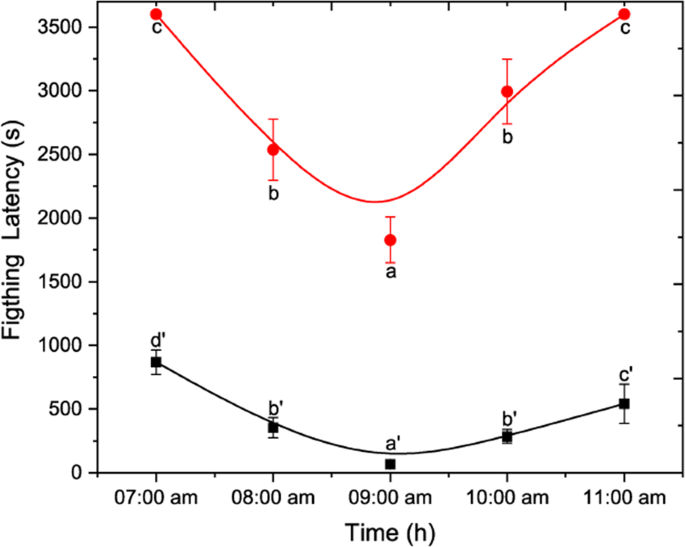
Effect of photophase on fighting latency of D. suzukii non-social and social males. Non-social in red line and social in black one. Statistical difference was evaluated by One Way ANOVA Test and the significant level was at p < 0.05 (mean ± s.d) (n = 25). Different letters indicates significant differences.
Results of behaviour pattern’s analysis between either of social status are presented as supplementary material, Fig. S1. It was observed a significant increase in offensive actions (expressed as number of encounters) for non-social males compared with social ones (independent samples T-test, wing: t(48) = 140.01 p < 0.05; low-level fencing t(48) = 58.76 p < 0.05; high-level fencing t(48) = 99.45 p < 0.05 and lunging t(48) = 30.75 p < 0.05). In fact, the two high intensity offensive actions such as high level fencing and lunging were performed only in non-social males.
In Drosophila species, male aggression has been characterized in detail but little is known about female aggression24. As such, factors of age and photoperiod were also studied in D. suzukii females. Our data indicates that social female flies do not exhibit offensive actions. Subsequent experiments, therefore, were only used using non-social female flies.
Age influenced both isolated females and males in similar way (One-Way ANOVA, non-social: F(5, 114) = 340.22; p < 0.05). Analysis of photophase’s factor indicates that non-social females showed the most aggressive behaviour on 3rd hour after the beginning of the photophase (09:00 am) as shown in Fig. 6a (One-Way ANOVA, F(4, 122) = 47.21; p < 0.05). This is also the case when the fighting latency trend of the 4-day-old non-social females was studied as shown in Fig. 6b. The earliest expression of aggression for non-social D. suzukii females was observed 3 h after the beginning of photophase at 2,160 ± 185 s (mean ± s.d). The fighting latency on five different hours of photophase was significantly different (One-Way ANOVA F(4, 122) = 258.75; p < 0.05).
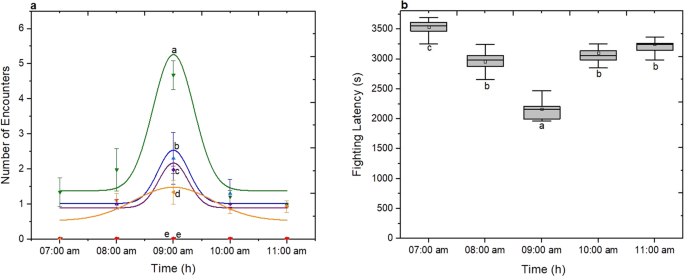
Effect of environmental factors on aggression of D. suzukii non-social females. (a) Aggression was quantified as the sum of encounters’ number within 3600 s. For both social status six different fly ages (1day-black, 2day-red, 3day-blue, 4day-green, 5day-purpple and 6day-orange) were tested during five hours after the beginning of photophase (07:00 am to 11:00 am). Data were analyzed using Gaussian distribution and for 3d-R2 = 0.945, 4d-R2 = 0.991, 5d-R2 = 0.897, 6d R2 = 0.932. The statistical difference was evaluated by One Way ANOVA Test and the significant level was at p < 0.05 (mean ± s.d) (n = 25). (b) Effect of photoperiod on fighting latency of D. suzukii non-social females. Grey columns indicate the median ± 25% area. The center line indicates the median value of data. The minimum and the maximum value represented by whiskers. Statistical difference was evaluated by One Way ANOVA Test and the significant level was at p < 0.05 (n = 25). Different letters indicates significant differences.
Finally, the fighting frequency is measured for both sex and both social status of D. suzukii as the percentage of pairs that show aggressive pattern during the observation period27. For non-social and social D. suzukii males, aggressive patterns were observed for 82 ± 2% and 49 ± 4% of pairs respectively, while for the non-social females this decreased to 23 ± 4% (mean ± s.d).
Locomotion activity
In order to relate the effect of environmental and social factors to the spontaneous locomotor activity of D. suzukii a mobility assay method was employed26. The activity of D. suzukii at six different ages (1d, 2d, 3d, 4d, 5d and 6d day old) in relation to sex, age and social status was measured during five different hours after the beginning of photophase (photoperiod;12 h:12 h L:D) from 07:00 am to 11:00 am. The activity was scored as the % of active flies within the 60 s observation period. As it is shown in Fig. 7(a,b) non-social males and females displayed the same level of locomotion activity independent of age and photophase (One-Way ANOVA non-social males: F(29, 90) = 0.55 p = 0.97; non-social females: F(29, 90) = 0.52 p = 0.98). The same trend is observed in the case of the social males and females D. suzukii as shown in supplementary material (Fig. S2a,b).
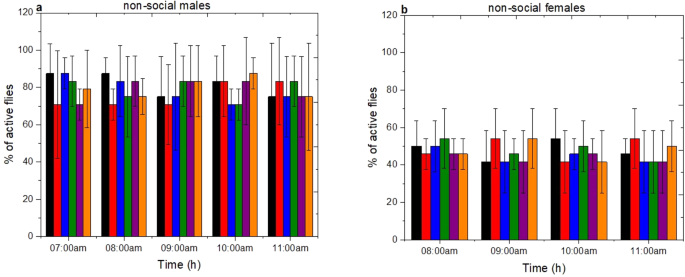
Locomotion activity of D. suzukii non-social males and females. Activity was scored as the % of active flies within the 60 s (mean ± s.d) (n = 24). The locomotion was tested for (a) non-social males and (b) non-social females in 6 different ages (1d-black, 2d-red, 3d-blue, 4d-green, 5d-purpple and 6d-orange) during five hours after the beginning of photophase (07:00 am to 11:00 am). There is little statistical difference p > 0.05.
Source: Ecology - nature.com


