The aim of the current study was to develop a novel method of assessing teleost spawning status that is robust to individual variation in oocyte dynamics and can be used at discrete sampling points during the spawning season. In order to do this, 72 G. morhua belonging to the Barents Sea cod stock were used as the test species to develop a new ranking system (ORC), that is based on progressive depletion of the VO pool. To understand and validate the new ultrametric classification system, ORC was considered in the context of finer scale ovarian dynamics, i.e. OSFD characteristics, including PVOs, and the occurrence of atresia and a spawning marker (POFs). ORC was also related to body condition and GSI, to determine whether these parameters changed as spawning progressed, i.e. ORC increased.
Separation, and subsequent quantification of the PVO fraction in whole mounts is required for the ultrametric method, in contrast to the corresponding quantification of only the VO + FOM fraction which is standard in modern laboratories (see Introduction). By using an optimised ultrasonication protocol, PVOs and larger oocytes were separated from the ovarian connective tissue in a way that did not cause oocyte damage. Ultrasonication has advantages over the use of Gilson’s fluid which has been used for oocyte separation in cod and other species, due to the tendency of Gilson’s fluid to create oocyte ‘tails’ that persist after cleaning, potential loss of atretic and post-ovulatory follicles, incompatibility with histological methods, and long soak time required to break down the connective tissue8,15,21. Rigthly so, an ultrasonic cleaning device has already been presented in the literature but was used for VOs rather than PVOs; the protocol in question includes a 40–80 min treatment in tap water22. So, the gentle use of the ultrasonic pen therefore opens up for a new era within this field of automated oocyte measurements as PVOs can now be quickly measured and assessed. This is particularly pertinent because evidence is mounting that PVO production is a key factor in understanding fecundity production and style23,24. Although our work aimed to properly define spawning status, the present findings also give prospects regarding PVO fecundity estimation (FPVO), i.e. number of PVOs in the whole ovary, which currently requires advanced stereology and/or mathematics (packing density theory) to be considered trustworthy24. However, refinement of the outlined methodology is likely required to further improve OR accuracy (see issues mentioned in the Methods). In the present context OR, estimated as OR = ∑PVO/∑(VO + FOM), successfully served the purpose to partition into the correct ORC. In pre-spawning fish this expression is reduced to OR = ∑PVO/∑VO. Hence, the corresponding FPVO can then be given as FPVO = OW × OR × OPDVO, where OW is whole ovary weight (g) and OPDVO is VO packing density (g−1), the latter found from the tight relationship with average VO diameter, using the autodiametric method12. Thus, we foresee many spin-offs of the present methodology in years to come.
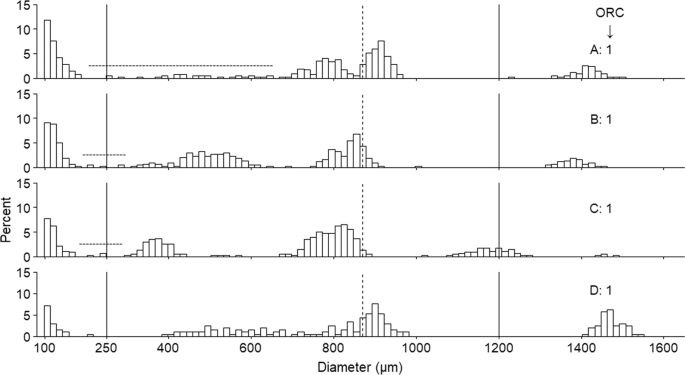
Following ultrasonication, quantification of the oocytes, and calculation of the OR, female fish were partitioned into one of four ORCs that adequately reflected the properties of their respective OSFDs. For example, as ORC increased and fish approached the end of spawning there was a transition towards a lower number of oocyte cohorts in the 250–1200 µm range which is reflective of VO depletion. The exception to this trend occurred for the only pre-spawning individual caught, which had a single oocyte cohort present in the 250–600 µm range. In this instance, the proportion of PVOs to cortical alveoli (CA) and early VO oocytes was small enough that this fish was correctly partitioned into ORC 1. The ultrametric method can therefore be used to stage fish that are yet to spawn, though in such instances multiple oocyte cohorts >250 µm should not be expected. To use this classification system earlier in the spawning season, further refinement of the OR ranges may be possible to enable differentiation between pre-spawning and early-spawning fish.
Multiple approaches have been adopted in the literature to track the progression of ovarian development over time in both indeterminate and determinate species but were not optimal for assessing reproductive development in this study. For example, when using the hiatus limit method10, placement of the hiatus boundaries would have been too subjective for ~15% of fish due to the presence of oocytes between the PVO and larger, more developed VO cohort. In addition, the autodiametric method relies on changes in the mean size, SD and skewness of the VO cohorts over a period of months to track oocyte development prior to oocyte hydration but also during the subsequent act of spawning, i.e. the stage of spawning method12,15. In the current study, we observed VO cohorts with a bimodal distribution (two VO cohorts with separate distributions) in just over 4% of the females analysed, and more than 20% of fish had OSFDs where oocytes were budding off/entering FOM, which in turn made the reliable calculation of VO mean, SD and skewness statistics far more complicated (cf. possibly varying threshold values between VOs and FOMs) for a large proportion of fish. While a previous study on G. morhua observed bimodal distributions in a few instances just prior to or during spawning, this phenomenon was unexpected and not addressed further at that time12. Thus, the ultrametric method circumvents the difficulties associated with the occurrence of ‘low frequency’ OSFD characteristics, i.e. oocyte tails, bimodal oocyte distributions, and the presence of oocytes in the hiatus region. This method can also be applied to ‘running’ fish due to the upper threshold of 1200 µm utilised when calculating OR, which eliminates bias that may be introduced by including free ovum (see Methods). So, although methods undoubtedly exist to reliably assess ovarian progression over a period of months prior to spawning, the present ultrametric method provides a clear advancement in these terms when analysing spawning ovaries, as it overcomes issues associated with traditional methods.
Atresia prevalence observed in the present work (8.3%) is relatively low compared to previous studies (e.g. 28% to 36% in Barents Sea and Baltic cod)25,26,27. Atretic follicles were mostly detected in early-spawning fish (ORC 1) as recently observed in eastern Baltic cod28. Fecundity down-regulation before spawning by atresia is a strategy commonly employed in determinate capital spawners25,28,29. While atretic oocytes can be found in all stages (PVO, CA or VO27), the VO stock is at the highest during early vitellogenesis and then progressively reduced by atresia until stabilisation, close to spawning season25. Therefore, it could explain the low atresia prevalence and intensity (1.5–8.3%) observed in the present study during the peak of the spawning season. Moreover, fish with atretic oocytes did not have unusual or ‘low frequency’ OSFDs, such as bimodal vitellogenic cohorts.
POFs are the remnants of the follicular complex after egg release. Given that they apparently have no particular physiological role, POFs are destined to degenerate and finally vanish at a rate that varies with ambient temperature and species30. A series of previous studies on various teleosts, including cod, have documented that POF size (POFXSA) can serve as an accurate proxy for elapsed time since egg release17,31. Even though the process is protracted in species inhabiting cold waters17,19, in our study larger POFs were assumed to be younger (i.e. new POFs) and thus closer to a previous spawning event. Concerning the fraction of females with new POFs in each ORC, the trend was quite similar for the two different POFXSA threshold values, with a progressive decrease in the relative production of larger/younger POFs with increasing ORC. This trend in the relative production of younger POFs matched well with the pattern of total POF number (RFPOF) per ORC. More specifically, RFPOF showed an inverted-U pattern as a function of ORC, gradually increasing between ORC 1 and ORC 3 and then decreasing (non-significantly) again in ORC 4. Combining these two sets of results, it appears that the ovaries of ORC 1 fish contain a low total number of POFs which are mostly larger and younger of age. However, females might contain very old POFs from the previous spawning season given that POFs in cod exhibit very low resorption rates17. The number of POFs was shown to increase in ORC 2 and ORC 3 whereas the overall production of new POFs was decreasing, apparently suggesting the gradual accumulation of older POFs in cod ovaries during the spawning season. Finally, in ORC 4 the production of new POFs is either minimised (0.10 mm2 threshold) or eliminated (0.11 mm2 threshold) suggesting that females in this category mainly/only have older POFs. While the reason for the noticed drop in total RFPOF from ORC 3 to 4 is unclear, and requires more detailed research insights, it should be noted that this figure contains measurements of both new and older POFs, and other factors such as egg batch size, total number of egg batches, and spawning interval may not have been uniform between fish32.
When comparing body condition between fish in the different ORCs, the outcomes of the statistical analyses were dependent on the method of calculation for condition factor. For example, the patterns of significant differences for condition factor between ORCs were the same for the somatic indices CSW and KSW, but not K. Specifically, there was a loss of statistical significance in the relationship between condition and TL when the influence of the ovary was removed (KSW vs K), indicating that the dynamic nature of the ovary during spawning significantly influenced K. Furthermore, the use of CSW demonstrated that variation in fish condition was not dependent on TL, and as found by previous works, and the use of CSW eliminated problems that arise due to size dependency in the calculation of K20,33.
As G. morhua is a capital breeder that uses stored energy for reproduction18,34, it was expected that condition would decrease as spawning progressed. In the present study, K decreased as ORC increased, in line with a previous study on Icelandic G. morhua that demonstrated the relationship between increasing PVO proportion and decreasing K10. Without the influence of the gonad, CSW and KSW were both highest in the pre and early-spawning group (ORC 1), suggesting that significant somatic energetic resources were used during the earlier stages of spawning. In G. morhua, the rate and magnitude of change in condition factor throughout spawning depends on several factors, including starting condition, size, age, and environmental factors35,36,37, though the reduction in condition was consistent for fish sampled in this study. Similarly, GSI decreased markedly as ORC increased, which is reflective of serial egg release over the spawning season, a well-documented phenomenon in cod10,19.
Using our newly developed method, female fish were successfully partitioned into one of four ORCs that accurately reflected the characteristics of their OSFDs and spawning stage. The ultrametric method overcomes difficulties associated with presence of bimodal oocyte distributions, oocyte tails, lack of clear hiatus region, and presence of free ova, and can be implemented at a single discreet sampling point. A significant proportion of the workflow (oocyte counting) is also fully automated, and the technique may circumvent the need for histological analysis depending on the desired outcome. For these reasons, the ultrametric method is a cost-effective and rapid tool that can be used to assess preserved ovarian samples. Notably, we detected examples of cod females that apparently showed signs of de novo oocyte recruitment or had bimodal VO cohorts, questioning that cod is a strict determinate spawner. In this work we do not specifically address the drivers behind these unusual patterns, though there are multiple possibilities, e.g. a warmer climate or improved body condition. We believe that the present method advancements could be successfully used in new projects to address such research questions, and related ones. Furthermore, while reproductive dynamics are known to vary across stocks and species, the current principle of relating advancements in spawning (depletion of VOs and FOMs: denominator) to the standing stock of PVOs (numerator) should be broadly applicable to determinate species other than cod, and possibly to indeterminate spawners, as long as the fraction of PVOs entering vitellogenesis during spawning24 is assessed by other means first. Thus, we expect that the ultrametric method will be compatible with a wide range of species, though the OR thresholds should be adjusted as needed to ensure that species-specific differences in ovarian dynamics are accounted for. Fine adjustment may also be required when applying this method to fish from different stocks or environmental conditions.
Source: Ecology - nature.com
