SWE enhances groundwater sustainability
California recently endured a record-breaking drought after 2012 (refs. 20,21), which significantly impacted food production22, reduced hydropower generation23 and caused severe environmental issues (e.g., groundwater depletion, wildfires, tree mortality, land subsidence). As the largest agricultural producing state in the USA, California earned ~$47 billion from its agricultural sector and contributed to 13% of the US total in 2015 even during the drought. The maintenance of crop revenue and overall resilience of the agricultural sector largely relied on the unsustainable groundwater overdraft, which effectively offset the drought impact, but contributed to severe groundwater depletion ((sim!!3.7 {{rm{km}}}^{3})/year24). In the energy sector, during this driest year of the drought, decreased surface water availability sent the in-state hydropower generation plunging to 7% of the total electricity generated, substantially below the state’s long-term average of around 18%23. This power deficit was offset by electricity generated through the rapidly growing solar and wind fleet, as well as from increased use of natural gas and electricity purchased from out-of-state sources23. Furthermore, for the first time, in 2012, solar and wind electricity generation exceeded hydropower in California23 due to the declining cost of wind turbines and solar photovoltaic (PV) in conjunction with the popularity and stringency of the Renewables Portfolio Standard (RPS), which mandates a certain proportion of renewables in the energy production.
The penetration of SWE not only offset some of the decreases in hydropower but has implications beyond the energy sector given the inextricable links among food, energy and water. This added value can be derived by considering the sustainability trade-offs within the WFE nexus. In general, there is a direct trade-off between hydroelectricity production and irrigation of crops in how surface water is allocated between the two. There is also an indirect trade-off between hydroelectricity production and groundwater abstraction, as groundwater can substitute for reduced surface water availability during a drought, which in the case of the recent California drought allowed crop production to generally be unaffected. Given relatively low groundwater recharge rates and increasing risk of drought, this indirect trade-off highlights potential sustainability challenges for groundwater.
We adopt the trade-off frontier (TF) (also called production possibility frontier, see Methods for details) to investigate the compromise between hydroelectric generation and groundwater abstraction in California given a set of surface water constraints (gray solid lines in Fig. 1) varying from a dry to a wet year. We use a calibrated and physically based hydrological model with water management options to dynamically simulate the surface water availability for hydropower production as well as the irrigation water requirement (including both surface water and groundwater) for food production. We then estimate how surface water and groundwater can be optimally allocated to maximize the total economic revenue ((R)). Given the water constraint in a certain year, surface water allocation strategies are efficient if they fall along the TF curve, while they are inefficient/unattainable if strategies fall below/above the TF. A strategy is inefficient if surface water is not fully used for hydropower (production is lower than potential) and agriculture (irrigation is less than crop demand), and groundwater is used for irrigation instead. A strategy is unattainable if the water demand for both hydropower production and irrigation exceeds the surface water availability, and the shortfall in irrigation demand cannot be satisfied by the current groundwater abstraction rate. Iso-revenue curves (green dashed lines in Fig. 1) connect points of equal economic profit with different quantities of hydroelectricity production, economic cost of groundwater pumping and revenue loss due to crop failure (see Methods for details on revenue calculation). Crop revenue may be reduced if water demand is not met by surface water allocation and the current rate of groundwater abstraction. Iso-revenue curves are convex given the law of diminishing marginal utility. The point of tangency between the TF and the iso-revenue curve (black point in Fig. 1) indicates the optimal (or economically efficient) condition where efficient water allocation and maximum revenue could both be achieved through appropriate policy instruments, such as SWE penetration and groundwater abstraction caps (as discussed later). Externalities or market failure may distort the iso-revenue curve, and social and technological constraints (e.g., cropping decisions, lack of infrastructure for water storage and diversion) may cause the allocation to be unattainable. On top of these factors, hydroclimate variability will shift the TF inward and outward for low (lower surface water availability in a dry year) and high inflow (higher surface water availability in a wet year) conditions, respectively, compared to the normal year. Connecting the optimal points under different surface water availability conditions forms a so-called expansion path (EP, pink lines in Fig. 1, see supplementary materials for algorithms applied to find EP). The EP informs policymaking by identifying the optimal water allocation to secure food production while balancing hydroelectric generation and groundwater abstraction as surface water availability changes.
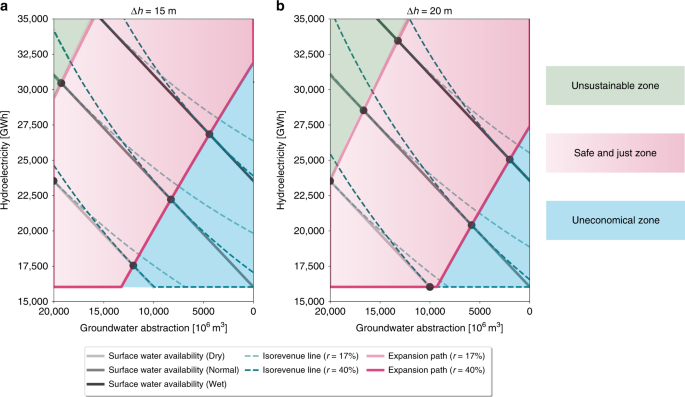
Trade-off analysis between groundwater abstraction and hydropower generation. Frontiers curves (gray solid lines) for three inflow availability conditions (dry, normal and wet year) during the historical period estimated from CWatM, the corresponding iso-revenue lines (green dashed lines) and expansion paths (pink solid lines) for optimal water allocation given current ((r) = 17%) and future penetration of SWE ((r) = 40%) under different groundwater pumping lift ((Delta h)): a (Delta h=15 {mathrm{{m}}}), b (Delta h=20 {mathrm{{m}}}). Black dots represent the optimal condition, where surface water allocation is efficient and revenue can be maximized. Light-green shaded area represents unsustainable zone, where more groundwater is abstracted for irrigation as less surface water is available due to its use for hydroelectric generation. Pink shaded area is the safe and just zone, where optimal points can be achieved. Light-blue shaded area represents uneconomical zone, where we sacrifice the revenue from hydropower production in order to maintain the groundwater sustainability
To examine the added value of SWE in reducing sustainability trade-offs, we use this framework to quantify how optimal strategies maximizing hydroelectricity and agricultural income, whilst avoiding groundwater depletion, are altered by the penetration of SWE. California has seen sustained growth of solar and wind power, which account for 17% of statewide electricity generation in 2016 (data from California Energy Commission). By 2030, solar and wind are projected to generate 35–40% of total electricity25 to achieve the goal of 50% renewables together with hydropower (State Bill No. 350). Given this target, we consider two penetration scenarios to examine how future penetration of SWE (40%) would influence the hydroelectricity–groundwater trade-offs compared to the current situation (17%) under different surface water availability conditions. Penetration of SWE influences the shape and position of the iso-revenue lines and therefore changes the position of the optimal point (Fig. 1, see Methods for details). Iso-revenue lines in the current penetration scenario have smaller curvature than those in the future penetration scenario, indicating smaller marginal revenue of hydroelectricity. This implies that as more SWE is deployed and the hydroelectricity price goes down, to maintain the same revenue, one unit of abstraction of groundwater requires more hydroelectric generation to compensate the pumping cost. This in turn shifts the EP rightward (more sustainable for groundwater), favoring surface water allocation for irrigation and reducing groundwater abstraction. This happens because hydropower is displaced by solar and wind, surface water, which would otherwise generate hydroelectricity, is conserved and can now be used for irrigation. As indicated by the horizontal part of the EP, the initial allocation of surface water is targeted for crop production with higher priority until surface water availability surpasses a certain threshold. This is especially the case when surface water becomes scarcer during a drought, and the cost of pumping groundwater to the surface becomes higher than the revenue gained from hydroelectricity generation. As surface water becomes abundant, it starts to be allocated to both hydropower generation and irrigation with equal marginal water allocation efficiency as shown in the diagonal part of the EP.
The sustainability value of SWE is, however, tempered by groundwater depletion. If groundwater is abstracted at unsustainable rates (abstraction exceeds recharge, as is currently happening in the Central Valley of California) then the value of SWE in reducing surface water allocation trade-offs also decreases. Groundwater depletion results in higher pumping lift ((Delta h)) and costs, which therefore further exacerbates the trade-offs between groundwater abstraction and hydroelectric generation. Consequently, this pushes the socially optimal EP together with the safe and just zone further to the right (Fig. 1b compared to Fig. 1a) suggesting less groundwater is abstracted. However, given the increased groundwater depletion ((Delta h) = 20 m), any additional groundwater abstraction could make the groundwater aquifer less sustainable (increased unstainable zone in Fig. 1b). We also note the enhanced length of the horizontal EP (Fig. 1b), which implies that groundwater depletion further reduces the marginal revenue of hydropower during drought periods. As groundwater becomes scarcer and more expensive, hydropower should be reduced to save water for irrigation. This leads to the shrinkage of the uneconomical zone, as groundwater pumping costs are saved with a higher magnitude compared to the magnitude of the revenue loss due to the reduced hydropower.
Taking into account groundwater sustainability policies
The TF–EP framework envisions the optimal pathway to balance the trade-offs between hydroelectric generation and groundwater abstraction, which in reality is over-optimistic and may not be achievable owing to a set of physical, political and economic constraints. One possible constraint comes from regulation policies, which could act as a barrier to achieving the social optimum, such as the recently passed Sustainable Groundwater Management Act (SGMA) in California. Such quantity-oriented regulations set the limit for groundwater abstraction (({g}_{{{{w}}}})) (see the schematic illustration in Fig. 2a), under which the optimal point can only fall into the hatched area. For years with relatively low surface water availability, this groundwater cap (({g}_{{{{w}}}}^{{rm{Cap}}})) reduces efficiency even with high penetration of SWE, as the optimal condition is not attainable (that is, the optimal point ({O}_{{{{C}}}}/{O}_{{{{F}}}}) moves to (A)). As water availability further increases, imposing limitations via regulations may not influence the optimal point under future penetration of SWE (as ({O}_{{{{F}}}}^{^{prime} }) is still in the hatched area), whereas under current penetration the optimal point is shifted from ({O}_{{{{C}}}}^{^{prime} }) to (A^{prime}). Limiting groundwater use in turn increases the risk of crop failure and therefore reduces the crop revenue. To quantify this, we define the relative revenue loss ((delta)) as: (delta =1-frac{R({g}_{{{{w}}}}le {g}_{{{{w}}}}^{{rm{Cap}}})}{R({g}_{{{{w}}}}le infty )}), which has a range from 0 to 1, with 0 indicating zero revenue loss and the optimal point still achievable. Intuitively according to Fig. 2a, this implies that control on groundwater abstraction is not stringent enough to move the optimal point out of the hatched area, which means regulation policies do not exert any impacts on the optimal water allocation and therefore the total revenue is not influenced. As (delta) increases, we face higher revenue loss either because we have a stricter groundwater cap, or there is lower surface water availability. With fixed surface water availability (Fig. 2b), (delta) monotonically decreases as ({g}_{{{{w}}}}^{{rm{Cap}}}) increases for both current penetration (({P}_{{{{C}}}}^{1}to {P}_{{{{C}}}}^{2})) and future penetration (({P}_{{{{F}}}}^{1}to {P}_{{{{F}}}}^{2})). In other words, as we loosen the limit on groundwater use, the relative loss will be reduced. This further implies that groundwater sustainability is put at risk for economic revenue.
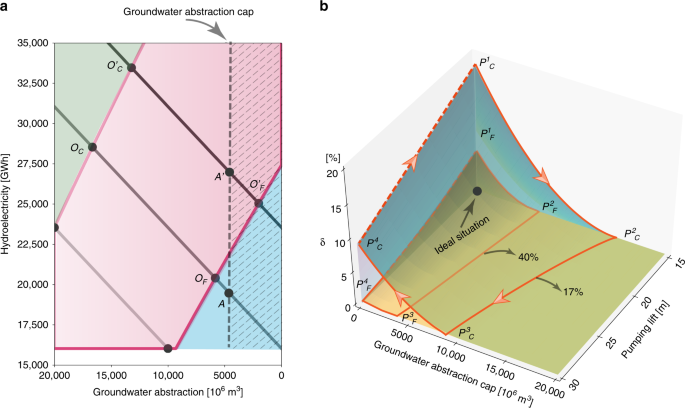
Impact of regulation policy on groundwater–hydropower trade-offs. a Schematic illustration of how groundwater abstraction cap (({g}_{{{{w}}}}^{{rm{Cap}}})) shifts the trade-offs optimal point. ({O}_{{{{C}}}}/{O}_{{{{C}}}}^{^{prime} }) and ({O}_{{{{F}}}}/{O}_{{{{F}}}}^{^{prime} }) represent the optimal point given current (17%) and future (40%) penetration of SWE in the normal/wet year without ({g}_{{{{w}}}}^{{rm{Cap}}}). The vertical dashed line sets the limit of groundwater abstraction to meet certain regulations. With such a water constraint, the optimal point can only fall into the hatched area. When surface water is not abundant (e.g., during a normal year), the optimal point ({O}_{{{{C}}}}/{O}_{{{{F}}}}) will not be attainable, and therefore (A) becomes the new optimal under the regulation. However, such regulation does not affect the optimal point (({O}_{{{{F}}}}^{^{prime} })) when water is abundant (e.g., during wet year) and when SWE penetration is high, as ({O}_{{{{F}}}}^{^{prime} }) is still in the hatched area. b Relative revenue loss ((delta)) as a function of groundwater pumping lift ((Delta h)) and ({g}_{{{{w}}}}^{{rm{Cap}}}) under the influence of different penetration ratios of SWE (17% and 40%). Revenue loss zones are represented by the wedge-shaped area enclosed by the orange lines (current: ({P}_{{{{C}}}}^{1}{P}_{{{{C}}}}^{2}{P}_{{{{C}}}}^{3}{P}_{{{{C}}}}^{4}); future: ({P}_{{{{F}}}}^{1}{P}_{{{{F}}}}^{2}{P}_{{{{F}}}}^{3}{P}_{{{{F}}}}^{4})). Dashed orange lines represent extremely strict regulation policy (e.g., zero allowance of groundwater abstraction), which is unlikely to occur in reality. The black dot represents the ideal situation, where groundwater could be recovered and revenue loss is reduced
Groundwater pumping lift ((Delta h)) adds another layer of complexity to the relative revenue loss ((delta)). Higher pumping lift indicates higher pumping cost associated with more severe groundwater depletion. In the plane with zero revenue loss, higher pumping lift would require more stringent groundwater regulations (({P}_{{{{C}}}}^{2}to {P}_{{{{C}}}}^{3})) in order to achieve the optimal trade-offs as described in Fig. 1. We note that future penetration of SWE pushes the boundary toward a smaller groundwater cap (({P}_{{{{C}}}}^{2}{P}_{{{{C}}}}^{3}) is shifted to ({P}_{{{{F}}}}^{2}{P}_{{{{F}}}}^{3})), which implies that we can set relatively strict regulations for groundwater sustainability with a higher percentage mix of SWE in the energy portfolio. Ideally, society would like to move toward the black point in Fig. 2b with lower revenue loss and higher groundwater storage recovery (smaller pumping lift). Our results highlight the difficulty in recovering groundwater storage (({P}_{{{{C}}}}^{4}to {P}_{{{{C}}}}^{1})) once it has depleted to a certain extent even with extremely strict regulations (e.g., near zero allowance). This is because a small reduction of pumping lift (slightly recovery of groundwater storage) would result in a significant increase in revenue loss (i.e., (delta) increases dramatically along the direction of ({P}_{{mathrm{{C}}}}^{4}to {P}_{{mathrm{{C}}}}^{1}) with a slight decrease of (Delta h)). As (delta) is defined as a relative term, it shows how much total revenue will be reduced if groundwater regulation policy is added as a constraint relative to the situation without such constraint. Given that people tend to be loss averse (e.g., minimize relative revenue losses compared to the optimal situation) and prefer to make decisions based on losses rather than gains26, the system will tend to move back to its initial state of larger pumping lift with lower revenue loss (moving toward ({P}_{{{{C}}}}^{4}) rather than ({P}_{{{{C}}}}^{1})). This could be reasonable assuming that government aims for a sustainability-oriented policy, which may not be fully based on economic revenue. In addition to these effects, even when groundwater storage is recovered ((Delta h) reduces), the reduced groundwater pumping cost will create incentives for people to extract more groundwater (EP in Fig. 1b is shifted to the left in Fig. 1a), which again will eventually exacerbate groundwater depletion. This implies that once we are trapped in the situation with severe groundwater depletion, it will be difficult to move out of it. However, this negative effect can be potentially offset to some degree with higher penetration of SWE, which shifts ({P}_{{mathrm{{C}}}}^{4}to {P}_{{mathrm{{C}}}}^{1}) down to ({P}_{{{{F}}}}^{4}to {P}_{{{{F}}}}^{1}). Our results further demonstrate that if groundwater use is not regulated and the depletion keeps getting worse (pumping lift increases), then the benefits of higher SWE penetration is limited as the distance between the two wedge-shaped surfaces (({P}_{{{{C}}}}^{1}{P}_{{{{C}}}}^{2}{P}_{{{{C}}}}^{3}{P}_{{{{C}}}}^{4}) and ({P}_{{{{F}}}}^{1}{P}_{{{{F}}}}^{2}{P}_{{{{F}}}}^{3}{P}_{{{{F}}}}^{4})) decreases. This suggests that the combined effect of more stringent control on groundwater abstraction plus SWE penetration is key to ameliorate revenue loss as well as benefit groundwater recovery. In summary, the results indicate that groundwater depletion can potentially diminish the added sustainable outcomes of SWE and we cannot merely assume that the positive effect of solar and wind penetration will persist indefinitely. Policy makers therefore have to take the long-term outlook of groundwater depletion into consideration when planning further deployment of SWE.
Source: Resources - nature.com
