Shared OTUs between mother’s vagina, and child’s gut and airways
Vaginal birth samples were obtained from 57 women after rupture of membranes but before childbirth. These women also had vaginal samples characterized at pregnancy week 24 (n = 56) and week 36 (n = 57) and samples were collected from the children (all singletons) of these 57 women 1 week after birth from both feces (n = 48) and airways (n = 39). The baseline characteristics of the 57 women from whom a vaginal birth sample was obtained were compared with the rest of the cohort comprising 681 pregnant women. These characteristics are detailed in Table S1. The included women were comparable to the remaining cohort in all characteristics apart from a difference in birth season (none of the included women gave birth in the spring) and a trend toward fewer deliveries by cesarean section. All further comparisons were only performed within the set of 57 included women and their children and therefore not affected by these differences.
All samples were characterized by 16S rRNA gene amplicon sequencing of the V4 region. With a median sequencing depth of 43,132 reads in the vaginal samples, 48,764 reads in the fecal samples and 30,949 reads in the airway samples, we identified a total of 2327 unique Operational Taxonomic Units (OTUs); 1548 OTUs in the vaginal samples, 1536 OTUs in the fecal samples, and 528 OTUs in the airway samples. In detail, 839 unique OTUs were identified at pregnancy week 24, 974 OTUs at week 36, and 1071 OTUs at birth. Of all unique OTUs, 319 (13.7%) were ubiquitous OTUs (i.e., present in vagina, gut and airways in at least a single sample) and 647 (27.8%) were shared between two compartments. A total of 88.3% of the reads were from ubiquitous OTUs, while 9.3% were from OTUs shared between any two compartments, leaving only 2.4% as compartment unique reads (Fig. 1). Most of the OTU vs OTU co-occurrence structure occurred in OTUs shared between several compartments, especially ubiquitous OTUs.
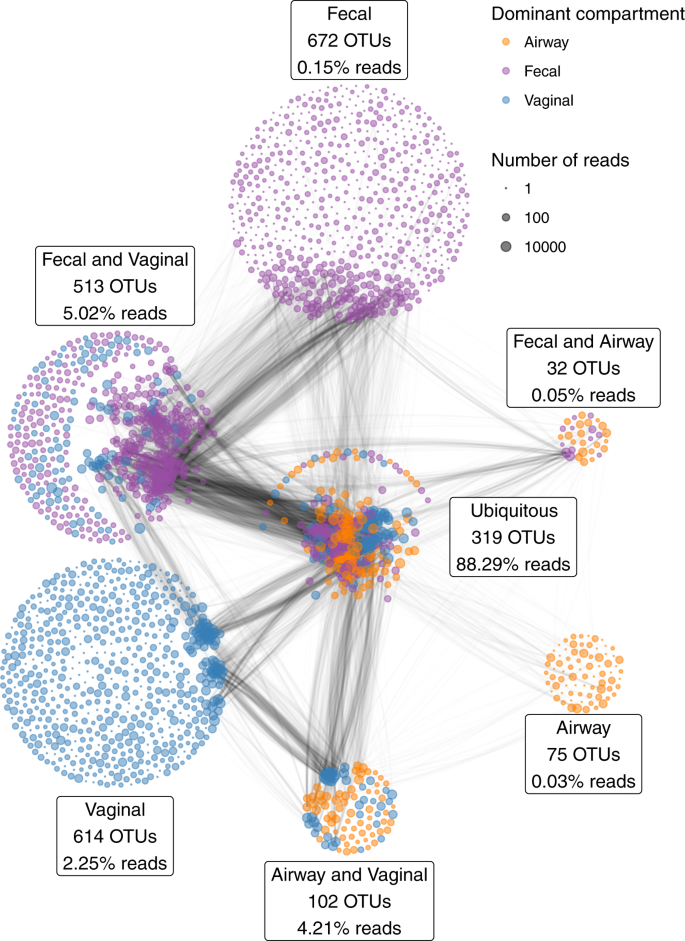
The percentages indicate the relative number of reads of the partition; i.e., the 319 ubiquitous OTUs account for a total of 88.3% of the reads. The edges between the OTUs indicate the pairwise correlations (r) reflecting the co-occurrence based on a correlation network analysis on each compartment separately, using the highest value among the three compartments. The thickness of the edge corresponds to the maximum pairwise correlation across compartments. Only r > 0.2 are plotted.
Microbial changes during pregnancy and birth
The median richness per sample was 95 for vaginal, 134 for fecal, and 67 for airway samples. During pregnancy, the median richness per sample was 92 at pregnancy week 24, 85 at week 36, and 117 at birth (see Table S4 for further descriptive details). We investigated variation in vaginal microbial diversity during pregnancy by Faith’s Phylogenetic Diversity (PD) and Shannon diversity indices, representing PD, and a combination of species richness and evenness, respectively. Of the total variation, 35.1% (PD, p = 0.10) and 60.5% (Shannon, p < 0.001) could be allocated to each individual mother, whereas a general increase in diversity over the three time points during pregnancy contributed with 12.5% (PD, p < 0.001) and 4.6% (Shannon, p = 0.001) of the variation (Fig. 2a, b). The increase in PD was only observed between pregnancy week 36 (median [IQR], 5.90 [4.41–7.91]) and birth (8.59 [5.99–12.80], p < 0.001) with no difference between week 24 (6.10 [5.19–7.79]) and week 36 (p = 0.8). Conversely, the increase in Shannon diversity was pronounced between pregnancy week 24 (0.79 [0.49–1.66]) and week 36 (1.40 [0.60–1.70]) (p = 0.006) with a non-significant change from week 36 to birth (1.31 [0.85–1.80], p = 0.4). We observed a higher Shannon but a lower PD diversity in the children’s 1-week airway and fecal samples compared with the vaginal at birth, which for the fecal samples could reflect an immature composition partly due to ongoing breast-feeding.
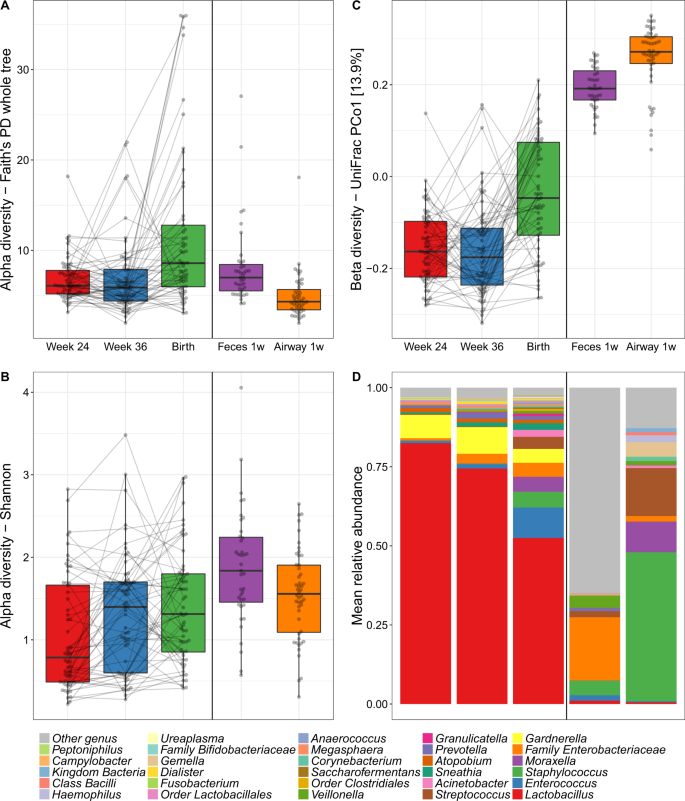
Alpha diversity by a Faith’s Phylogenetic Diversity (PD) and b Shannon diversity of the vaginal (Week 24, Week 36 and Birth), fecal and airway samples. c Primary source of variability between vaginal, fecal and airway samples (PCo1) from ordination by unweighted UniFrac. d Relative abundance of the dominant genera.
We computed unweighted UniFrac ordinations of all three vaginal time-points, as well as the children’s 1-week airway and fecal samples. The main variation in this analysis (Principal Coordinate 1 (PCo1)), was found between the two pregnancy vaginal samples and the children’s fecal and airway samples with the birth samples placed between these two extremes (Fig. 2c). This suggests a development of the perinatal microbiome toward a state taxonomically more resembling the early gut and airways of the child rather than earlier in pregnancy. The same phenomenon was observed when using weighted UniFrac distances which take into account relative abundances (Fig. S1), though this ordination appeared more driven by vaginal-fecal than vaginal-airway differences. The vaginal samples were all dominated by Lactobacillus, with declining abundance from pregnancy week 24 until birth (Fig. 2d). The lower relative abundance of Lactobacillus resulted in increasing abundance of other genera, including both typical fecal taxa, such as Enterococcus, Family Enterobacteriaceae, and Streptococcus as well as taxa commonly found in airway and skin such as Staphylococcus, Moraxella, and Streptococcus. These taxa were all prevalent in the 1-week fecal and airway samples, which had low relative abundances of Lactobacillus. These shifts in relative abundances also appeared to be the key drivers behind the observed variation in PCo1 of both unweighted and weighted UniFrac (Figs. S3–S5), while a more divergent set of taxa correlated with subsequent principal coordinates between unweighted and weighted.
Associating the microbiome composition at birth with the birth characteristics (antibiotics during pregnancy, antibiotics during third trimester of pregnancy, antibiotics during birth (mother), season of birth, maternal age at birth, older children in the home, preeclampsia and gestational age at birth) did not reveal any differences regarding alpha- or beta diversity, but suggested a positive correlation between gestational age and genera Enterococcus and Granulicatella (q value < 0.02) (Table S6).
Comparison of relative abundances of vaginal microbial taxa
At the genus level, consistent stepwise increases or decreases were seen for the vaginal samples in all the major taxa from pregnancy week 24 through week 36 until birth (Fig. 3 and Table S7 for sensitivity analysis). Lactobacillus, by far the most prevalent genus, decreased successively for each time-point. This decrease was not specific to any of the major Lactobacillus OTUs but occurred across all of the most commonly identified OTUs, see Figure S6. Moraxella, Streptococcus, Staphylococcus, Enterococcus, Corynebacterium, and Gemella all increased significantly for each successive sample time-point to fill the space corresponding to the decreased Lactobacillus abundance. These findings suggest that the perinatal vaginal microbiota does not change suddenly following rupture of membranes or initiation of labor, but rather undergoes a smooth continuous development throughout the last half of pregnancy.
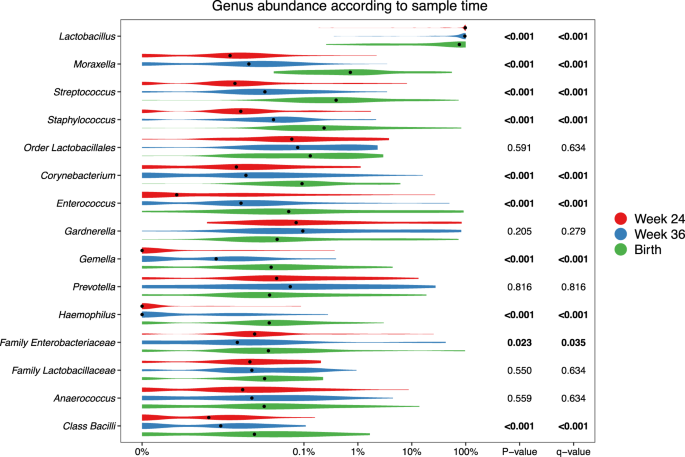
p-values correspond to Kruskal–Wallis tests of the relative abundances, with significant values (p < 0.05) bolded. A pseudocount (+1e−06) was added to all abundances for the log-scale presentation. False discovery rate q values were calculated within these top 15 taxa.
Some taxa (314 specific OTUs) were unique to the birth samples, and were not identified in any of the earlier vaginal samples. Most of these 314 OTUs were only identified in one or few birth samples, but 11 OTUs were found in 5 or more samples. These included four Moraxella OTUs, three Streptococcus, and some unclassified Bacteria, Chitinophagaceae, Bacillales, and Bacilli. However, the combined relative abundance of these unique OTUs in the birth samples was minor (median 0.037% IQR [0.009–0.16%]), see Table S5. The phylogenetic placement of the Moraxella and Streptococcus OTUs unique to the birth samples are shown in Figs. S7 and S8.
The individualized vaginal microbiota
Having established major changes of the vaginal microbiota occurring at birth compared with the two previous time-points, we compared the samples within each woman at the three vaginal time-points. The major direction of variation in the UniFrac PCoA (Fig. 4), as described by Principal Coordinate 1 (PCo1), was the difference between birth (mean PCo1 score 0.13 (SD 0.25)) and both week 36 (−0.05 (0.16), Wilcoxon test p < 0.0001) and week 24 (−0.08 (0.09), p < 0.0001), while no difference existed between week 36 and week 24 (p = 0.63). However, PCo2 was dominated by inter-individual variation, where each mother was a highly significant determinant, as illustrated by the horizontality of lines in Fig. 4. A subanalysis revealed multiple taxa contributing to the variation in PCo1, see Fig. S9. The variation explained in PCo2 by individual mother was 60.3% (linear model, p < 0.0001). This large inter-individual as well as time-point variation was confirmed in a joint multivariate model (UniFrac Adonis, time-point F value = 7.96, R2 = 7.6%, p < 0.0001, individual F = 1.48, R2 = 39.5%, p < 0.0001). Similar results were found when restricting the analysis to the week 36 and birth samples (UniFrac Adonis, time-point F = 6.47, R2 = 4.8%, p < 0.0001, individual F = 1.25, R2 = 53.8%, p = 0.0012), week 24 and birth samples (UniFrac Adonis, time-point F = 10.98, R2 = 8.1%, p < 0.0001, individual F = 1.24, R2 = 51.3%, p = 0.0008) or rarefying to 2000 reads (UniFrac Adonis, time-point F = 5.60, R2 = 5.0%, p < 0.0001, individual F = 1.95, R2 = 47.1%, p < 0.0001). Collectively, these results reinforce our findings that the vaginal microbiota undergoes major changes at birth, likely including fecal admixture, yet it clearly retains a distinctive individual signature from the earlier pregnancy time-points.
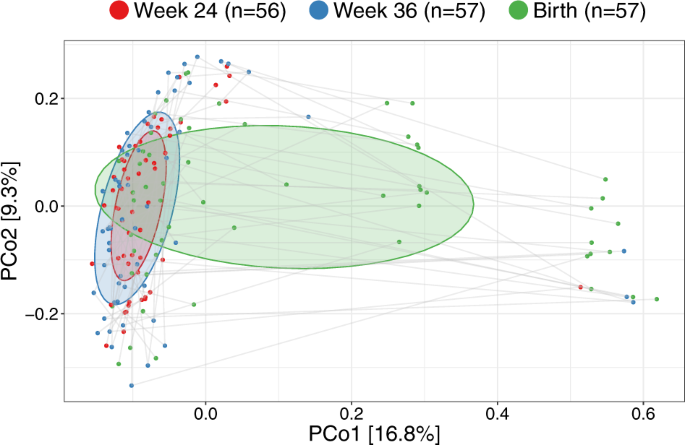
UniFrac ordination of vaginal microbiotas colored according to time-point and joined within individuals. Ellipses demonstrate the mean ± 1SD.
Vertical transfer from mother to child
We hypothesized that the vaginal microbiota at birth was a major source for the neonatal gut and airway colonization. To investigate this question, each OTU in the vaginal birth samples was tested for transfer to the neonate’s fecal and airway samples at age one week, as well as whether a certain maternal vaginal community structure promoted a certain fecal or airway community structure. The analyses were restricted to the 49 (86%) vaginally delivered children from which 36 and 45 matching neonatal fecal and airway samples were available respectively. From the total of 2327 OTUs, 536 OTUs were found pairwise between vaginal and fecal samples and 346 OTUs between vaginal and airway samples.
Transfer was first analyzed as presence/absence by Fisher’s exact test. Figure 5 shows volcano plots of the odds of observing a specific OTU in the child given the presence in the vaginal sample at birth. Of these tests, 14 OTUs were significant (p < 0.05) for transfer to the gut and 2 OTUs for transfer to the airways. However, none of these significant differences survived correction for multiple testing at false discovery rate (FDR) levels below 0.30. Nevertheless, the distribution of the transfer odds was observed in favor of positive transfer (OR > 1). An enrichment analysis, calculating a weighted ratio (WR) between positive and negative transfer odds revealed ratios between positively and negatively associated OTUs between mother and child samples of 2.7 (p = 0.036) and 2.3 (p = 0.003) for fecal and airway samples, respectively. This indicates a tendency of transfer that was spread across all OTUs rather than strong transfer of specific OTUs. For robustness analysis of these results see Table S8.
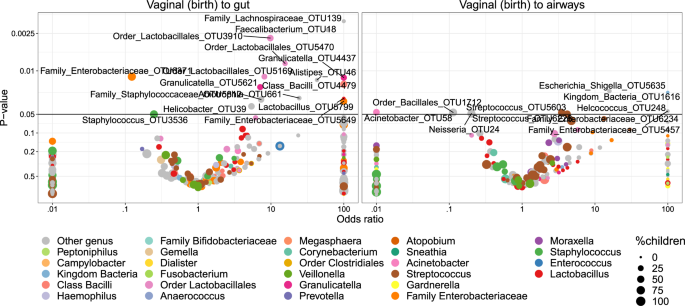
The significant (p < 0.05) OTUs above the horizontal line are labeled according to lowest assignable phylogenetic rank. Odds ratios <0.01 or >100 are truncated to these boundaries. Size of the dots indicates the number of children carrying the taxa.
We examined the correlation with the hypothesis that more abundant taxa in the vaginal samples would increase the odds of transfer to the children, but interestingly, higher OTU abundances were negatively correlated with the odds of transfer. However, this was not statistically significant (pgut = 0.05, pairways = 0.09). Furthermore, the phylogenetic placement of the individual OTUs was examined. Figure S10 shows the odds for vertical transfer on a cladogram, revealing entire branches with only positive associations including OTUs from Lactobacillales (to gut), Enterobacteriales (to both gut and airways) and a clade of Class Bacilli (to gut). These observations were further verified by correlating the phylogenetic placement with the transfer odds, revealing weak although significant relations for transfer to the gut (R2 = 1.9%, p = 0.001) and the airways (R2 = 1.8%, p = 0.03).
Lastly, microbiota similarity was analyzed by means of beta-diversity. Distances between microbiota of mother and child pairs were compared with distances between nonmatching mother and child pairs for both compartments. In concordance with the univariate results, the only diversity measure revealing statistical significance was the number of shared OTUs, as reflected by Jensen–Shannon Divergence (pgut = 0.025, pairways = 0.006) whereas the other distance metrics were not significant (see Table S9 and Fig. S11 in the Supplementary materials).
Source: Ecology - nature.com

