Data collection
For the purpose of this study, disease incidence is defined as the number of CBS positive fruit (hard spot symptoms)/total number of fruits examined, and disease severity is defined as the percentage of fruit surface covered by hard spot lesions. The disease incidence and severity of CBS was examined over a 3-year period (2013 to 2016) in three commercial citrus groves in Florida. The groves are organized with irrigation ditches (swales) and roads (drivable surface) alternating between rows of citrus (row-swale-row-road-row-swale), and citrus rows were oriented in roughly a north-south direction in each grove. The cultivar-rootstock combination was ‘Valencia’ grafted onto Swingle, planted on average 3.36 m (Grove II) and 3.33 m (Grove III) apart within rows and 6.70 m between rows. Tree age varied from resets (1.5–2 years, with or without fruit) to mature trees (>4 years and fruiting). Initial plot maps were prepared and findings on the spatial and temporal distribution of CBS on fruit in Grove II and another grove not discussed in this paper (Grove I) has been previously published37. The data on the incidence and severity of CBS on fruit in the canopy was taken from Grove II and III.
The study area in Grove II consisted of 37 rows of citrus containing 124 to 127 citrus trees per row. During the 2015–2016 citrus season, there were 4339 trees with 167 open spaces (no tree) and 26.57% (1153/4339) were classified as positive for CBS. The study area in Grove III was comprised of 27 rows of citrus containing 98 to 111 citrus trees per row. In 2013–2014 citrus season, there were 2849 tree spaces, with 1659 trees and 1190 open spaces and 100% were positive for CBS.
Weather data
The Florida Automated Weather Network’s (FAWN) Immokalee station, located at 26°27′43.5″N 81°26′25.9″W is approximately 11.08 km SSE from Grove II and 25.92 km WNW from Grove III and was used to gather 15 minute data on soil temperature, air temperature at 0.6, 2 and 10 m, relative humidity (RH) at 2 m (%), dew point (DP) at 2 m, rainfall, wind speed at 10 m and solar radiation between 1 Jan 2010 and 15 Jun 2017. This station was chosen due to its close proximity to the groves and availability of archived data. A 24-hr period, rainy day, and wet canopy were defined as previously described37. Briefly, a 24-hr period started at 12:00 am and ended at 11:59 pm; a rainy day had a total daily rainfall (TDR) greater than or equal to 0.25 mm; and a wet canopy was a day in which RH was greater than or equal to 90% for at least 8 consecutive hours38. A secondary definition of a wet canopy was defined as a day when the dew point, DP, the temperature at which water vapor in the air condenses, was greater than the temperature (T) at 0.6 m. Data used to estimate susceptibility period of fruit within the canopy to CBS were generated as described in Hendricks et al.37, however fruit susceptibility was calculated as occurring in the first 168 days (24 weeks) following fruit set (wpfs) according to work done by Baldassari et al.13 on ‘Valencia’ and ‘Natal’ orange varieties. To date there is no evidence to suggest that the sexual spore (ascospore) is present in Florida17,18,39, hence only published literature values relevant to the conidia were used to determine susceptibility of tree tissues, including fruit. Conservatively, the temperature range selected was 15 to 35 °C, allowing for the production and germination of conidia. Susceptibility of tree tissues was considered throughout the entire year and defined as periods in which temperature and moisture were sufficient for infection based on literature values for the conidia. For T, RH and DP, a minimum period of 8 consecutive hours was required to be included in the data used to develop the ten categories for potential infection period (IN). These categories were designated as IN1 to IN5 for fruit and IN6 to IN10 for other citrus tissue. These were defined as:
FRUIT SUSCEPTABILITY (IN1 to IN5)
$${rm{IN}}1={{rm{T}}}_{15mbox{–}{35}^{circ }{rm{C}}}+{rm{DP}}ge {rm{Tmin}},{rm{for}},8,{rm{hr}}+{rm{Susceptible}},{rm{Fruit}}$$
(1)
$${rm{IN}}2={{rm{T}}}_{15mbox{–}{35}^{circ }{rm{C}}}+{rm{RH}}ge 90 % ,{rm{for}},8,{rm{hr}}+{rm{Susceptible}},{rm{Fruit}}$$
(2)
$${rm{IN}}3={{rm{T}}}_{15mbox{–}{35}^{circ }{rm{C}}}+{rm{TDR}}ge 0.25,{rm{mm}}+{rm{Susceptible}},{rm{Fruit}}$$
(3)
$${rm{IN}}4={{rm{T}}}_{15mbox{–}{35}^{circ }{rm{C}}}+{rm{RH}}ge 90 % ,{rm{for}},8,{rm{hr}}+{rm{TDR}}ge 0.25,{rm{mm}}+{rm{Susceptible}},{rm{Fruit}}$$
(4)
$${rm{IN}}5={{rm{T}}}_{15mbox{–}{35}^{circ }{rm{C}}}+{rm{RH}}ge 90 % ,{rm{for}},8,{rm{hr}}+{rm{TDR}}ge 0.25,{rm{mm}}+{rm{DP}}le {rm{T}},{rm{for}},{rm{8hr}}+{rm{Susceptible}},{rm{Fruit}}$$
(5)
TREE TISSUE SUSCEPTABILITY (IN6 to IN10)
$${rm{IN}}6={{rm{T}}}_{15mbox{–}{35}^{circ }{rm{C}}}+{rm{DP}}ge {rm{Tmin}},{rm{for}},8,{rm{hr}}$$
(6)
$${rm{IN}}7={{rm{T}}}_{15mbox{–}{35}^{circ }{rm{C}}}+{rm{RH}}ge 90 % ,{rm{for}},8,{rm{hr}}$$
(7)
$${rm{IN}}8={rm{T}}15mbox{–}{35}^{circ }{rm{C}}+{rm{TDR}}ge 0.25,{rm{mm}}$$
(8)
$${rm{IN}}9={{rm{T}}}_{15mbox{–}{35}^{circ }{rm{C}}}+{rm{RH}}ge 90 % ,{rm{for}},8,{rm{hr}}+{rm{TDR}}ge 0.25,{rm{mm}}$$
(9)
$${rm{IN}}10={{rm{T}}}_{15mbox{–}{35}^{circ }{rm{C}}}+{rm{RH}}ge 90 % ,{rm{for}},8,{rm{hr}}+{rm{TDR}}ge 0.25,{rm{mm}}+{rm{DP}}le {rm{T}},{rm{for}},8,{rm{hr}}$$
(10)
If there was a 24-hr period in which the conditions for infection were met, that day counted towards the susceptibility data.
2013–2015 disease incidence and severity of citrus black spot on fruit
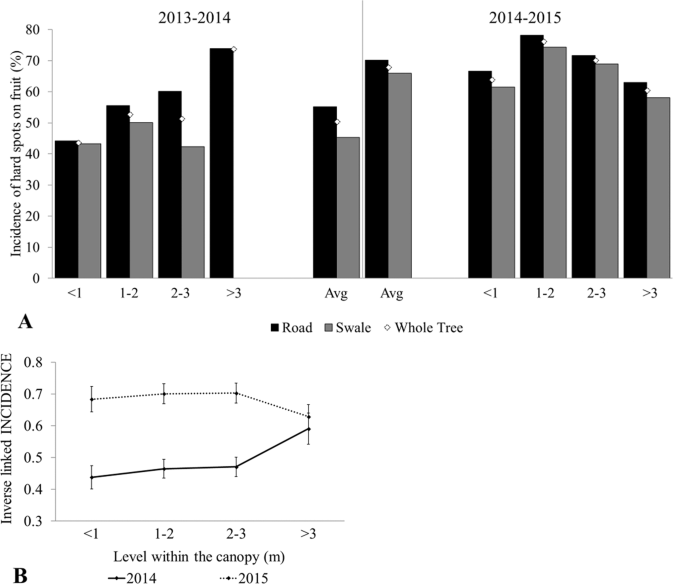
During the 2013–2014 and 2014–2015 citrus seasons, two trees from each row of Grove III, totaling 54 trees, were randomly chosen for the assessment of CBS incidence and severity on fruit. The road and swale side of a tree was assessed at four heights (<1 m, 1–2 m, 2–3 m and >3 m), and fruits were evaluated within a 1 m2 section at each height. Severity assessments were based on a rating system devised by Sposito et al.40; ratings ranged from 0.5% to 49% hard spot coverage on the visible surface of each fruit28,40. The mean severity was based on an average of all the positive fruits evaluated within a 1 m2 section of the canopy. For example, if there were 20 fruits in a 1 m2 sample area and 5 were positive, each with a severity rating of 1.5%, the mean severity rating at that height was 1.5%. Additionally, disease severity and incidence for the entire tree (combining road and swale side) was calculated from this data. During 2014–2015, trees examined were classified as either healthy or declining. Citrus were defined as declining if they exhibited a combination of the following canopy features: sectored within the canopy or as a whole, thinning; reduced growth flushes, die back, reduced fruiting and/or vegetative sprouts on the trunk or on larger interior branches.
CBS severity index
During the 2015–2016 citrus season, a severity rating for Grove III was done on fruit from 20 randomly selected trees, two from each row. Additionally, 89 randomly selected CBS positive trees in Grove II were evaluated for CBS severity. Fruit within a single 1 m2 sampling area taken on the swale and road sides of the tree were graded based on the number of lesions on the fruit using a 0 to 3 grading system. Fruits with no lesions were given a grade of 0; fruits with 1–5 hard spots were given a grade of 1; fruits with 6–50 spots were given a grade of 2 and grade 3 was reserved for fruits having greater than 50 spots.
The CBS severity index was calculated based on the following equation:
$$CBS,Severity,Index=frac{0{n}^{0}+0.25{n}^{1}+0.5{n}^{2}+0.75{n}^{3}}{{n}_{total}}times 100,$$
(11)
where n0, n1, n2 and n3 represent the number of fruits graded 0, 1, 2 and 3 respectively and ntotal the total number of fruits evaluated.
Statistical analysis
Effect of citrus season and fruit location (height and side) within the canopy on CBS incidence and severity in Grove III
The data on disease incidence were fit to a generalized linear mixed model assuming a binomial distribution with a repeated measures effect of tree based on compound symmetry. Disease incidence was modelled as a function of the citrus season (2013–2014 and 2014–2015), side of the tree evaluated (swale or road), height within the canopy at which diseased fruit was found (<1, 1–2, 2–3, <3 m) and the interactions between these factors. Non-significant effects were removed hierarchically to obtain the final model of citrus season, side of the tree evaluated, height within the canopy, and the interaction between citrus season and height.
Mean severity was calculated for each side of the tree by averaging the observed percentage for the four heights within the canopy. These data were transformed by square-root to obtain approximate normality of the residuals. Square-root mean severity was modelled as a function of the fixed effects of citrus season (2013–2014 and 2014–2015), side of the tree evaluated (swale or road), and the interactions between these factors and a random effect for the repeated measures on trees.
Effect of health on CBS incidence and severity in Grove III during the 2014–2015 citrus season
The data on disease incidence were fit to a generalized linear mixed model assuming a binomial distribution with a repeated measures effect of tree using compound symmetry. Disease incidence was modelled as a function of the health, side of the tree evaluated (swale or road), height within the canopy at which diseased fruit was found (<1, 1–2, 2–3, >3 m) and the interactions between these factors. Non-significant effects were removed hierarchically to obtain the final model of health, side of the tree evaluated, and height within the canopy.
Mean severity was calculated as described above and transformed by square-root to obtain approximate normality of the residuals. Square-root mean severity was modelled as a function of the fixed effects of health, side of the tree evaluated (swale or road), and the interactions between these factors and a random effect for the repeated measures on trees.
Effect of grove and tree side on CBS incidence and severity index during the 2015–2016 citrus season
Incidence of CBS affected fruit within 1 m2 area of the canopy was calculated for each side of the tree based on grading data (Incidence = (Grade 1 + Grade 2 + Grade 3)/(Grade 0 + Grade 1 + Grade 2 + Grade 3)). Incidence was fit to a generalized linear mixed model assuming a binomial distribution and modelled as a function of the fixed effect of grove, side of the tree evaluated (swale or road) and their interaction and the random effect of tree.
Disease severity was assessed based on a CBS severity index adapted by Truter (2010)41 from previous work by De Wet (1987). These data were transformed by square-root to obtain approximate normality of the residuals. Square-root CBS Severity Index was fit to a generalized linear mixed model with a repeated measures effect of tree assuming a normal distribution and modelled as a function of grove, side of the tree evaluated (swale or road) and the interaction.
Effect of tree age on CBS incidence and severity index during the 2015–2016 citrus season in Grove II
A subset of data from the 2015–2016 season taken solely from Grove II containing tree age was used to model the effect of age on the incidence of CBS affected fruit and on CBS Severity Index. Disease incidence (Incidence = (Grade 1 + Grade 2 + Grade 3)/(Grade 0 + Grade 1 + Grade 2 + Grade 3)) were fit to a generalized linear mixed model assuming a binomial distribution and modelled as a function of age, side of the tree evaluated (swale or road) and their interactions.
As above, CBS severity index data were transformed by square-root to obtain approximate normality of the residuals and the data were fit to a generalized linear mixed model. Square-root CBS Severity Index was modelled as a function of age, side of the tree evaluated (swale or road) and their interactions. Square-root CBS Severity Index was modelled as a normal distribution random variable.
Values of P ≤ 0.05 was considered statistically significant for all models. All analyses were performed using SAS v9.4 (SAS Institute, Cary, NC).
Source: Ecology - nature.com

