The model
Predator-prey interactions have been investigated systenmatically by following the work of Lotka20. In this section, we first introduce the Lotka-Volterra model and single-species model with toxicity factors. We then combine these two models to obtain a new modified model. The Lotka-Volterra predator-prey model is depicted by16:
$$begin{array}{c}frac{d{x}_{1}}{dt}={x}_{1}({r}_{10}-{r}_{11}{C}_{1}-{a}_{1}{x}_{2}) frac{d{x}_{2}}{dt}={x}_{2}(-{r}_{20}-{r}_{21}{C}_{2}+{a}_{2}{x}_{1})end{array}$$
In those two differential equations, ({r}_{10}{x}_{1}), ({r}_{20}{x}_{2}) are the intrinsic growth rate of prey and mortality rate of predator without toxicity, which is the same as conditions where prey reproduces exponentially in the system. We will show that this exponential growth can be limited by the bioaccumulation of microplastic particles. In addition, ({a}_{1}{x}_{1}{x}_{2}) refers to the lost amount of prey eaten by a predator. The ({a}_{2}{x}_{1}{x}_{2}) is the increasing number of predators due to the feeding of prey.
The single-species model with the effects of toxicants is established18, which provides views of adding microplastic particles toxicity into the predator-prey system:
$$frac{dx}{dt}=x({r}_{0}-{r}_{1}{C}_{0}-nx)$$
(2.1)
$$frac{d{C}_{0}}{dt}=S{C}_{E}-g{C}_{0}-m{C}_{0}$$
(2.2)
$$frac{d{C}_{E}}{dt}=-,{k}_{1}{C}_{E}x+{g}_{1}{C}_{0}x-h{C}_{E}+u(t)$$
(2.3)
In these formulas, x, C0 and CE denote population size, amount of toxicity inside the species and amount of toxicity in the environment respectively. The prey is assumed to reproduce exponentially without toxicity in the original Lotka-Volterra model. r0 stands for this exponential growth in Eq. (2.1). In addition, to demonstrat the extent of toxicity influences, ({r}_{1}) is utilized to denote the response intensity of toxicity. n is the restrictive factor of intraspecific competition here, but we will neglect effect of intraspecific competition and delete this term. As for Eq. (2.2), (S{C}_{E}) denotes absorption rate of the toxicity. (g{C}_{0}) and (m{C}_{0}) represent the egestion rate and purification rate. In Eq. (2.3), ({g}_{1}{C}_{0}x) and (u(t)) denote the toxicity excreted by organism and the emission rate of toxicity to the environment respectively. ({k}_{1}{C}_{E}x) and (h{C}_{E}) represent the absorption rate of toxicity by organisms and the toxicity purification rate by the environment itself.
The significance of this model is that it provides terms ({C}_{0}) and ({C}_{E}) to present the toxicity effects on population dynamics. We can draw an analogy between toxicant and microplastic particles. Consequently, based on this toxic effect model, we add the influence of microplastic particles into the Lotka-Volterra, predator- prey model and produce a new model.
After combining a single-species model with the Lotka-Volterra model, we obtain the modified Lotka Volterra model:
$$frac{d{x}_{1}}{dt}={x}_{1}[({r}_{10}-{d}_{1})-{r}_{11}{C}_{1}-({a}_{1}-{d}_{3}){x}_{2}]$$
(2.4)
$$frac{d{x}_{2}}{dt}={x}_{2}[-{r}_{20}-{r}_{21}{C}_{2}+({a}_{2}-{d}_{2}){x}_{1}]$$
(2.5)
$$frac{d{C}_{1}}{dt}={S}_{1}{C}_{E}-{g}_{1}$$
(2.6)
$$frac{d{C}_{2}}{dt}={S}_{2}{C}_{E}+{rm{k}}{C}_{1}-{g}_{2}$$
(2.7)
$${C}_{1},{C}_{2},{x}_{1},{x}_{2}ge 0$$
This model demonstrates population dynamics of the predator-prey system with the influence of microplastic particles. We will use this modified model to simulate the predator-prey system in the later analysis. Three assumptions made in this model are:
- (1)
The model neglects the influence of the intraspecific competition.
- (2)
The effect of the microplastic is shown by its concentration.
- (3)
The egestion rate ({g}_{1},,{g}_{2}) is independent of the microplastic concentration in the environment ({C}_{E}), and the amount of microplastic concentration removed at each time step is independent of the total amount of microplastics in the organisms ({C}_{1}) and ({C}_{2}).
Equations (2.4) and (2.5) illustrate the toxicological effects of microplastics on the population of prey and predator. ({x}_{1}), (,{x}_{2}) represent the population of prey and predator respectively. Microplastic particles have either negative or neutral effect on the reproduction and survival on aquatic organisms13. In particular, exposure to microplastic particles leads to behavioral abnormality including the interruption of feeding ability and the hypoactivity phenomenon21,22. Such detrimental effects can cause the inhibition of the intrinsic growth rate of prey. Thus, we use ({d}_{1}) to denote the decline in the prey feeding ability. In addition, reduction of the predatory performance and efficiency is emphasized when exposed to microplastic particles23. Since ({a}_{2}{x}_{1}{x}_{2}) measures the increasing number of predators due to the feeding of prey in the model, we apply ({d}_{2}) to denote the adverse effect of reduced predatory performance, which can decrease the number of predators. Therefore, for the prey, the lost amount of prey eaten by the predator will decrease and is denoted by ({d}_{3}). Furthermore, there is a potential for microplastic particles to cause other detrimental effects and damage to organisms, including inflammatory responses, oxidative damage, disruption of metabolism, immunity, and neurotransmission dysfunction24,25,26. Here, we utilize ({r}_{11}{C}_{1}) and ({r}_{21}{C}_{2}) to express these toxicological effects induced by microplastic particles, which describe the response intensity of prey and predator to the microplastic particles respectively. We will later simulate the predator-prey system according to the values of (,{r}_{11}) and ({r}_{21}). Note that ({r}_{10}), ({r}_{20}), ({a}_{1}) and ({a}_{2}) are all positive parameters. In addition, we assume ({r}_{11}) and ({d}_{1}) have the same sign, while ({r}_{21}), ({d}_{2}) and ({d}_{3}) have the same sign.
Equations (2.6) and (2.7) are related to the uptake, ingestion and egestion of microplastics. ({C}_{1}), ({C}_{2}) denoted average microplastic particles concentration distributed inside the body of prey and predator respectively. A review by Hidalgo-Ruiz et al.27 indicates that plastic particle selection occurs in the uptake of microplastics. Organisms may exert selectivity between particles, affecting the bioavailability of microplastics28. Physical factors of microplastics such as size, density, abundance and color can determine this bioavailability9. Therefore, we use ({S}_{1}) and ({S}_{2}) to present the effects of plastic particle selection of prey and predator respectively. Furthermore, ({S}_{1}{C}_{E}) represents the microplastic particles absorption rate of prey and ({S}_{2}{C}_{E}) represents the direct microplastic particles ingest rate by predator from the environment. (k{C}_{1}) represents the accumulated toxicity of microplastic particles transferred from the prey, which is the effect of bioconcentration. As for the egestion of microplastics, Au et al.29 suggest that the microplastic egestion rate is not significantly different to the microplastic concentration and is related to the mechanism of the organism itself. Consequently, different from Eq. (2.2) and Eq. (2.3), toxicity effect of egestion is simplified in this modified model, and we use ({g}_{1},,{g}_{2}) to represent the microplastics egestion rate of prey and predator.
Parameter estimation
With respect to parameter estimations, the concentration of microplastic particles in a freshwater environment (denoted by CE) is not a function of time, but will be affected by external factors such as rainfall, wind conditions as well as the local physical environment30. However, because this study is a theoretical analysis, we ignore the influence of external factors and just consider CE as a constant in this model. Also, we use data from the literature and the value of concentration in surface water (30 particles/m3) in the simulation.F
Egestion times of prey (denoted by g1) and egestion times of predator (denoted by g2) are other two important parameters to estimate removal of microplastic particles. Au et al.29 proposed that microplastics egestion rate is related to the microplastics shapes, size and life-stage of the organism, but not significantly varied by the exposure concentrations. Egestion times remain unchanged at different exposure of microplastic particles concentration, and is similar to the natural food items. This may indicate that microplastics egestion rate is independent of its concentration. Therefore, in this study we assume the egestion rate ({g}_{1},,{g}_{2}) to be two constants.
If experimental data is available, the intrinsic rate of the increase of prey without microplastic particles (denoted by ({r}_{10})) can be calculated. The computing method is to take the population after a time period minus the initial population and divide this result by the initial value31. Similarly, the increasing number of predators due to the feeding of prey (denoted by ({a}_{2})) can be estimated by the same formula. Furthermore, the natural mortality rate of the predator (denoted by ({r}_{20})) can be considered as the multiplicative inverse of ({a}_{2}).
However, due to lack of experimental data, this study investigates a model population instead of a real population. We obtain proper parameters from an empirical study32 with the following values and initial conditions:
$${begin{array}{l}{x}_{1}(0)=100 {x}_{2}(0)=10 {C}_{1}(0)=0 {C}_{2}(0)=0 {r}_{10}=4.1 {r}_{20}=4.0 {d}_{1}=0.1 {d}_{2}=0.002 {d}_{3}=0.002 {a}_{1}=0.052 {a}_{2}=0.052 {g}_{1}=1.2 {g}_{2}=1.3 {S}_{1}=0.042 {S}_{2}=0.039 k=2.0end{array}$$
Numerical simulation
The model is implemented using MATLAB programming and its Simulink toolbox. Figure 1 shows the operation of Simulink. We can study the toxicity of microplastic particles by taking different values of response intensity of prey (r11) and predator (r21) to microplastic particles. Furthermore, influence of the decline in prey feeding ability and predatory performance is analyzed by taking different values of ({d}_{1}), (,{d}_{2}) and ({d}_{3}). For the convenience of discussion, we use letter (Delta ) to denote proportion of ({r}_{11}) and (,{r}_{21}) ((Delta =frac{{r}_{11}}{{r}_{21}})).
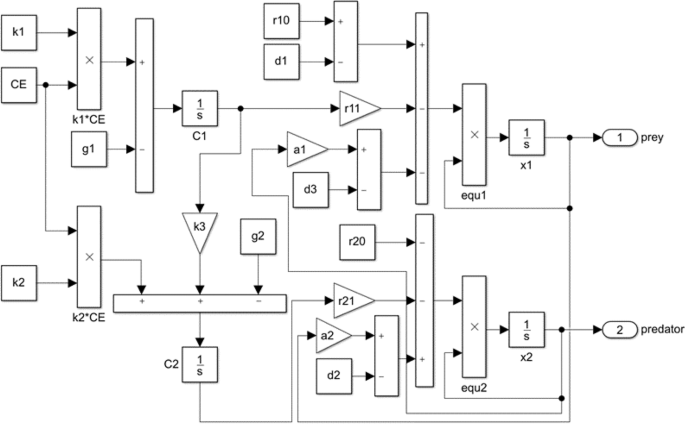
Simulink blocks’ diagram of Modified Lotka-Volterra equations. Simulink provides a simulation environment for editing the model. The integrator block 1/s outputs the number of predators and prey. All the simulations below use this diagram.
Source: Ecology - nature.com