Composition and diversity of the soybean rhizocompartment microbiota in different types of soils
To investigate the microbial composition and diversity of soybeans grown in different soils, we collected three different types of soil from three main soybean production areas including Wuhan (Hubei Province), Siping (Heilongjiang Province), and Luancheng (Hebei Province), and the pH levels of these soils were 5.63 (acidic), 7.2 (neutral), and 8.23 (alkaline), respectively (Supplementary Table S1). Accordingly, we collected root, rhizosphere, nodule, and bulk soil samples as described by Bulgarelli et al. [42] and Xiao et al. [31] (Supplementary Fig. S1). The V5–V7 regions of the 16S rRNA gene were amplified by PCR and sequenced on an Illumina MiSeq platform. In total, 1,797,926 high-quality, nonchimeric sequences were yielded with a median sequence per sample value of 37,457 (range 30,032–44,608) from 48 samples (Table S4). The rarefaction curves of compartment samples based on the OTU numbers are shown in Supplementary Fig. S2a. Sequencing data were rarefied to the lowest number of reads observed in a single sample and 3107 bacterial OTUs were identified. General features of the high-throughput sequencing results as well as taxon numbers at all levels are shown in Supplementary Table S5. The Good’s coverage for the observed OTUs was 98.65 ± 0.08% (mean ± s.e.m.), and except between bulk soil and rhizosphere samples, there were significant differences in the Chao1 index values between the other compartment samples (Supplementary Fig. S2b).
For the bulk soil, the bacterial community composition varied significantly in the different soils (Supplementary Fig. S3). The relative abundances of major microbial phyla, including Acidobacteria, Proteobacteria, and Chloroflexi were significantly higher in acidic soil than those in neutral (Ne) or alkaline (Al) soils, whereas Actinobacteria, Firmicutes, and Gemmatimonadetes were more abundant in neutral (Ne) and alkaline (Al) soils than in acidic (Ac) soil (false discovery rate (FDR) adjusted P < 0.05, Kruskal–Wallis H test) (Supplementary Fig. S4a). The differences in Proteobacteria and Actinobacteria in the three types of soils were even greater in the rhizosphere samples (Supplementary Fig. S4b) but were not observed in root (Supplementary Fig. S4c) and nodule (Supplementary Fig. S4d) samples. The differences in the bacterial composition of the rhizocompartments in different soil types were also observed at the family level, and the trend was consistent with that at the phylum level (Supplementary Fig. S5). In the top ten families, all species in bulk soil samples (Supplementary Fig. S5a), six species in rhizosphere samples (Supplementary Fig. S5b), five species in root samples (Supplementary Fig. S5c), and only two species in nodule samples were significantly different, and belonged to Rhizobiaceae and Bradyrhizobiaceae (Supplementary Fig. S5d). Alpha-diversity analysis (Shannon index) showed that the differences among the soybean root and nodule microbial communities in three types of soils were less pronounced in the tested soils than in the rhizosphere or bulk soil samples (Fig. 1a). A PCoA of Bray–Curtis distances (beta diversity) revealed that the bulk soil (circular), rhizosphere (square), and root (triangle) microbiota in three types of soil exhibited a clear separation (Fig. 1b and Supplementary Fig. S6a). For the nodule compartment, the acid (Ac) and neutral (Ne) soil samples were clustered together but well separated from the alkaline (Al) soil samples (Supplementary Fig. S6b). PERMANOVA based on the Bray–Curtis (Supplementary Table S6) and weighted UniFrac (Supplementary Table S7) distances confirmed that the microbial communities in the three rhizocompartments of soybean were all significantly different (P < 0.01) when grown in the three types of soils.
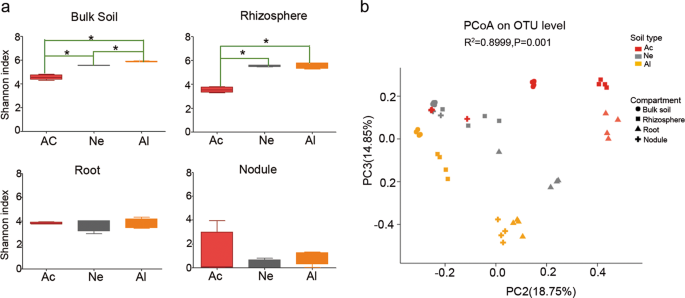
a Alpha-diversity (Shannon indexes) measurements for microbial communities from the acidic soil (Ac), neutral soil (Ne), and alkaline soil (Al) by compartments. Statistical analyses were performed by paired Wilcoxon rank-sum test, and significance is denoted by asterisks where *P < 0.05. Data are presented as median values ± SDs (n = 4). b PCoA of Bray–Curtis distances reveals that soil type is a major source of bacterial community variation in both the rhizosphere and roots. N = 108. Clustering significance by soil type was determined by Adonis (Pr(>F) = 0.001). Each point corresponds to a different sample colored by soil type, and each compartment is represented by a different shape.
Microbial cooccurrence and interaction networks in the different rhizocompartments
The interaction between different microbial strains is one of the main driving factors of population structure and dynamics, because microbes can cooccur or exclude each other [51, 52]. Hence, we next used Networkx software to analyze the interaction networks in different compartments. The Spearman correlation values between genera were calculated based on their occurrence patterns across samples from the three different soil types. Our results showed a high level of node connectivity within the rhizocompartment microbiota. In an analysis of the top 30 bacteria at the genus level, there were 202 correlations in the bulk soil (Fig. 2a and Supplementary Table S8), 184 correlations in the rhizosphere (Fig. 2b and Supplementary Table S9), 90 correlations in the root (Fig. 2c and Supplementary Table S10), and 185 correlations in the nodule (Fig. 2d and Supplementary Table S11) samples. These results suggest that the interaction networks in the rhizosphere and root are relatively simple compared with that in bulk soil. In nodules, the correlation among bacteria increased while microbial network complexity declined. With the exception of Bradyrhizobium being negatively correlated with Sinorhizobium (−0.847637), Rhodococcus (−0.623598), and unclassified_f__Alcaligenaceae (−0.770069), the connectivity indicated that all of the other genera were positively correlated (Fig. 2d), suggesting that these taxa can cooccur with rhizobium in soybean nodules and will not exclude each other. In addition, we found that the negative correlation between Bradyrhizobium and Sinorhizobium (−0.70403) was also observed in rhizosphere samples. Furthermore, Bradyrhizobium and Sinorhizobium were correlated (positive and negative) with 14 and 13 other different rhizospheric genera, respectively (Fig. 2b and Supplementary Table S9), which may affect the nodulation of these two types of rhizobia.
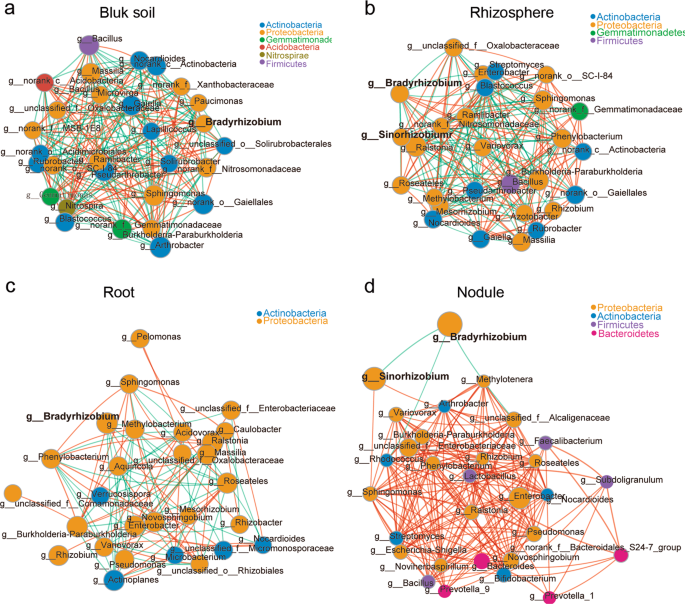
The interaction network of dominant microbiota at the genus level (top 30) in the bulk soil (a), rhizosphere (b), roots (c), and nodules (d). The size of the nodes shows the abundance of OTUs, and the different colors indicate the corresponding taxonomic assignment at the phylum level. The edge color represents positive (red) and negative (green) correlations. The edge thickness indicates the correlation values; only significant interactions are shown (r > 0.6; P < 0.05).
The composition of rhizobia in soybean nodules is soil condition-dependent
Among the natural acidic or neutral-soil nodule communities (Fig. 3a–I), Bradyrhizobium was the most abundant genus, making up ~99.97% of the total abundance; by contrast Sinorhizobium was dominant in the nodules from the alkaline soil (98.56%) but very rare in the acidic (0.081%) or neutral-soil nodules (0.007%) (Fig. 3b–I). To further explore the influence of soil factors on the composition of rhizobia in the nodules, we conducted artificial interference on the planted soil. First, we changed the pH of the acidic or neutral soil by supplementing with lime (pH 8.2) (Fig. 3a–II); second, we mixed acidic or neutral soil with alkaline soil (1:1; w/w) (Fig. 3a–III); last, we heated the soil at 80 °C for 20 min (Fig. 3a–IV) before plant cultivation. Sterilized soybean seeds were grown in these soils for 28 days, and the rhizosphere soils (28 samples) and nodules (28 samples) were collected as described above. Amplification and sequencing of these 56 samples yielded 2,703,009 high-quality sequences (average of 48,268 and range of 30,585–95,823 sequences per sample) (Supplementary Table S12). Rarefaction curves of the samples from the two compartments based on the OTU numbers are shown in Supplementary Fig. S7. The sequences were clustered into OTUs using the same criteria as those described above, yielding 2830 microbial OTUs and the Chao1 and Shannon indexes of the two compartments were significantly different (FDR adjusted P < 0.001, Wilcoxon rank-sum test) (Supplementary Table S13).
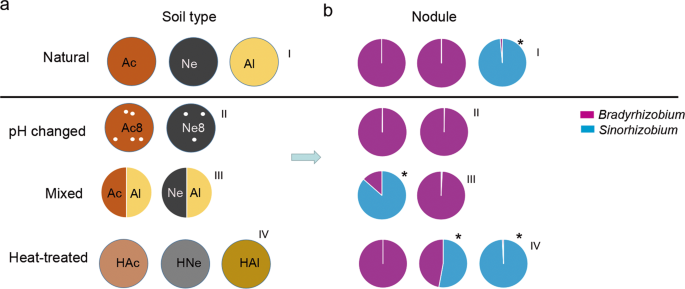
a Schematic diagram of the soil treatments. Acidic soil (Ac), neutral soil (Ne), alkaline soil (Al), acidic soil plus lime (Ac8), neutral soil plus lime (Ne8), heated acidic soil (HAc), neutral soil (HNe), alkaline soil (HAl), alkaline soil amended with 50% (w/w) acidic soil (Ac/Al) or neutral soil (Ne/Al). b Relative abundance of Bradyrhizobium and Sinorhizobium in nodules of plants planted in the soil shown in a. I, II, III, and IV represent normal, pH changed, mixed, and heat-treated soils, respectively. Purple represents Bradyrhizobium. Blue represents Sinorhizobium. Asterisks show that the relative abundance of Sinorhizobium was higher than that of Bradyrhizobium.
Upon alteration of the pH of acidic or neutral soils to create alkaline conditions, the abundance of Sinorhizobium in root nodules was not increased (Fig. 3b–II and Supplementary Table S14), implying that, in addition to soil pH, other factors in the soils may also affect the composition of rhizobia in nodules. When soybean was grown in the acidic–alkaline mixed soil (pH 6.93), the relative nodule abundance of Sinorhizobium (86.56%) exceeded that of Bradyrhizobium, while in neutral–alkaline mixed soil (pH 7.71), the nodule abundance of Sinorhizobium was not significantly changed (Fig. 3b–III and Supplementary Table S14). Further heat-treated experiments showed that, in heat-treated neutral soil, the relative abundance of Sinorhizobium in nodules was significantly increased (54.64%, Supplementary Table S14). However, this change was not found in soybean plants grown in heat-treated acidic soil (Fig. 3b–IV). These results together suggested that the effect of planted soil on the composition of rhizobia in nodules was complex and not dependent on the soil pH alone.
Rhizosphere microbiomes were associated with nodulation of rhizobia
To determine whether the change in the composition of rhizobia in the nodules was related to the rhizospheric bacteria, we analyzed the microbial community composition of ten rhizosphere samples and conducted a cluster analysis. The hierarchical clustering results of the heatmap analysis divided the ten rhizosphere samples into three main clusters based on the dominant phyla, and the three clusters hosted distinct bacterial assemblages at the phylum level (Fig. 4a). These clusters were confirmed by a PCoA based on the Bray–Curtis distances and PERMANOVA (P < 0.05) (Supplementary Table S15), and obvious clustering among the ten soil treatments was observed. The primary axis of variation (explaining 37.9% of the overall variation) separated cluster 3 (Ac, Ac8, and HAc) and cluster 2 (HNe and HAl) from cluster 1 (Ne, Ne8, Al, Ac/Al, Ne/Al, HNe, and HAl), while the secondary axis of variation (explaining 20.6% of the overall variation) distinguished cluster 2 from cluster 3 (Fig. 4b).
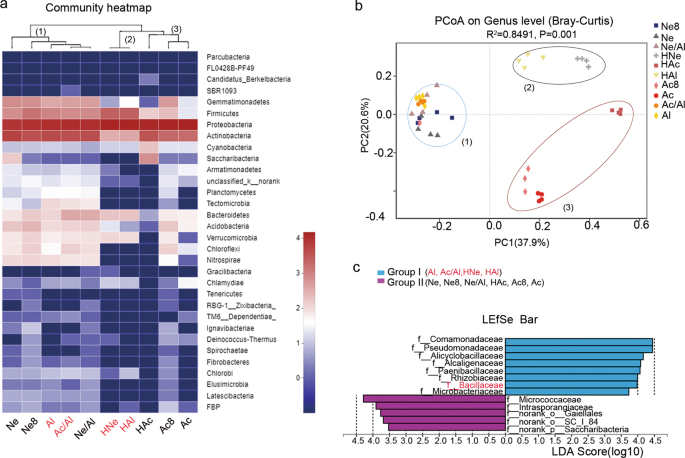
a Composition and clustering of bacterial microorganisms from different rhizosphere samples on the phylum level. b PCoA analysis based on Bray–Curtis distances of the rhizosphere microbiomes of soybean seedlings grown in soils shown in Fig. 3a; n = 40. Clustering significance was determined by Adonis (Pr(>F) = 0.001). Acidic soil (Ac), neutral soil (Ne), alkaline soil(Al), acidic soil plus lime (Ac8) and neutral soil plus lime (Ne8), alkaline soil amended with 50% (w/w) acidic soil (Ac/Al) or neutral soil (Ne/Al) and heated acidic soil (HAc), neutral soil (HNe), alkaline soil (HAl). c Linear discriminant analysis (LDA) coupled with the effect size measurements identifies the significant abundance of data in b. Taxa enriched in Group I (purple) and Group II (blue) are indicated with LDA scores, respectively. Only taxa with LDA values greater than 3.5 (P < 0.05) are shown.
Next, we divided these ten treatments into groups I (Al, Ac/Al, HNe, and HAl) and group II (Ne, Ne8, Ne/Al, Ac, HAc, and Ac8) according to the composition of rhizobia in the nodules (Fig. 3b) and utilized the linear discriminant analysis effect size (LEfSe) algorithm. The results showed that eight and five families (LDA log score threshold >3.5 and P < 0.05) most likely explained the differences between groups I and II, respectively. Comamonadaceae showed the highest LDA score (5.16) in group I, followed by Pseudomonadaceae (4.89), Alicyclobacillaceae (4.09), Paenibacillaceae (4.7), Rhizobiaceae (3.99), Bacillaceae (3.98), and Microbacteriaceae (3.73), which were identified as the dominant key families in group I and may be related to Sinorhizobium nodulation. In comparison, indicator bacteria in group II clustered into the families Micrococcaceae (4.29), Intrasporangiaceae (3.90), norank_o__Gaiellales (3.77), norank_o__SC_I_84 (3.68), and norank_p__Saccharibacteria (3.52), which may be involved in Bradyrhizobium nodulation.
Differential effects of Bacillus on the growth of rhizobia in vitro
Among the above indicated families, Bacillaceae are beneficial microorganisms in plant–microbe interactions that have been detected in many plants rhizospheres and are well-known for their plant disease resistance- and plant growth-promoting properties [53,54,55]. The facts that Bacillaceae (4.30% of OTUs in group I) was present in high abundance in alkaline rhizosphere samples (Supplementary Fig. S5b) and Bacillus showed a significant positive correlation (r = 0.714537) to Sinorhizobium in rhizosphere samples (Fig. 2b and Supplementary Table S9) promoted us to explore a possible mechanistic role of Bacillus in rhizobial nodulation. To this end, we isolated the candidate Bacillus strains from alkaline soil by heat treatment. First, 278 candidate Bacillus isolates were selected and their interactions with S. fredii CCBAU45436 were examined on YMA medium (0.7% agar). The results showed that a group of isolates (~12.6%), which had similar morphology, significantly promoted the growth of S. fredii CCBAU45436. The rest of the tested isolates showed little or no effect on the growth of CCBAU45436 (Supplementary Fig. S8). Three representative isolates (B-9, B-11, and B-13) with obvious promoting effects were identified as the Bacillus cereus group (belonging to OTU1511) by 16S rRNA-based methods (Supplementary Table S16). To further identify these strains on the species level, we conducted genome sequencing by Illumina Hiseq platform. Based on their average nucleotide identity (ANI) values, the three strains were reclassified as Bacillus albus B-9 (95.61% ANI to B. albus N35–10–2), B. cereus B-11 (97.98% ANI to B. cereus ATCC 14579), and B. albus B-13 (98.26% ANI to B. albus N35–10–2) (Supplementary Table S17).
When CCBAU45436 and three Bacillus strains were cocultured at different distances (0.6 or 1.2 cm) on the YMA medium for 4 days, the colony diameters (1.14 cm) of S. fredii CCBAU45436 at a 0.6 cm distance (to Bacillus) were significantly greater than those of colonies (0.91 cm) located at the 1.2 cm distance (Fig. 5a, n = 12, P < 0.0001, nonparametric Mann–Whitney tests). More interestingly, when B. diazoefficiens USDA110 and Bacillus were cocultured on YMA medium, the growth of USDA110 adjacent to Bacillus was markedly inhibited (Fig. 5b), becoming elliptical (Fig. 5c). The obvious growth promotion of CCBAU45436 and inhibition of USDA110 were not observed with Pseudomonas strains (also isolated from alkaline soil) (Supplementary Fig. S9). In addition, Bacillus also stimulated S. fredii CCBAU45436 growth but inhibited B. diazoefficiens USDA110 growth in the gamma-radiation-sterilized alkaline soil (Supplementary Fig. S10). Collectively, these results indicated that the B. cereus group may specifically promote and inhibit the growth of CCBAU45436 and USDA110, respectively, once again indicating an interaction of the Bacillus genus with rhizobia.
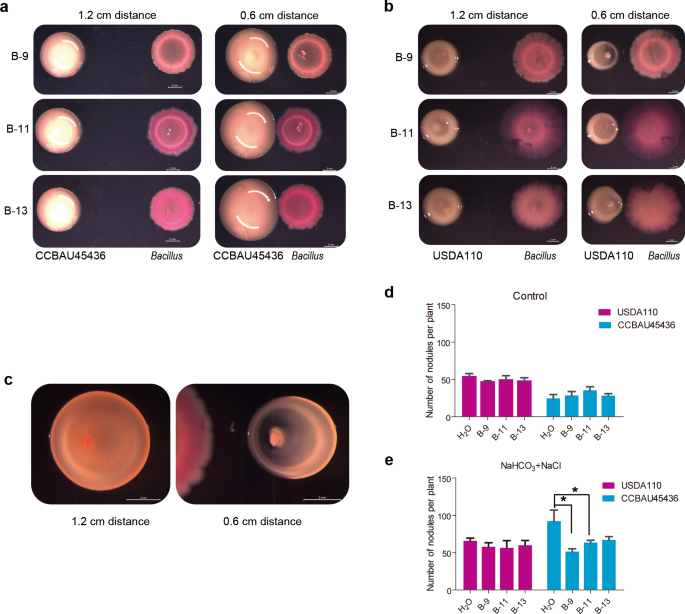
a Bacillus colonies were inoculated next to a S. fredii CCBAU45436 colony at distances of 1.2 cm or 0.6 cm on a YMA plate. b Bacillus colonies were inoculated next to a B. diazoefficiens USDA110 colony at distances of 1.2 cm or 0.6 cm. c The growth phenotype of B-13 after contact with S. fredii CCBAU45436 in a. d The reverse colony of B. diazoefficiens USDA110 inoculated next to Bacillus B-9 in a. The results represent one of three replicates with similar results. The scale bar represents 2 mm. e The nodule numbers of CCBAU45436- or USDA110-inoculated plants treated with H2O or Bacillus under control conditions. f The nodule numbers of CCBAU45436- or USDA110-inoculated plants treated H2O or Bacillus under saline–alkali conditions (25 mM NaHCO3 + 75 mM NaCl); the experiment was repeated twice. Statistical analyses were performed by Mann–Whitney nonparametric tests and significance is denoted by asterisks where * indicates P < 0.05. Data are presented as median value ± SD (n = 4).
Bacillus alleviates the effect of saline–alkali conditions on the nodulation phenotype of CCBAU45436 in the greenhouse
Next, we examined the effect of Bacillus on the nodulation ability of CCBAU45436 and USDA110 in the greenhouse, and added different concentrations of sodium percarbonate and sodium chloride to vermiculite to simulate salt–alkali conditions [56]. Under control conditions (pH 7), the nodule number of soybeans inoculated with USDA110 (63) was more than that in plants inoculated with CCBAU45436 (54), but the difference was not significant. With the increase in pH (concentrations of bicarbonate ions), the nodule number in both rhizobia-inoculated plants increased, but the nodule number of plants inoculated with CCBAU45436 increased more obviously than that under the control conditions (Supplementary Fig. S11c), and the highest nodule number (165) was associated with smaller size (Supplementary Fig. S11a) and leaf chlorosis (Supplementary Fig. S10b) at pH 8 (25 mM NaHCO3 + 75 mM NaCl). For the USDA110-inoculated plants, the number of nodules was highest (128) at pH 8.5 (50 mM NaHCO3 + 50 mM NaCl) (Supplementary Fig. S11c), and the chlorosis was less severe than that of CCBAU45436-inoculated plants (Supplementary Fig. S11b).
Bacillus treatment did not significantly affect the nodule numbers of plants inoculated with either CCBAU45436 or USDA110 in pH 7 (control) conditions (Fig. 5d); in sharp contrast, Bacillus treatment (B-9 and B-11) restored the nodule phenotypes (reduced nodule number) of the CCBAU45436-inoculated plants, whereas Bacillus did not affect the nodule number or size of the USDA110-inoculated plants under pH 8 (25 mM NaHCO3 + 75 mM NaCl) conditions (Fig. 5e). Taken together, these results indicate that CCBAU45436-soybean symbiosis is more sensitive to pH than that of USDA110, and Bacillus can alleviate the inhibitory effect of pH on CCBAU45436-soybean symbiosis.
Bacillus affects colonization efficiency of Sinorhizobium in nodules
To further investigate the role of Bacillus in the colonization of Bradyrhizobium and Sinorhizobium in soybean nodules, we conducted mixed rhizobial inoculation experiments. Three Bradyrhizobium and three Sinorhizobium strains were coinoculated onto soybean plants with or without Bacillus under saline–alkali (pH 8) conditions (Fig. 6a). Sinorhizobium and Bradyrhizobium were more resistant to alkali and acid conditions, respectively (Supplementary Fig. S12a), which is consistent with previous studies [57]. At 28 days after inoculation, the populations of Sinorhizobium or Bradyrhizobium in the nodules were expressed as the gene copies of mlr6601 or nodC, respectively, that were quantified by qPCR using genus–specific primers (Supplementary Table S3 and Fig. S12b). Their respective standard curves were obtained using serial dilutions of CCBAU45436 and USDA110 genomic DNA (Supplementary Fig. S12c). Similarly, there were no significant differences in the populations of Sinorhizobium or Bradyrhizobium (gene copies) in nodules with and without Bacillus treatment under the control conditions (Fig. 6b). After saline–alkali treatment, the gene copies of mlr6601 (Sinorhizobium) in nodules were slightly increased (0.224 up to 3.617 × 10⁵), but significantly increased (up to 13.252 × 10⁵) after coinoculated with Bacillus (Fig. 6b, c). The gene copies of nodC (Bradyrhizobium) before and after inoculation with Bacillus were also decreased, but the difference was not significant (Fig. 6c). In addition, we amplified the marker genes of Bacillus in nodule samples with the specific primers (OPL-114F-lipo and OPL-114R-lipo) [58], and no bands were detected (data not shown), suggesting that the inoculated Bacillus did not enter the nodules. Together, these results show that Bacillus may indirectly promote the colonization of Sinorhizobium in nodules in a manner dependent on alkali conditions.
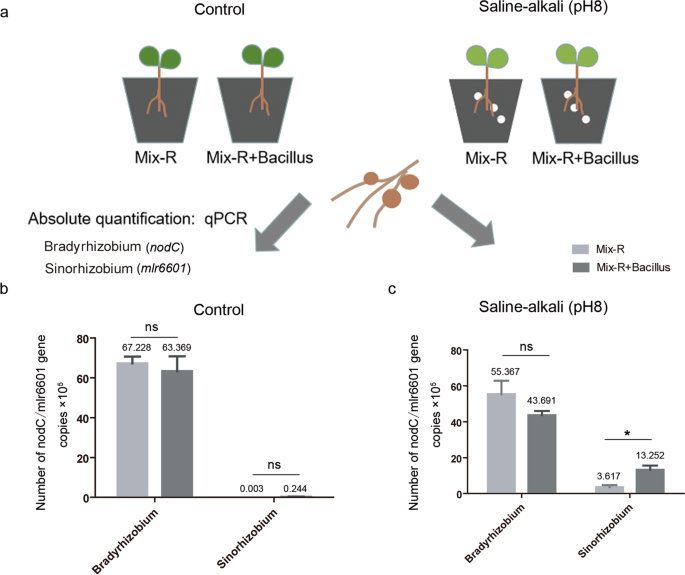
a Schematic representation of the mixed inoculation experiment, showing the planting, inoculation, and quantitative detection methods. Three-day-old plants were transplanted into control or saline–alkali-treated vermiculite, and then plants were inoculated with mixed rhizobia or mixed rhizobia containing Bacillus. Twenty-eight days later, the bacteroid DNA of the nodules was extracted, the concentrations of two kinds of rhizobia were quantified by qPCR, and the experiment was repeated twice. b The populations of Sinorhizobium or Bradyrhizobium bacteroids under control conditions. c The populations of Sinorhizobium or Bradyrhizobium bacteroids under saline–alkali conditions. Mix-R indicates six strains of rhizobium. qPCR results of the Mix-R and Mix-R + Bacillus treatments were analyzed with nonparametric Mann–Whitney tests (n = 4, ns nonsignificant; *P < 0.05). The horizontal bars of each graph indicate the median values and are listed where appropriate for clarity.
Source: Ecology - nature.com

