Prevalence of E. coli
The prevalence of E. coli and total coliform colony-forming unit per milliliter (cfu mL−1) is presented (Table 1) along with in-situ parameters such as pH, electrical conductivity (EC), total dissolved solids (TDS), oxidation–reduction potential (ORP), salinity, and temperature. E. coli in the river ranged between 19,467 and 76,600 cfu mL−1, which is an alarmingly higher number compared with the lakes and Sewage Treatment Plants (STPs) (except for influent at Juhapura STP). Sardar Bridge at Sabarmati Riverfront (R2) exhibited the highest E. coli count owing to dynamic river–human interface, substantial wastewater discharge into the river, and stagnant water flow.24 Further, E. coli value obtained in this study are much higher than the reported average fecal coliform count (FCC) in the Ganges near Varanasi (except at Varuna River confluence, i.e., 2.0 × 10⁵ cfu mL−1 of FCC45) and in Wenyu River China (1.7 × 10⁴ cfu mL−1).46 Even in the extreme lower reaches of the Ganges, i.e., West Bengal stretch, the reported FCC was much lower with the most probable number (MPN) of 75–2950 mL−1 of samples than the one obtained in the present study.47 The observed E. coli prevalence (cfu mL−1) in the Sabarmati River was higher than several tropical rivers like in Chao Phraya River (70), Nan River (4.8), Ping River (42), Wang River (0.47), and Yom River (5.4) in Thailand,28 as well as Damodar River (70) in India.1
Among the lake samples, the prevalence of E. coli was ~5 times higher at Kankaria Lake (KL) (15,333 cfu mL−1) than Chandola Lake (CL) (3467 cfu mL−1), owing to higher recreational activities at KL, i.e., 13000–15000 tourists/day.48 The maximum statistical threshold value allowed as per the Recreational Water Quality Criteria for all fresh water body types designated for “primary contact recreational use” is 4.1 cfu mL−1 that still may cause 36 illness per 1000 recreators49. The guideline of Indian agency like Central Pollution Control Board allows <500 MPN 100 mL−1 and <5000 MPN 100 mL−1 for drinking water source and bathing, respectively. As per these regulations, none of the water bodies sampled in this study qualifies for being used as a source for drinking water even after conventional treatment and disinfection and/or recreational activities.
The prevalence of E. coli in STP ranged from 2893 to 96,393 cfu mL−1 with a reduction ratio of 14.53%, 31.45%, and 90.1% at S1, S2, and S3, respectively. Significant observations made are as follows: (i) all three STPs have different level of incoming fecal contamination as reflected by 4× and 20× prevalence at S1 and S3 than that of S2, (ii) E. coli reduction ratio depends on both prevalence and disinfection practices, and (iii) water at KL and several locations of the river shows the imprints of wastewater. The prevalence of E. coli noticed in the present study was similar to the influent of WWTP in southern Austria that ranged between 20,000 and 61,000 cfu mL−1 .16 A slight difference between total coliform and E. coli counts suggests that the STP water, both influent and treated, mainly comprised E. coli.
Occurrences of Antibiotic-Resistant Bacteria
Figure 1 illustrates the sensitivity towards six antibiotics used in this study. River locations R1 and R3 showed 0% antibiotic resistance, whereas location R2 showed 40% resistance towards all antibiotics, except 60% resistance for Kanamycin Monosulphate (KM) (Table 2). Similar to the case reported for Chaophraya River and its tributaries,28 the highest resistance in the Sabarmati was observed at the central urban location, (R2) between R1 and R3. It implies that the degree of resistance depends on urbanization and related discharge condition rather than the upstream condition. Among the lake samples, despite having 5× prevalence of E. coli at KL than CL, KL exhibited 0% resistance towards all six antibiotics, whereas CL showed up to 60% resistance for Tetracycline (TC), and ST, and 40% resistance to Norfloxacin (NFX). Such observation suggests that even if discharge received by CL has less E. coli, but most of them have already gained resistance before being discharged to the Lake. This is more likely, as CL occasionally receives runoff from Pirana open solid-waste dumping site.50
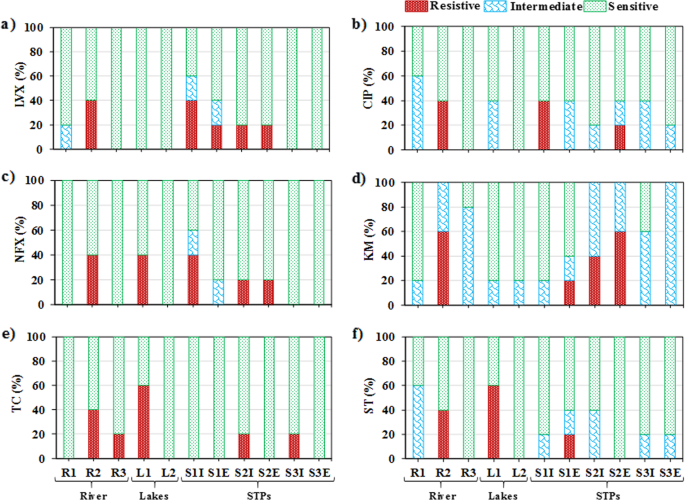
Bar diagram showing percentage sensitivity towards antibiotics (resistive, intermediate and sensitive) for (a) LVX, (b) CIP, (c) NFX, (d) KM, (e) TC, and (f) ST for three locations of Sabarmati River (R1–R3), Kankaria Lake (L1), Chandola Lake (L2), and three STPs (S1–S3) with I-influent, E-effluent.
Among STPs, the influent of S1 showed 40% resistance to a fluoroquinolone and 0% resistance to non-fluoroquinolone. High resistance for fluoroquinolone is usually reported for the influents of domestic origin,13,23 as they are generally prescribed to treat a variety of illnesses such as respiratory and urinary tract infections. Influent of S2 showed a 20% resistance to Levofloxacin (LVX), NFX, and TC, 40% resistance to KM but S3 influent showed 0% resistance to all antibiotics, except TC. Overall, there is no consistent pattern except the high resistance to fluoroquinolones as is the case with the Chaophraya River, Thailand, and its tributaries.28 Owing to high price affordability by urban dwellers, the resistance to fluoroquinolones was higher at urban locations, whereas location (L2) near slum areas exhibited higher resistance for cheaper non-fluoroquinolones (NFQs). In S1 and S2, resistance for some antibiotics increased after treatment, similar to the studies reported from Austria and Sweden.16,51
The abundance of E. coli and antibiotic resistance had significantly increased from upstream to downstream in Zenne River, Belgium, especially after the confluence of Brussel’s WWTPs discharge.52 The municipal wastewater containing high density and diversity of bacteria, nutrients, exposure of antibiotics, chlorine, detergents, long retention time, and aeration enhances the generation and replication of ARB. The most probable reason for the increase in resistance may be longer contact time with the wastewater.53 Overall, the ARB and ARG increment or decrement or any substantial change is truly an unpredictable outcome in the treatment process.54
Comparative Evaluation of Urban Water Bodies
A box plot for the gross comparison of antibiotic resistance in different water resources of the city has been provided in Fig. 2a. The E. coli resistance to TC was not found in the effluent of STPs hinting at efficient removal of TC with soil and sediment during primary treatment. As TC does not show any biodegradation during the biodegradability test, sorption is expected to be the main process of TC removal in activated sludge-based treatment process.55 Thus, the fate and transport of TC are greatly influenced by strong adsorption to clay materials,56 soils, and sediments.57,58,59 Resistance to fluoroquinolone (LVX, Ciprofloxacin (CIP), and NFX) was found higher in the river and influent of STPs, whereas the resistance to LVX and CIP was not found in lakes. This result may be attributed to the consumption pattern of antibiotics in the urban area as well as seasonality. This holds true due to the fact that fate and transport of Fluoroquinolone are not only affected by adsorption59,60 but photo-degradation and biodegradation too.61 This is also why the resistance of CIP was found to be decreased in STPs.62,63 There are reports of antimicrobial removal agents in WWTPs through biodegradation and/or sorption.10,64 Therefore, the chemical properties of antimicrobial agents are going to be the governing factors for the extent of antimicrobial resistance in the STPs.
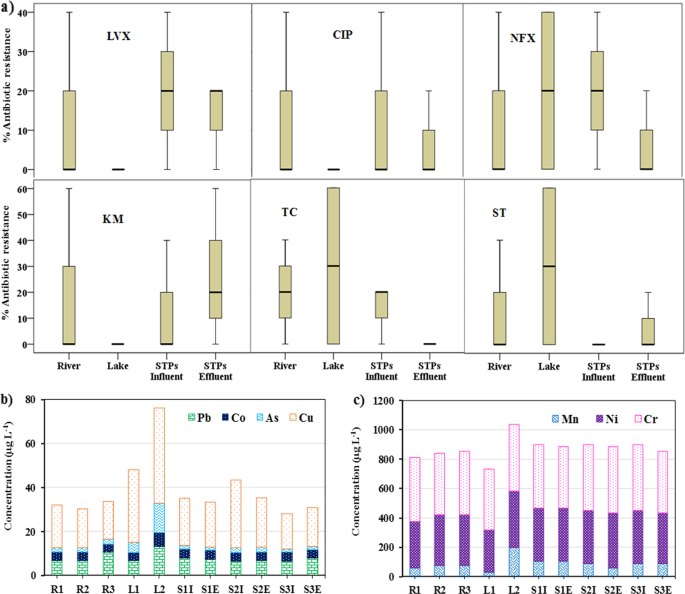
The comparison in the different water source, i.e., river, lake, STPs influent and effluent for (a) antibiotic resistance and (b, c) metal.
Further, to compare the status of anthropogenic impacts, the status of metal pollution in these water bodies was also investigated. CL exhibits the highest concentration of metal (Fig. 2b, c), with Pb and As being even higher than the acceptable limit (Indian Standard IS 10500:2012). This may be attributed to leachate received by lake from Pirana open solid-waste dumping site and anthropogenic sources.65,66 Trend of average metal concentrations in rivers, lakes, and STPs were similar, i.e., Cr > Ni > Mn > Cu > Pb > Co ≥ As, implying the same source of pollution, i.e., runoff.67 Interestingly, Zn and Cd concentrations were lower, and Ni and Cr were higher than the acceptable limit for drinking water in all the samples.68 Sewage seems to be the sources of Co, Mn, and Pb into the river water,69 whereas Cr seems to be attributed from laundry chemicals, mordents, and dyes in the textiles, leather tanning industry, road runoff due to tire wear, pigments, and paints.70 Although the exhaustive use of fertilizers in agricultural imparts metals such as Zn, Ni, As, Cd, Pb, and Hg, it is worth mentioning that the average concentrations of Mn, Zn, Cu, Cd, Cr, Ni, and Pb in the Ganga River, India, in three different seasons varied from 132 to 423, 63 to 84, 5 to 6, 1 to 3, 14 to 20, 30 to 60, and 7 to 20 µg L−1, respectively.71
Correlation between Occurrence of Resistance and Prevalence of E. coli
Few correlations in the field of ARB/ARG research are still being investigated, such as the relationship between the resistance and the consumption of antibiotics;72,73,74 correlations between the concentration of antibiotics present in the water and similar prevalence of ARG and ARB;75,76 and prevalence of E. coli and extent of ARB. A study reported an association between antibiotic residues in sewage effluent and the presence of antibiotic-resistant pathogens.77 However, no effort has been made to investigate the later correlation among different water bodies. Thus, all the resistance observed for all six antibiotics studied were plotted against their corresponding E. coli count and classified as per their origin, i.e., river, lake, and STP, to evaluate the relation between the prevalence of E. coli and their resistance (Fig. 3a). Interestingly, the correlation observed for river was significantly higher (R2 = 0.89) than that of lake (R2 = 0.32) and STP (R2 = 0.12). Definitely, in the present case, lack of flow in the Sabarmati river is responsible for higher correlation for river, yet the finding is subjected to further monitoring.
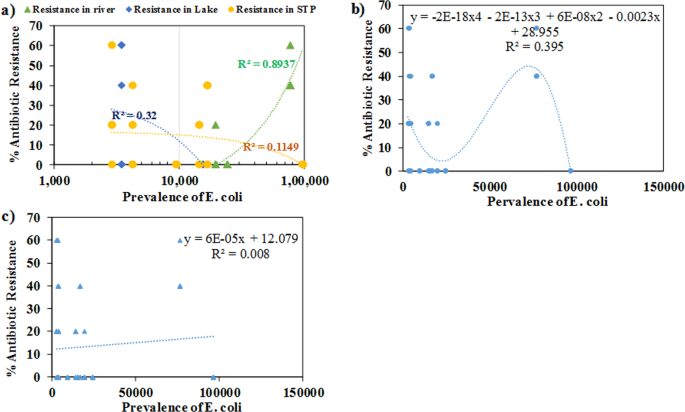
Trend showing antibiotic resistance percentage with prevalence of E. coli (a) separately in river (R2 = 0.894), lake (R2 = 0.320), and STP (R2 = 0.115), (b) combined in river, lake, and STP with polynomial of 4° (R2 = 0.395), (c) combined in river, lake, and STP with linear relationship (R2 = 0.008).
The overall trend for all samples together irrespective of their origin, shown in Fig. 3b exhibited R2 = 0.40 and a polynomial relation of antibiotic resistance expressed up to the power of 4 of the prevalence. For linear fitting for the same, however, we get almost no relation, i.e., R2 = 0.008 (Fig. 3c). Similar weak linear correlation (R2 = 0.003–0.07) was reported between the antibiotic concentration and numbers of resistance genes/bacteria by Gao et al.76 Such weak linear relationships can be explained by the following: (i) prevalence of E. coli is indicator of fecal pollution but not the amount of antibiotic used or their resistance ability; (ii) an antibiotic-free water body provides a better place for E. coli growth; (iii) at STPs, the bacteria got concentrated in sludge and require higher concentration of chlorine for being killed;78 and (iv) the number of colonies was found to be decreased by 99.999% of multi-drug resistant within 60 min of contact time with the chlorine dosage >2.0 mg L−1.79,80 These explanations need to be further substantiated through rigorous monitoring and further statistical analyses using regional and worldwide data.
Microplastic Contamination
Microplastic was ranging from as small as 75 µm to 212 µm and then 212 µm to 4 mm, respectively, from the Sabarmati River sediments. The most startling fact was that microplastics were not found in the upstream of Ahmedabad city and gradually increased after entering to the city with the highest amount of microplastic detected in the vicinity of Pirana landfill. At Pirana-Gyaspur bank of the river, 47.1 mg of microplastics of large category (Fig. 4a) and 4 mg of small-sized microplastic particles were found (Fig. 4b). More specifically, location US1 before the entrance in the city showed a negligible abundance of microplastics in the sediment (Fig. 4a, b). US2 location had exhibited an increase in abundance and the maximum quantity of microplastics was observed at US3 near to Pirana dumping site. The source of microplastics was illegal dumping.81 This particular location of US3 showed a seven-time increase in quantity compared with location US2. This location was very near to the location the highest antibiotic resistance was noticed.
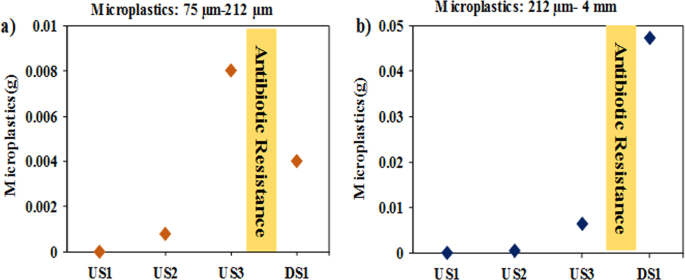
Microplastic (a) 75–212 µm, (b) 212 µm−4 mm at various location US1–IITGN campus, US2–Indira Bridge, US3–Subhash Bridge before the location R1, and DS1–Gyaspur after the location R3.
Improper waste disposal, insufficient waste management, urban runoffs, and washing machine effluent are supposed to be the significant sources of microplastic in an urban setup like Ahmedabad.44,45,47 Larger plastic debris that degrades into smaller pieces while being exposed to the sun and weathering also adds to the microplastic generation. Pirana solid-waste dumping site adds a huge quantity of microplastics through runoff, especially during wet weather.
Water Quality Influence on Antibiotic Resistance through Multivariate Analyses
Bivariate statistical relation i.e. correlation matrix (Table S3) was not enough to delineate the relationship between traditional water quality parameters and emerging issue of antibiotic resistance. Therefore, multivariate statistical analyses like principle component analysis (PCA) and cluster analyses were performed and presented in Fig. 5a, b. Table 3 shows four principle components (PCs) explaining 71% of cumulative data variance. Several authors use X–Y plot of the first two PCA loading for visual interpretation; however, if first two loadings are <50%, it is always recommended to use 3D loading expressions for more robust visual interpretation.
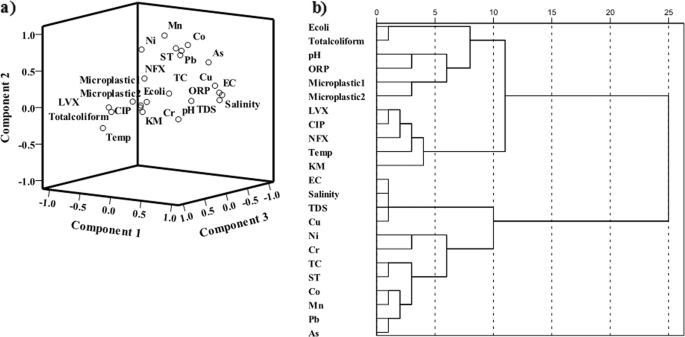
a Three-dimensional principal component diagram, (b) cluster analysis of river, lake, and STP antibiotic resistance percentage with prevalence of E. coli, in-situ parameter, and metal (Microplastics1: 75–212 µm, Microplastics2: 212 µm–4 mm).
In general, 50% of the variation could be explained by EC, TDS, salinity, metal (Cu, As, Pb, Co, Mn, and Ni), and antibiotic resistance for ST and TC. Fluoroquinones resistance and fecal contamination are represented by PC3 and PC4, respectively, explaining ~25% of the variation in the data. The first component (PC1) loading does not exhibit any significant loading for antibiotic resistance but for EC, TDS, salinity, Cu, and As, implying that metal contamination is the first problem in the area. Simultaneously high component loadings for metal as well as for antibiotic resistance exhibit the presence of cross-resistance between ST and TC similar to various other studies.28,82 This also indicated that people are suffering more from intestinal infection and KM seems to be not in much use. The third component (PC3) represented by LVX, CIP, NFX, and temperature implies resistance to fluoroquinolones and cross-resistance within this class as reported in the previous study.28,83,84 The loading of three fluoroquinolones with temperature is an interesting result, as it hints at common usage of these antibiotics during monsoon/summer and further relates to runoff introduced contamination in the urban waters. Principle component 4 shows higher loading for E. coli and total coliform, accounting 11% variance in the data, which substantiates the fact that the percentage of antibiotics resistance is not correlated with the prevalence of E. coli. Among the two types of microplastic, only the smaller size (microplastic 1) shows the loading of 0.34 and 0.39 in PC3 and PC4, implying they are aligning towards antibiotic resistance and fecal contamination. The relationship between microplastic and antibiotic resistance needs to be further investigated in the urban water resources. This is especially because the microplastic cannot be removed by primary or secondary treatment plants, owing to their small size and buoyancy, and thus become critical from the safe water-supply perspective.
Likewise, cluster analyses further explain the association of water quality parameters, the prevalence of E. coli, total coliform, microplastic, and antibiotic resistance. Three major groups are clearly evident in the dendrogram (Fig. 5b), starting from the most significant cluster at the bottom comprising EC, TDS, salinity, metal, and resistance for TC and ST. This cluster is highly dominated by industrial effluents leading to metal contamination related to dissolved solids and first-generation antibiotics mainly used in animal husbandry. Resistance for the remaining four antibiotics tested in this study clustered together with temperature, which showed closer association with another cluster comprising fecal coliform, microplastic, pH, and ORP. Thus, it may be the inference that among water quality pH and ORP are more sensitive parameters for antibiotic resistance. Overall, it can be concluded that resistance for fluoroquinolones are attributed to fecal pollution catalyzed by high, untreated runoff mixing to the urban water bodies during monsoon season, and the resistance for ST and TC are mainly due to their prevalent use for animal husbandry.
The higher prevalence of E. coli and its antibiotics resistance indicate deteriorated water quality of Sabarmati riverfront, KL, and CL due to the dynamic river–human interface, point sources of wastewater discharge, and stagnant water. Rivers themselves have a self-purification mechanism, but limited water supply in riverfront leads to stagnancy and more human interference leads to higher resistance. For the lake like a closed system, E. coli prevalence mainly depends upon the fecal contamination, whereas for antibiotic resistance, the condition of the catchment is also essential. In CL, prevalence is very less compared with KL, but has a relatively higher antibiotic resistance, which is due to nearby dumping site and slum areas. The antibiotics resistance shows no significant correlation with E. coli prevalence, indicating the need to include resistance as a necessary biological water quality parameter. Microplastic of smaller size showed some association and influence on antibiotic prevalence; however, this relationship needs to be further investigated in the urban water resources. Variation in various in-situ parameters shows an increment towards a specific form of resistance, which can be affirmed via further research and experimentation. The wastewater containing antibiotics should be discharged after proper tertiary treatment. Further research should be carried out to understand different methods, their efficiency, reasonable cost for removal of antibiotics, and disinfection of pathogenic bacteria, so that optimum drinking water quality to the people of developing countries like India could be maintained and the United Nations Sustainable Development Goals may be realized.
Source: Resources - nature.com


