Data sources and study settings
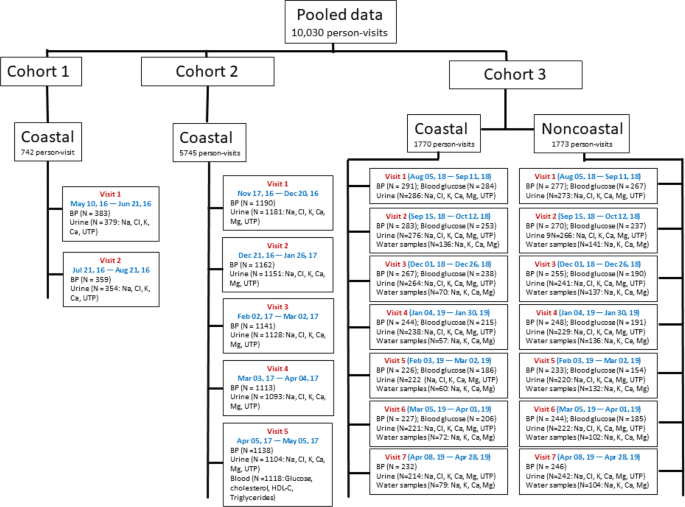
We included 10,034 person-visit data from three cohort studies in Bangladesh (Fig. 2), all of which were conducted by the International Centre for Diarrhoeal Disease Research, Bangladesh (icddr,b). The first cohort was a pilot study conducted in the 2016 rainy season that followed 383 participants for two visits (742 person-visits)47. The second study was a population-based, stepped-wedge design, randomized controlled trial that followed up 1190 participants in 16 communities for five monthly visits (5745 person-visits) during the dry season of 2017 to investigate the health effects of water access from managed aquifer recharge systems48. Managed aquifer recharge systems are hydrogeological interventions to reduce aquifer salinity by infiltrating rainwater and pondwater to the aquifer, and communities were randomly assigned to have access to managed aquifer recharge water49. The pooled analyses from the pilot and stepped-wedge trial suggested that mild-salinity water drinkers had lower mean blood pressure and higher intake of Ca and Mg compared with the freshwater drinkers32, which highlighted the need for understanding whether drinking saline water was the source of salubrious minerals. Therefore, a third cohort study was conducted to measure Na, K, Ca and Mg concentrations in drinking water sources longitudinally during the wet season of 2018 and the dry season of 2019 in southwest coastal and a non-coastal region. The non-coastal region was located in central Bangladesh and was not affected by saltwater intrusion from seawater, and so was included as a control hydrogeological setting with lower salinity. The third cohort study followed 293 participants from the coastal and 277 from the non-coastal region for seven visits (1773 person-visits from the coastal and 1774 from the non-coastal region).

BP blood pressure, Na sodium, K potassium, Ca calcium, Mg magnesium, Cl chloride, UTP urine total protein, HDL-C high-density lipoprotein cholesterol.
Drinking water sources and mineral concentration data
Participants reported their contemporary drinking water sources at all study visits. In total, 580 person-visits from three cohort studies reported drinking water from multiple sources or did not report any drinking water sources—they were excluded from analyses. We measured drinking water minerals in the 2nd to 7th visit of the third cohort study (Fig. 2). We collected households’ stored water samples, both in coastal and non-coastal regions, and sent the water samples to the Department of Agricultural Chemistry, Patuakhali Science and Technology University, for measurement of Na, K, Ca and Mg. Water samples were filtered through Whatman No. 42 filtered paper and transferred to the 50-mL conical propylene Falcon tube (Thermo Fisher Scientific, USA). After filtration, the pH of the water samples was maintained at <2.0 by adding nitric acid, and samples were preserved at 1–4 °C for further dissolved Na, K, Ca and Mg analysis50. Na and K were determined using the flame emission spectrophotometer (Spectrolab, UK) by selecting appropriate filters; Ca and Mg were determined by the atomic absorption spectrophotometer (AAS-Varian 55B, Australia)51. The respective metal standard, blank, triplicate and continuing calibration verification were included in each batch throughout the elemental analysis. Water samples were collected from one household when a cluster of households in a village shared the same drinking water source (e.g., in coastal communities). Households in the non-coastal region did not share drinking water sources. All non-coastal households in this cohort relied on groundwater in all seasons.
Twenty-four-hour mineral intake and total urinary protein data
In all visits of the three studies, we collected participants’ 24-h urine. Participants received a 4-L plastic container for 24-hr urine collection, and a plastic mug to transfer voided urine to the 4-L plastic container. Trained field research assistants instructed participants to discard their first-morning urine and to begin 24-hurine collection by transferring the second-morning void, and then to transfer all voids of the day and night, including the next morning’s first void to the 4-L plastic container.
Field research assistants recorded the volume of the 24-h urine and took a 15-ml sample from the 4-L plastic container after stirring. They transported all urine samples to a field laboratory at 2–8 °C for processing and analysis. Urine Na, K, Ca, chloride and total protein were measured in all visits’ water samples, but urine Mg was measured during all visits of the stepped-wedge trial and third cohort study. Direct ion-selective electrode (ISE) methods24 were used to measure the urinary Na, K and chloride with a semi-auto electrolyte analyzer (Biolyte2000, Bio-care Corporation, Taiwan, coefficient of variation: ±5%). Urinary Ca and Mg were measured by photometric titration, and total protein was measured via the colorimetric method using a semi-auto biochemistry analyzer (Evolution 3000, BSI, Italy, coefficient of variation: <1%).
Blood pressure, fasting blood glucose and lipid data
Blood pressure of the participants was measured in all visits using an Omron® HEM-907 (accuracy: within ±4 mm Hg, Kyoto, Japan) digital monitor. Participants were advised not to consume caffeine (e.g., tea and coffee), nor to eat, smoke or perform heavy physical activities 30 min prior to measuring blood pressure. Participants rested for at least 5 min on a chair in an arm-supported sitting position before blood pressure measurement. Blood pressure was measured three times while sitting. The arithmetic mean of the three blood pressure measures was used for data analyses.
Participants’ fasting blood was collected during the 5th visit of the stepped-wedge trial, and during the 1st to 6th visits of the third cohort study. Trained phlebotomists collected 5 ml of fasting blood using aseptic precautions. Blood samples were transferred to a field laboratory for centrifugation at around 894 × g relative centrifugal force for 15 min at ambient temperature for plasma separation; aliquots were then stored in a −20 °C freezer. Blood glucose was measured in all blood samples using the hexokinase method52. Blood lipids were measured only for the 5th-visit samples of the stepped-wedge trial. Total cholesterol was measured by the enzymatic endpoint method53; high-density lipoprotein cholesterol (HDL-C) was measured by the direct clearance method54; triglycerides were measured by the enzymatic colorimetric method55.
Cardiometabolic risk factor data
We recorded demographic (age, sex and religion) and socioeconomic (e.g., household asset) information on the participants and measured their anthropometric characteristics (i.e., height, weight and waist circumference). Height was measured once for each participant, but the weight was measured during each visit. We also collected data on smoking, work-related physical exercise, alcohol consumption, sleep hours and participants’ consumption of additional table salt with food during all visits. We calculated households’ wealth scores using principal component analysis of household assets, including ownership of a refrigerator, television, mobile phone, motorcycle, bicycle, sewing machine, chair, table, wristwatch, wardrobe, wooden cot, motor pump, rice-husking machine, motorized rickshaw, car and access to electricity. We then categorized wealth scores into wealth quintiles.
Statistical analyses
Descriptive statistics
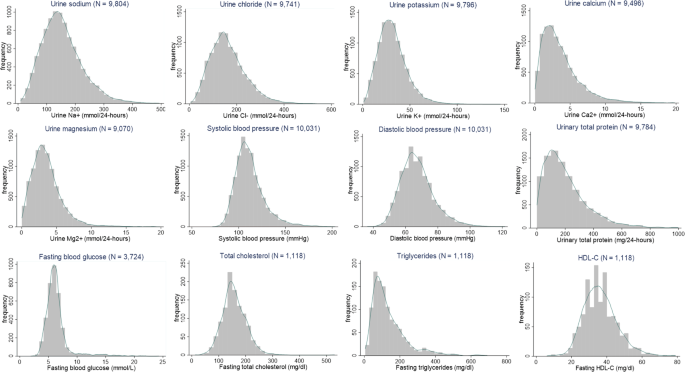
We plotted histograms and kernel-density plots of 24-h urinary concentrations of all minerals and cardiometabolic biomarkers. We calculated the mean and 95% confidence interval (CI) of all minerals and cardiometabolic biomarkers that approximated a normal distribution, and the median and interquartile range (IQR) for skewed outcomes. Participants who reported the use of multiple water sources or did not report using any of the selected drinking water sources were excluded from analyses (N = 580 person-visits). We created box plots of mineral concentrations in each drinking water source of the third cohort study.
Urinary minerals and cardiometabolic biomarkers among rainwater drinkers
We used multilevel models to contrast the levels of 24-h urinary minerals and cardiometabolic biomarkers between persons drinking rainwater and persons drinking water from alternative water sources. We considered three alternative water sources: (1) pondwater, (2) coastal groundwater and (3) combined groundwater (both coastal and non-coastal). We used multilevel linear regression models for all 24-h urinary Na, chloride, K, Mg, SBP, DBP, FBG, total cholesterol and HDL-C. Since 24-h urinary Ca, urinary total protein and fasting plasma triglycerides had skewed distributions (Fig. 3), we used multilevel gamma regression models56 to estimate the ratio of median biomarkers between rainwater drinkers and drinkers of alternative water sources. The models included three random intercepts accounting for the nesting of longitudinal visits within participants, participants within households and households within communities. Since fasting plasma total cholesterol, HDL-C and triglycerides were measured only during the 5th visit of the stepped-wedge trial, the multilevel models for those outcomes had two random intercepts: for clustering of individuals within households, and households within communities.

HDL-C high-density lipoprotein cholesterol.
Propensity-score-matched analyses
Several covariates were unequally distributed across the person-visits of different water sources. Therefore, we used propensity-score matching of person-visits of rainwater drinkers to reference water sources. The propensity-score model was conditioned on age, sex, BMI, smoking, alcohol consumption, physical activity, religion, sleep hours, consumption of table salt and household wealth using nearest-neighbour matching by Mahalanobis distance57. Of the cardiometabolic biomarkers, blood pressure and urine total protein were measured in all visits, fasting blood glucose was measured in the fifth visit of cohort 2 and the first six visits of cohort 3 studies and fasting blood lipids were measured only in the fifth visit of the cohort 2 study. Therefore, 1598 person-visits of rainwater drinkers were matched with 1598 person-visits of coastal groundwater drinkers for blood pressure and urine total protein, 716 person-visits of rainwater drinkers were matched with 716 person-visits of coastal groundwater drinkers for FBG and 100 person-visits of rainwater drinkers were matched with 100 person-visits of coastal groundwater drinkers for blood lipids. Similarly, person-visits of pondwater and combined coastal groundwater drinkers were also matched with person-visits of rainwater drinkers for each of the biomarkers. In the propensity-score-matched subpopulation, we used similar multilevel linear or gamma regression models described above.
We estimated multilevel models using maximum likelihood and reported cluster robust standard errors considering the community as the highest level of clustering. We reported findings of unadjusted models (model 1); models adjusted for age, sex and BMI (model 2); models that additionally adjusted for participants’ smoking status, alcohol consumption, physical activity, religion, sleep duration, consumption of table salt with food and household wealth (model 3); models that additionally adjusted for dry versus wet seasons of data collection (model 4). Age and BMI were used as linear continuous variables in all models, but other covariates were used as categorical variables. We used a nominal significance P-value threshold of 0.05. We performed statistical analyses in Stata/SE, version 16.0, but propensity score matching was done using MatchIT package in R, version 3.3.058.
Sensitivity analyses
In the sensitivity analyses, we used conditional logistic regression to model the within-person associations of drinking rainwater with minerals and cardiometabolic biomarkers. The outcome for these models was binary (drinking rainwater vs. alternative water source), and the continuous predictors were urine minerals and cardiometabolic biomarkers. Separate models were fitted for each predictor. Since these models are making within-person comparisons, they control for all time-invariant person-level confounders through matching.
Multiple comparisons
The family-wise error rate was controlled for multiple comparisons through a Bonferroni correction (α = 0.01)59. The Bonferroni-adjusted p-value threshold accounted for 12 hypothesis tests of urine minerals and cardiometabolic biomarkers.
Ethical approval
All three studies were conducted per ethical requirements. Informed written consent was obtained from all participants and household heads prior to the start of the study. The study protocols were approved by the Ethical Review Committee of icddr,b.
Source: Resources - nature.com


