To gain critical knowledge on the microbial communities inhabiting the ear skin of wild house mouse, we analyzed 203 M. m. domesticus individuals coming from 34 distinct locations around the southwestern French commune of Espelette. Further, we recently determined that community profiling based on 16S rRNA gene transcripts may better reflect true residents and underlying interactions with the host [49] due to the skin low microbial biomass and potential for environmental noise. Thus, we performed 16S rRNA gene sequencing using both bacterial genomic DNA and RNA reverse transcribed into cDNA as templates, which we refer to as the “standing” and “active” communities, respectively. To compare these data to skin microbial composition typically observed in a laboratory environment, we included three different groups of laboratory mice reared in distinct facilities: HL-Lab [49], MPI-Lab, and C57BL/6J (Table 1, Supplementary Table 1).
Skin microbiota composition in wild and laboratory mice
First, we assessed the relative abundances of the five most abundant phyla (defined as one of the five most abundant taxa in at least two of the four groups, comprising 90.57%, SD = 14.09%, and 82%, SD = 12.32%, of the total abundance for DNA and RNA datasets, respectively), and five most abundant genera (comprising 38%, SD = 18.47%, and 30%, SD = 14.31% of the total abundance for DNA and RNA datasets, respectively). This reveals Firmicutes to be the most abundant phylum in wild, MPI-Lab, and C57BL/6J mice on the DNA level, which is significantly lower in HL-Lab mice, whereas Proteobacteria is more abundant in C57BL/6J.
Of note, a clear and significantly higher Actinobacteria abundance is also a shared aspect of the wild and C57BL/6J mice at the DNA level, whereas on the RNA level Actinobacteria remains highly abundant in the wild and Firmicutes dominates the C57BL/6J community (Fig. 1a, Supplementary Table 2). Among the genera detected at the DNA level, a substantially higher abundance of Staphylococcus, Streptomyces, unclassified Actinobacteria and Saccharopolyspora are a unique aspect of the wild mice, while C57BL/6J harbor different members of Actinobacteria, namely Cutibacterium (formerly Propionibacterium) and Corynebacterium. Interestingly, at the RNA level Staphylococcus is equally and highly abundant in wild and C57BL/6J mice (Fig. 1b and Supplementary Table 2).
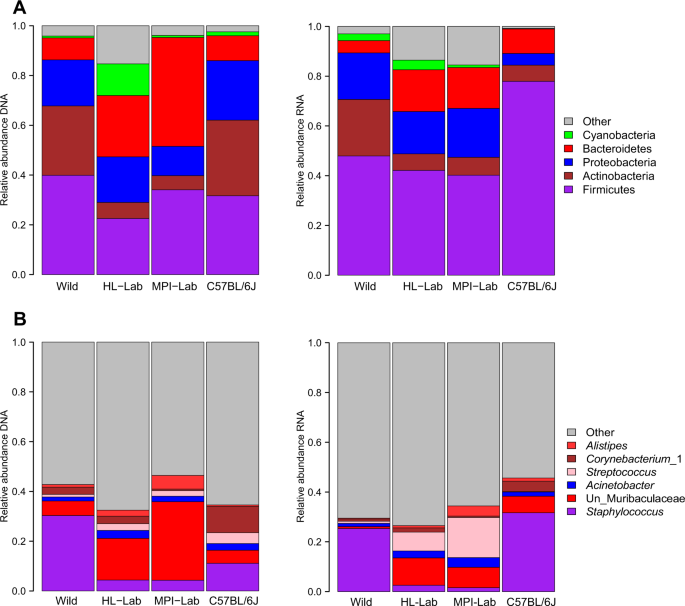
Mean relative abundances of phyla (a) and genera (b) across mouse populations in standing (DNA-based) and active (RNA-based) communities. Detailed description of “Other” is reported in Supplementary Table 2. Un Unclassified.
Although the relative pattern of phylum and genus-level abundances among the four groups of mice is largely correlated between the standing and active datasets, notable discrepancies are the phylum Bacteroidetes and the genus unclassified Muribaculaceae, which are particularly high in the communities of MPI-Lab based on DNA, and C57BL/6J, which harbors different mean abundances of Staphylococcus (11 and 31% in DNA and RNA, respectively). Further, unclassified Muribaculaceae overall appears abundant in the standing communities, but is very low in the active communities, suggesting that its detection at the DNA level may represent carry-over from fecal material (see “Discussion” section).
Diversity of skin microbiota within and between wild and laboratory mice
To evaluate community structure and diversity in more detail, we performed alpha and beta diversity analyses. Analysis of taxon evenness and richness at the genus level expressed by Shannon and Chao1 indices, respectively, reveals higher richness among wild mice, both in the standing and active communities; whereas evenness is greater in laboratory populations based on DNA, while evenness is lowest in C57BL/6J based on RNA, which is consistent with a strong dominance of Staphylococcus (Fig. 2a, b).
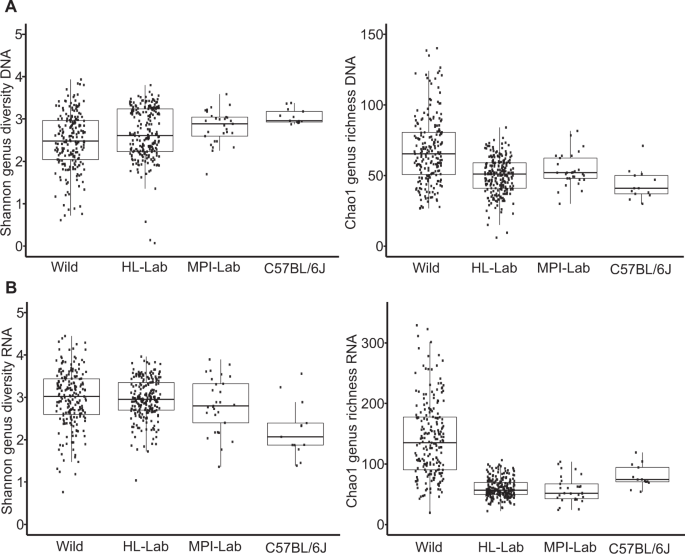
Shannon and Chao1 indices across mouse populations in standing (DNA-based) (a) and active (RNA-based) (b) communities. Pairwise Wilcoxon tests are reported in Supplementary Table 2.
Furthermore, we performed a simple analysis of shared versus unique taxa at the phylum (Supplementary Fig. 1) and genus levels (Fig. 3). To generate a reliable and accurate picture of taxa inhabiting each mouse population, we limited the analyses to core phyla and genera that we defined within each population’s DNA and RNA datasets as present in at least 25% of the individuals. Core taxa represent approximately 99 and 90% of all phyla and genera, respectively, detected within mouse populations (Supplementary Table 2). In all cases, wild mice display by far the largest number of unique genera, which is consistent with the observations of genus-level richness.
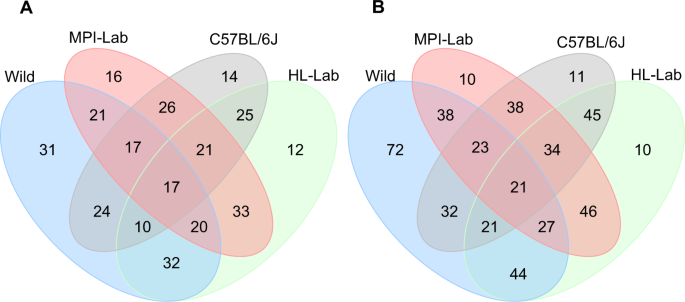
Standing (DNA-based) (a) and active (RNA-based) (b) communities. Summary statistics of core and unique genera are reported in Supplementary Table 2.
Despite the higher number of taxa unique to wild mice, the smaller number of taxa shared among all four groups (5 and 6 phyla and 17 and 21 genera in standing and active communities, respectively) comprises the highest proportion of the core abundance within communities. Specifically, shared genera at the DNA level represent on average from 58% in wild to 78% in MPI-Lab. Unique genera make up the second largest proportions in wild (27%) and C57BL/6J (19%), whereas unique genera represent comparatively minor fractions in HL-LAB (5%) and MPI-LAB (9%). Shared core genera based on RNA represent between 48% in wild to 65% in C57BL/6J. Notably, unique RNA genera represent minor fractions in all laboratory groups (from 1% in C57BL/6J to 9% in HL-Lab), while in the wild the unique fraction remains the second largest (32%).
To thoroughly assess beta diversity, we analyzed the Bray–Curtis and Jaccard indices, which are based on weighted taxon abundances and taxon presence/absence, respectively (Fig. 4 and Supplementary Fig. 2). Principal coordinates analysis of Bray–Curtis index reveals a large effect of sample origin, with the first, second, and third axes being significant (Fig. 4a). This effect is larger than that of profiling type (i.e., standing versus active communities). Interestingly, C57BL/6J mice display an intermediate pattern of community structure between the wild, HL-Lab, and MPI-Lab mice. Analysis based on the Jaccard index, on the other hand, reveals a more substantial distinction between the wild and three laboratory mouse groups, with an additionally more pronounced difference between the standing and active communities of the wild mice (Fig. 4b). Moreover, we inspected the influence of additional features including location (farm, family|cage) and sex, and find a significant influence of mouse location and sex (permanova adonis, Bray–Curtis: mouse origin R2 = 0.21, p = 10−5, location R2 = 0.15, p = 10−5, sex R2 = 0.004, p = 10−5; Jaccard: mouse origin R2 = 0.13, p = 10−5, location R2 = 0.14, p = 10−5, sex R2 = 0.002, p = 10−5, based on 105 permutations).
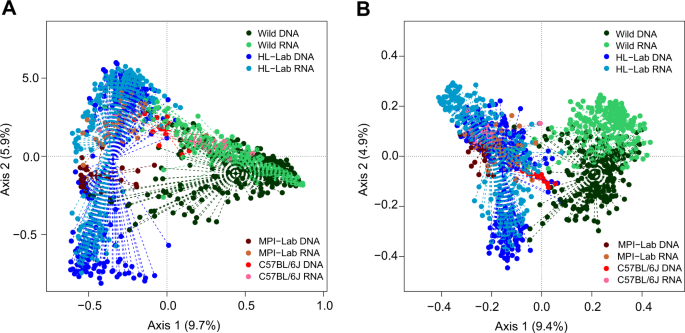
Unconstrained principal coordinates analysis (PCoA) of Bray–Curtis (a) and Jaccard (b) indices (genus-level) in mouse populations in standing (DNA-based) and active (RNA-based) communities. Goodness of fit of mouse origin: Bray–Curtis axes, R2 = 0.49, p = 10−5, Jaccard: R2 = 0.62, p = 10−5, based on 105 permutations. “+” centroid of the cluster.
Indicator species and random forest classification analyses
To identify individual taxa contributing to patterns of beta diversity, we first performed indicator species analysis based on the joint core genera (i.e., the sum of all those present in ≥25% of the mice in any given group) relative abundance and presence/absence in the standing and active communities (Supplementary Table 3). Analysis based on relative abundance in the standing communities identifies Staphylococcus, Streptomyces, and Brevibacterium as strong indicators for wild-caught individuals. Indicators of laboratory mice include Cutibacterium and Corynebacterium_1, which are strongly associated to C57BL/6J, and several Clostridiales and Bacteroidetes genera associated to MPI-Lab.
In the active communities, Staphylococcus is a strong common indicator of wild and C57BL/6J, whereas, Burkholderia and Streptococcus become significant indicators of MPI-Lab mice. These results are clearly in line with the compositional contrasts described above. Interestingly, presence/absence analysis reveals numerous genera belonging to Actinobacteria, with Streptomyces showing the strongest association to wild mice.
To further assess the discriminating power of the core genera, we performed random forest classification analyses. We find that core DNA (n = 133) and RNA (n = 191) genera accurately classify all individuals to their origin (OOB estimate of error rate: 1.7%, mean classification accuracy across groups 100%) (Supplementary Fig. 3). Moreover, we inspected the mean decrease accuracy component across genera and find that several Actinobacteria taxa including Streptomyces, Brevibacterium, and Nocardiopsis along with Staphylococcus are crucial to the accuracy of the classification (Supplementary Table 3).
Given the interesting patterns of Staphylococcus abundance across mouse groups, we additionally performed the analyses based on core Staphylococcus ASVs (n = 33). First, indicator analyses find most ASVs to be strongly associated to wild mice, and fewer with laboratory mice. Specifically, ASV_2, ASV_3, and ASV_4 are associated to wild mice, while ASV_1 and ASV_17 indicate C57BL/6J, and ASV_19 and ASV_77 jointly indicate HL-Lab and MPI-Lab (Supplementary Table 3). Random Forest analyses correctly classifies wild individuals, whereas 15/29 to 21/29 MPI-Lab, and 2/13 C57BL/6J are assigned to HL-Lab (OOB estimate of error rate: 9.79 and 7.23%, mean classification accuracy across groups 96.38 and 94.25% in DNA and RNA, respectively). Importance components find ASV_2, ASV_3, ASV_4, ASV_19, and ASV_11 as most crucial to classification (Supplementary Table 3). These results importantly show that Staphylococcus core ASVs are sufficient to accurately discriminate between wild and laboratory mice (Supplementary Fig. 4)
Diversity of Staphylococcus and Streptomyces in wild and laboratory mice
Given the notably higher abundance of Staphylococcus as a distinguishing feature of the wild and active C57BL/6J mouse skin microbiota, we further attempted to reveal the identity of individual taxa using a nested approach including genus-specific 16S rRNA gene primers for subsequent cloning and Sanger sequencing, followed by matching ASV sequences. We recovered 223 sequences from ten wild samples (18–26 per sample) that were selected to maximize the recovery of Staphylococcus ASVs. Due to the overall low skin biomass and comparatively lower Staphylococcus abundance in most laboratory mice, amplification with this primer pair yielded only 25 sequences from 2 laboratory individuals (2 to 23 per sample). In wild individuals, S. equorum and S. xylosus are preeminent among clone sequences, with comparatively fewer belonging to S. cohnii and S. succinus. In HL-Lab samples, most clones are S. epidermidis, with fewer sequences classifying as S. hominis and S. pasteuri (Supplementary Table 4).
Next, to assign species-level taxonomy to the core Staphylococcus ASVs (n = 33), we aligned representative ASV sequences to the Staphylococcus clone sequences obtained above, which yielded matches for all ASVs (Supplementary Table 4). This reveals ASV_1, ASV_3, ASV_4, and ASV_17 to most closely match S. xylosus / saprophyticus, ASV_2 and ASV_11 to most closely match S. equorum, and ASV_19 and ASV_77 to most closely match S. epidermidis and S. hominis, respectively. Upon inspection of the distribution of Staphylococcus ASVs across mouse groups (Fig. 5a), we observe that wild mice harbor high species diversity, in contrast to C57BL/6J, which contains almost exclusively S. xylosus/saprophyticus. Of note, S. xylosus/saprophyticus is mostly driven by distinct ASVs in wild and C57BL/6J mice whereby wild individuals harbor ASV_3 and ASV_4 and C57BL/6J show ASV_1 and ASV_17 (Supplementary Fig. 5A). In contrast, same S. epidermidis and S. hominis ASVs are detected across mouse groups, but remain extremely low in the wild (Supplementary Fig. 5B, C).
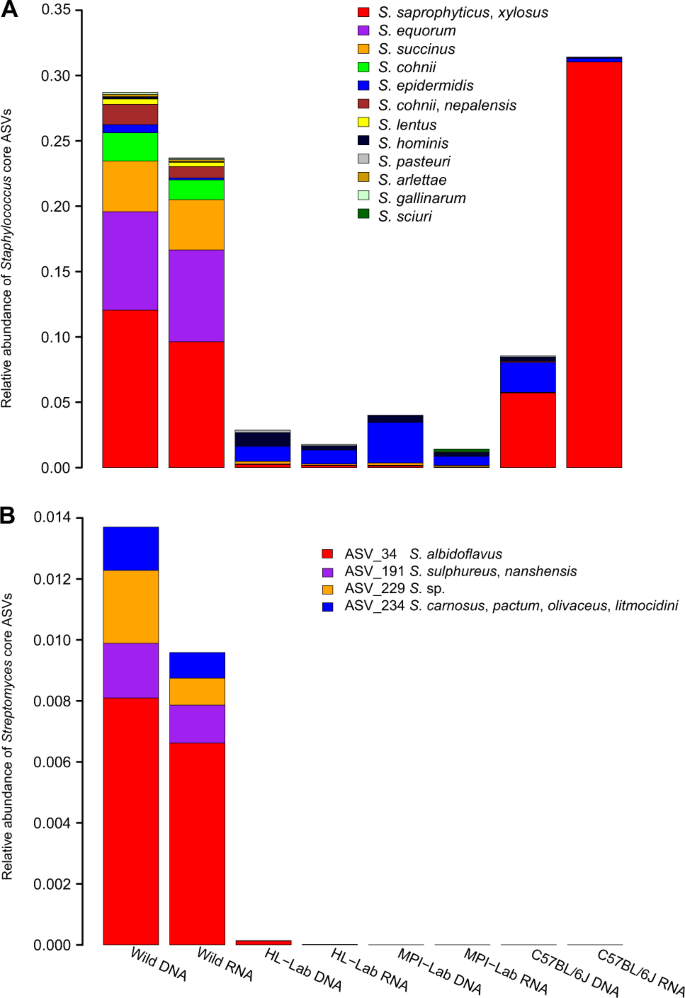
Staphylococcus (a) and Streptomyces (b) in standing (DNA-based) and active (RNA-based) communities of wild and laboratory mice. Taxonomy is based on Sanger sequencing of genus-specific 16S rRNA gene amplicons.
To further validate Staphylococcus species patterns, we obtained sequences from a portion of the tuf gene, which provides better resolution for Staphylococcus [66], in a subset of 73 samples including 49 wild, 11 HL-Lab, 12 MPI-Lab, and 1 C57BL/6J. Overall, we detect 779 Staphylococcus ASVs, of which 442 could be assigned species-level identity. We find 665 ASVs unique to wild mice, 128 of which belong to S. xylosus and S. equorum. In contrast, only 50 ASVs are unique to laboratory groups, of which most belong to S. hominis and S. epidermidis. Interestingly, 64 ASVs are common to wild and laboratory mice, and mostly match S. xylosus (9 ASVs), S. equorum (8 ASVs), and S. succinus (6 ASVs) (Supplementary Table 5). Overall, analysis of Staphylococcus based on the tuf gene reveals substantial diversity in the wild, with most ASVs belonging to S. equorum and S. xylosus. While numerous species are shared between wild and laboratory animals, they are characterized by distinct ASVs, as the fraction of shared ASVs remains minor. Finally, another noteworthy observation is that wild mice display a preponderance of taxa whose closest matches are to the phylogenetically closely related group of novobiocin-resistant species [67], which is important in view of the dearth of sequences matching taxa classified as novobiocin-susceptible in wild mice.
Interestingly, novobiocin is also known to be secreted by Streptomyces niveus (S. spheroides) [68], and Streptomyces is similarly a powerful indicator of the wild mice (association statistics 0.91 and 0.86, p ≤ 0.05 in standing and active datasets, respectively). Accordingly, we explored Streptomyces species in wild mice using genus-specific 16S rRNA gene primers as described above and recovered 135 clones from the eight samples with the highest diversity of Streptomyces traits (12–20 sequences per sample). This reveals S. albidoflavus (ASV_34) and Sulphureus/nanshensis (ASV_191) to be widespread in the standing and active datasets. S. niveus, the described secretor of novibiocin, is however not detected among clone sequences (Fig. 5b and Supplementary Table 4).
Sources of variation in skin microbiota composition in wild house mice
To examine potential sources of variation in the composition of wild skin microbiota that may contribute to the community characteristics revealed above, we analyzed environmental and genetic parameters unique to the wild mouse dataset, including geographic sampling location, neutral microsatellite markers, and mitochondrial D-loop sequences. These serve as proxies of the local environment, population structure and maternal transmission, respectively. Analysis of D-loop sequences reveals five distinct haplogroups, whereas analysis of microsatellites reveals K = 13 as the optimal number of genetic clusters (Supplementary Table 1). Of the 203 wild-caught individuals, 124 are non-admixed (≥80% of their ancestry is assigned to a given cluster) and 79 are admixed (<80% of their ancestry is assigned to a given cluster) (Supplementary Fig. 6). Using a mixed effect modeling and partial correlation framework to control for the influence of population structure and maternal transmission, we subsequently evaluated the influence of farm characteristics, geographic distance, and host features on community composition in 115 selected individuals.
Among the factors examined, farm or location of sampling is associated with variation in wide-reaching aspects of community composition and structure as expressed by R2m. In the standing communities (Supplementary Table 6), farm influences the abundance of Bacteroidetes (77.33% of total explained variance) and all four beta diversity measures (Bray–Curtis, Jaccard, unweighted, and weighted unifrac), and explains substantial fractions of variance for the Jaccard index (PC1 90.8% and PC2 88.35%).
In the active communities, farm and weight influence Staphylococcus and jointly explain 39.38% of the total variance. Additionally, farm explains important portions of variance in alpha-diversity and beta-diversity measures, and explains up to 74.66 and 63.29% in the Jaccard index (PC1, and PC2, respectively) (Supplementary Table 7).
In addition to farm and host features, we investigated the influence of geographic distance between sampling locations. Based on the geographic coordinates of sampling sites, we calculated Euclidian pairwise distances for the same 115 individuals mentioned above (geographic coordinates of sampling locations are presented in Supplementary Table 8 and Supplementary Fig. 7). Partial Mantel tests included distances between sampling locations as the main variable, and Cavalli-Soforza and p-distance matrices as conditions to account for correlations between genetic (Cavalli-Soforza, p-distance) and geographic distances (See Supplementary Methods) (Mantel test: Sampling locations distances-Cavalli-Soforza, r = 0.23, p = 0.0009; Sampling locations distances-p-distance r = 0.19, p = 0.0009; Cavalli-Soforza-p-distance, r = 0.17, p = 0.0009, based on Spearman’s correlation and 1000 permutations). Response variables included all four beta diversity measures in both the standing and active communities. In the standing communities, geographic distance significantly and positively correlates with all four beta diversity measures (Bray–Curtis: r = 0.20, p = 0.001, Jaccard: r = 0.23, p = 0.001, unweighted UniFrac: r = 0.23, p = 0.001, weighted UniFrac: r = 0.13, p = 0.001). In the active communities, we find positive significant correlations between sampling locations and all diversity measures (Bray–Curtis: r = 0.068, p = 0.008, Jaccard: r = 0.062, p = 0.008, unweighted Unifrac: r = 0.088, p = 0.001, weighted UniFrac: r = 0.08, p = 0.003). Of note, correlation coefficients are substantially lower in the active compared to the standing communities.
In summary, we find that farm characteristics influence a large number of taxa and diversity measures in the standing and active communities, and despite a relatively restricted sampling area, we detect a “distance-decay” similarity pattern in the skin microbiota among wild mice.
Source: Ecology - nature.com


