Concentration and phylogenetic characterisation of the sheath-water bacterioplankton
An assessment of bacterioplankton enrichment in the sheath-water of Tropic Seamount requires adequate reference sites (Fig. 1). Because the extent of the sheath-water was unknown, we used a nested approach of double referencing: (i) vertical profiles of bacterioplankton concentrations in the seamount-free areas of the North and South Atlantic gyres served as an external reference (Figs. 1b and 3a), (ii) vertical profiles of bacterioplankton concentrations at the seamount periphery (47 km south-east from the seamount summit centre to Station 1 and 24 km south to Station 13) served as a local reference (Figs. 1a and 3a,b). Bacterial concentrations within 1 m (ROV) and ≥5 m (CTD) above the seamount surface were compared to assess dispersal of re-suspended benthic bacteria in the sheath-water (Figs. 1a and 3b).
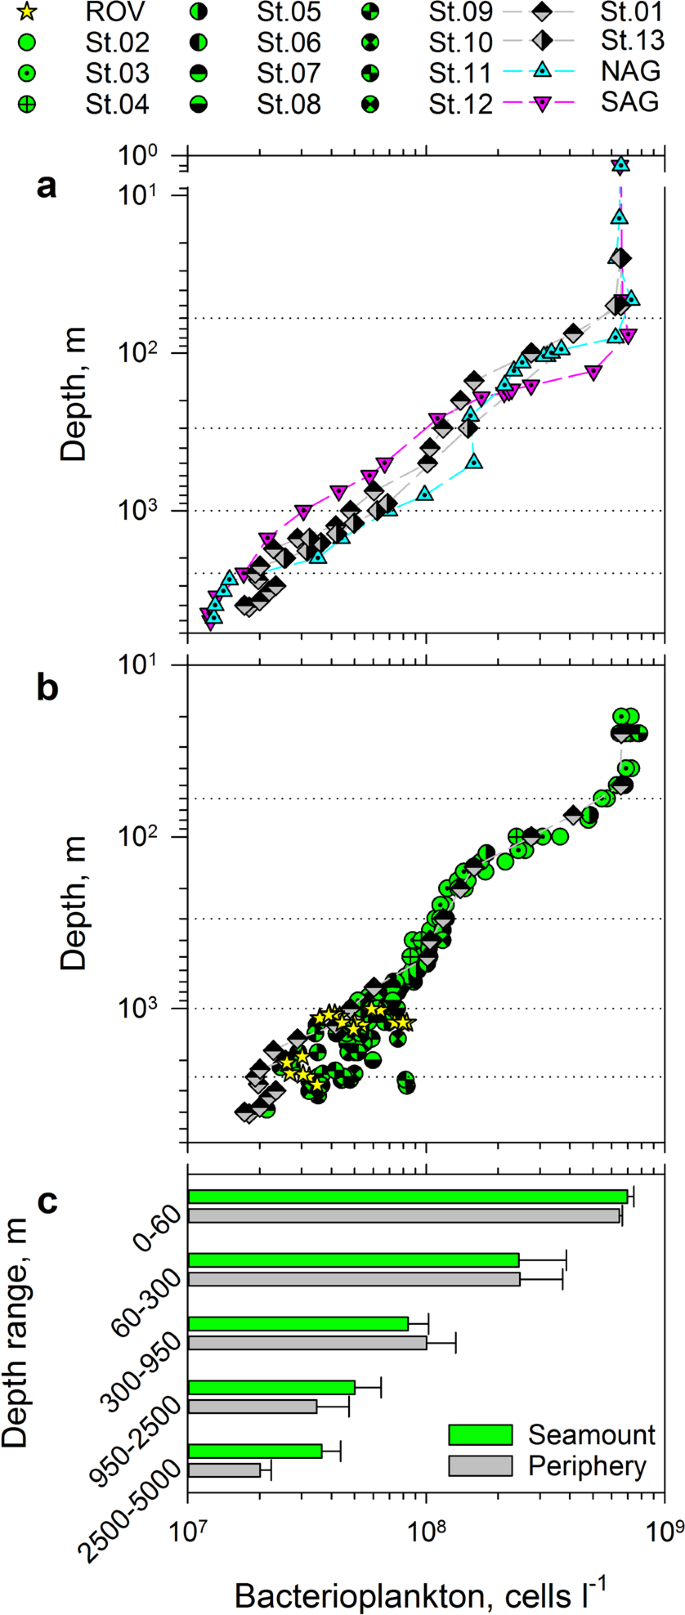
Bacterioplankton distributions in the water column at Tropic Seamount. (a) Comparison of bacterioplankton concentrations between the water column in Tropic Seamount periphery (St. 1 and 13) and the North and South Atlantic gyres (NAG and SAG, respectively). (b) Comparison of bacterioplankton concentrations between samples collected within 1 m of the seamount surface by a remote operated vehicle (ROV), at Tropic Seamount (St. 2–12) and in its periphery (St. 1). Dotted horizontal lines (a,b) indicate the five water layers defined. (c) Comparison of mean bacterioplankton concentrations in the five water layers between Tropic Seamount and its periphery. Error bars indicate single standard deviations of mean values. The results of the corresponding statistical analyses are presented in Supplementary Table S4. The corresponding sampling locations are shown in Fig. 1.
As would be expected, vertical distribution of bacterioplankton at 300–2,000 m depths in the seamount periphery was more similar to the distribution in the geographically closer North Atlantic subtropical gyre than in the geographically distant South Atlantic subtropical gyre (Fig. 3a). Below 2,500 m bacterioplankton concentrations in the two Atlantic gyres are statistically undistinguishable (Supplementary Table S3), whilst being 1.5× lower than the bacterioplankton concentrations in the seamount periphery (Fig. 3a, Supplementary Table S3). This indicates that the seamount affects bacterioplankton concentration even at the local reference sites: the seamount sheath-water extends beyond 20–40 km from the seamount summit (Fig. 1a). This bias of the local reference is taken into account in the latter analyses.
To assist comparisons, we divided the water column into five layers (Fig. 3), of which the two lowest are punctuated by Tropic Seamount. Bacterioplankton concentrations in the top three layers were similar above the seamount and in its periphery (Supplementary Table S4) confirming the laminar flow of water above the seamount and the minimal seamount effect on overlying waters. Indeed, a Taylor column (that can cause this effect) above Tropic Seamount has been found to be weak12. In the bottom two layers, bacterioplankton concentrations were significantly higher (1.5 and 1.8 times, respectively) at the seamount than in the seamount periphery (Fig. 3a,c), indicating the existence of the bacterioplankton-enriched sheath-water.
To test whether the observed higher bacterial concentrations at the seamount are caused by re-suspended benthic bacteria we compared bacterioplankton concentrations in samples collected ≥5 m (CTD) and ~1 m (ROV) above the slope (Fig. 3a). Because the two datasets were statistically indistinguishable (Supplementary Table S5) the uncertainty remained: the benthic bacteria could be evenly suspended farther than 5 m above the seabed or their presence in bacterioplankton could be insignificant. To resolve the uncertainty we decided to characterise bacterioplankton taxonomically. However, by collecting bacterioplankton cells on filters, we would also collect particles suspended from the seafloor, marine snow particles and other particulate materials, which could bias taxonomic composition of truly bacterioplankton community. To avoid this bias we assessed bacterial diversity of the four main flow sorted bacterioplankton populations (Fig. 4a). To test for homogeneity of the sheath-water bacterioplankton we compared the bacterial diversity within the four populations at three locations above the seamount (2,653, 3,030 and 3,215 m depth). We focused on Bacteria as molecularly and ecologically better characterised group (compared to Archaea or protists) in the deep-ocean. Furthermore, compared to eukaryotes basic metabolic rates and growth of prokaryotes could be directly assessed by the uptake rates of amino acids.
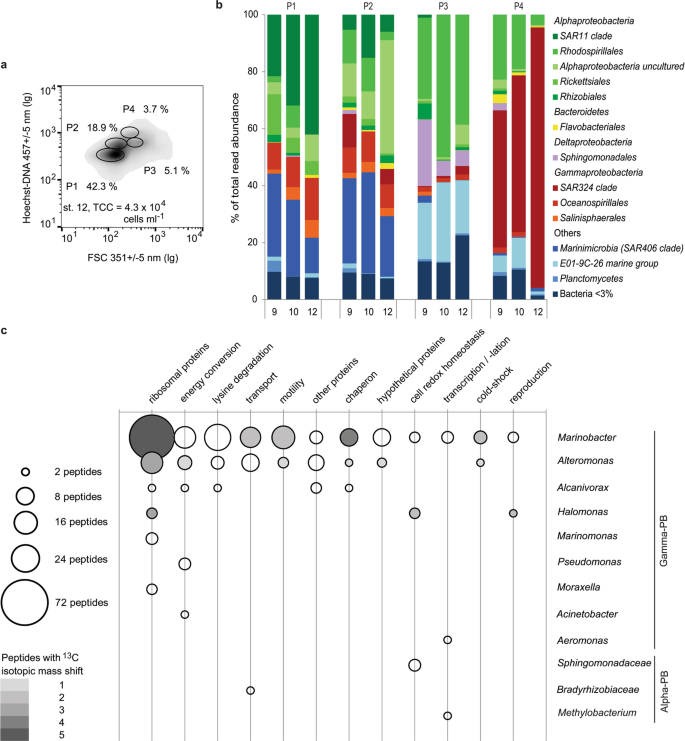
Taxonomic and proteomic characterisation of flow sorted bacterioplankton populations sampled from the seamount sheath-water. (a) Characteristic flow cytometric signatures of Hoechst–DNA stained bacterioplankton, sampled at St. 12. Ellipses on the density plot indicate the four main bacterioplankton populations (P1, P2, P3 and P4 with corresponding relative abundances shown as percentages), from which cells were flow sorted for taxonomic and proteomic analyses. The total cell concentration (TCC) is presented for reference. (b) Comparison of average (n = 2) relative taxonomic composition (% of read abundance) of the four main cytometric populations of bacterioplankton (BPL) sampled at the stations 9 (2,653 m), 10 (3,215 m) and 12 (3,030 m). P1 is dominated by the Rhodospirillales, Sphingomonadales and E01-9C-26 group. P2 is reproducibly dominated by the SAR11 and SAR406 groups. P3 is dominated by more diverse Alphaproteobacteria in addition to the SAR406 group. P4 is dominated by the SAR324 group. (c) Functional versus taxonomic classification of the peptides synthesised by cells from P1, focusing on the representative alpha- and gamma- proteobacteria (PB). The limited peptide data reveal the presence of bifunctional aconitate hydratase, 3-hydroxyacyl-CoA dehydrogenase, succinyl-CoA synthetase, isocitrate dehydrogenase, aspartate aminotransferase, aconitate hydratase and malate dehydrogenase enzymes and proteins responsible for core cellular functions such as protein expression, energy conservation, membrane transport or DNA folding.
Variation in composition and relative abundance of bacterial taxa in each of the four flow cytometric population was low between the three locations (Fig. 4b). The results of taxonomic analyses confirmed the dominance of planktonic bacteria and negligible content of potentially benthic bacteria (Fig. 4b, Supplementary Table S6) independent of sampling depth and location. Specifically, there was no indication that obligate benthic species36,37,38 (e.g. JTB255) were present among the sheath-water bacteria, whilst the dominant identified taxa (e.g. SAR11, Rhodospirillales, SAR324 and SAR406) are commonly found in deep-ocean bacterioplankton39,40 (Supplementary Table S6). Hence, the analysed sheath-water bacteria were indeed planktonic.
Proteins synthesized in situ by dominant cells of the sheath-water bacterioplankton
To ascertain whether the sheath-water bacterioplankton are actively growing, we analysed their protein synthesis (basic metabolism) in situ. We incubated isolated water samples in the deep-water incubator (Fig. 2) with 13C6-lysine label to identify the newly synthesized proteins. Because analyses of metaproteomic libraries remain challenging41, we used flow sorting that guaranteed us targeted proteomic analyses of the two most abundant populations of sheath-water bacterioplankton (the 1st and 2nd population, Fig. 4a) enabling direct metabolic and growth assessment of the bacterioplankton majority.
Low rates of 3H-lysine uptake by the sheath-water bacterioplankton at the ambient lysine concentration (see Supplementary Fig. S1) guided us to add 10 nmol l−1 of 13C6-lysine to overcome potential detection limitation. Even at this artificially high (>2,000 times higher than ambient) concentration we could only detect labelled peptides in cells flow sorted from the 1st population, and the labelled peptides had an isotopic mass shift of merely 5–30%. Approximately ten percent of detected peptides belonged to Gammaproteobacteria related to Alteromonas sp., Marinomonas sp. and Halomonas sp. (Fig. 4c). With Halomonas sp. being among the most abundant (Supplementary Table S6), all the three taxa were represented in the molecular data of the 1st population, validating our proteomic analyses (Fig. 4b,c). The newly synthesised proteins were involved in cell maintenance (ribosomal proteins, chaperones, proteins involved in energy conversion, cold-shock proteins) and active substrate uptake (membrane transporter proteins, flagellar proteins).
Active synthesis of proteins involved in transcription and translation, rather than in replication of nucleic acids (Fig. 4c), indicates preferential cellular maintenance rather than cell division. An isotopic mass shift, present in all detected peptides of cold shock proteins, indicates their constant regeneration. This is likely to reflect the mechanism of cell adaptation to cold (2–7 °C) deep-ocean conditions. Lysine addition predictably induced sheath-water bacteria to synthesise proteins involved in amino acid transport and utilization. Irrespective the artificial nature of this induction we could conclude that multiple taxa of sheath-water bacterioplankton are metabolically active and responsive to nutrient pulses (Fig. 4c), suggesting that availability of organic nutrients could restrict their growth.
Amino acid acquisition and growth of the sheath-water bacterioplankton
To reduce artificial stimulation of bacterial metabolic activity23 in samples incubated on board ship, we traced amino acid (leucine and lysine) uptake at concentrations close to ambient. We found that in the surface waters bacterioplankton uptake of leucine was 3 times faster than lysine uptake, whilst in the sheath-water this difference rose to >100 (Supplementary Fig. S1). Owing to its higher specific activity, leucine is a more sensitive tracer than lysine for assessing bacterial growth particularly at lower rates measured in the sheath-water. Consequently, we base our assessments of bacterial metabolic activity and growth on the results of experiments with the leucine tracer.
The amino acid uptake rate of a bacterial cell indicates its rate of protein synthesis and overall cellular metabolic activity. Therefore leucine clearance rates (the volume of water cleared of dissolved, bioavailable leucine by a cell in an hour) allows direct comparison of cell-specific metabolic activity of bacterioplankton living in the surface (Fig. 5a, Supplementary Table S7) and sheath- waters (Fig. 5b). The leucine clearance rates demonstrate that the metabolic activity of the sheath-water bacterioplankton cell is relatively high and, on average, 7.4% of the metabolic activity of the surface water bacterioplankton cell. However, because the sheath-water bacterioplankton standing stock is only 7.5% of the bacterioplankton standing stock in the surface waters (Fig. 3c, Supplementary Table S1), the standing stock-specific uptake of leucine in the sheath-water (Fig. 5d) is merely 0.074% of the uptake in the surface waters (Fig. 5c, Supplementary Table S7), underlining the challenge of measuring bacterioplankton growth in the deep-ocean waters.
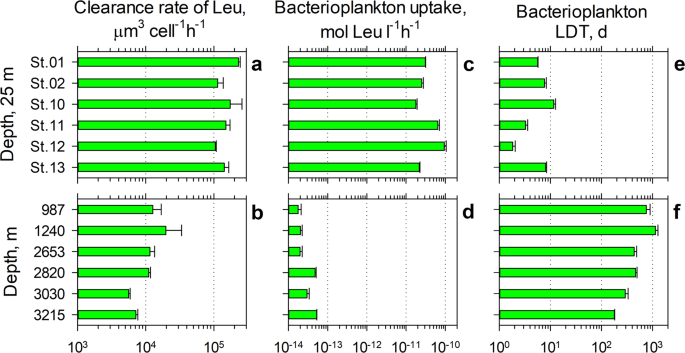
Bacterioplankton growth in the surface and sheath- waters of Tropic Seamount. Comparison of cellular clearance rates (a,b), bacterioplankton uptake rates of leucine (Leu) (c,d) and bacterioplankton linear doubling time (LDT) (e,f) between the surface mixed layer (25 m) above Tropic Seamount (Stations 2, 10–12) and in periphery (Stations 1 and 13) of the seamount (a,c,e) and in the sheath-water (b,d,f).
According to the measurements of leucine uptake (42 ± 30 pmol l−1 h−1, mean ± SD, Fig. 5c), the surface waters above Tropic Seamount are about three times more productive than the surface waters of the oligotrophic Atlantic gyres (13 ± 3 pmol l−1 h−1) and of comparable productivity to the tropical surface waters (40 ± 14 pmol l−1 h−1)42,43 unaffected by upwelling. This independently supports our earlier conclusion that Tropic Seamount has virtually no effect on bacterioplankton in the overlying waters. The leucine uptake rates were converted into bacterial production and the linear doubling time according to the Eqs. 1–3 using corresponding concentrations (Fig. 3c, Supplementary Table S1) and leucine uptake rates of bacterioplankton (Fig. 5c,d, Supplementary Table 7).
The calculated mean doubling time (Fig. 5e, LDT = 6.4 ± 3.6 days, EDT = 4.4 ± 2.5 days) of bacterioplankton in the surface waters above Tropic Seamount is comparable to bacterioplankton doubling in the open ocean (11 ± 15 d)44, in the temperate North Atlantic (7.1–12.5 d)45 or in the oligotrophic ocean (10–20 d)46. Compared to the surface waters bacterioplankton in the sheath-water of Tropic Seamount double ninety times slower, once every 543 ± 348 days (Fig. 5f). The mean LDT = 1.5 ± 1.0 years or EDT = 1.0 ± 0.66 years is within the broad range of 0.1–30 years47,48 estimates for deep-ocean bacterioplankton. Comparatively high cellular metabolic activity of the sheath-water bacterioplankton (5a, b) in conjunction with their slow growth (Fig. 5f) is in agreement with the proteomics results of effective intracellular recycling of main proteins rather than active bacterial reproduction (Fig. 4c).
Based on the determined LDT of 1.5 years and concentration difference (1.5× and 1.8× in the bottom two layers, Fig. 3c; on average ∆Nsp = 1.6×), it would take bacterioplankton in the seamount periphery 0.7 = 1.5 × ln(1.6) years and 1.2 = 1.5 × 1.6/2 years to grow to the concentration of bacterioplankton in the sheath-water using the exponential (Eq. 6) or linear (Eq. 5) model, respectively. The exponential model gives an estimate for the fastest, unrestricted bacterioplankton growth, whilst the more realistic linear model accounts for such restrictions28 and therefore should better approximate bacterioplankton growth in the seamount sheath-water.
Bacterioplankton concentration in the seamount periphery is, however, still 1.5× higher than in the deep-ocean waters unaffected by seamounts, ∆Npd = 1.5× (Fig. 3a). Therefore, it would take the deep-ocean bacterioplankton between ERT = 1.3 = 1.5 × ln(1.6 × 1.5) years and LRT = 1.8 = 1.5 × (1.6 × 1.5)/2 years to grow to reach the concentration of bacterioplankton in the sheath-water. To enable bacterioplankton to grow from the deep-ocean to the seamount sheath-water concentrations Tropic Seamount should retain the deep-water in its sheath for 1.3–1.8 years. This provides the original, experimentally-derived estimate of the years-long interaction between a representative seamount and the deep-ocean water flow.
Even the maximal 1.8-year retention is a short time compared with the 1,000 year global thermohaline circulation1. However, considering that the North Atlantic deep-water components of northern origin spread throughout the western North Atlantic within 25–30 years49, 1.8-year seamount sheath-water retention time is significant. Higher concentrations of bacterioplankton cells in the sheath-water (Fig. 3b,c) could explain what controls growth of deep-ocean bacterioplankton. Because there is no extra source of dissolved organic molecules in the sheath-water of Tropic Seamount, bacterioplankton consume bio-available, dissolved molecules. The only difference between the sheath- and surrounding deep- water is the complex sheath-water dynamics that includes intensive turbulent mixing of the former7,8 compared to laminar-flowing deep-water in seamount-free areas. Therefore, it would be turbulent water mixing that ultimately controls bacterioplankton growth in the deep ocean: growth of the deep-ocean bacterioplankton is limited by the bioavailability of organic molecules in cell vicinity and turbulent mixing alleviates that limitation. Furthermore, the longer the sheath-water is retained by a seamount, the more organic molecules in the retained water are consumed by resident bacterioplankton. The consequences of such interactions and their impact on the seamount surface is worth exploring in follow-up studies.
Source: Ecology - nature.com
