Biofilm spatiotemporal population analysis (BioSPA)
The evolution of a biofilm community from single-cell to multicellular level was assessed by employing an analytical tool, designed for spatiotemporal analysis at multi-length scale across three dimensions, to track multiple cells and clusters regarding growth dynamics, morphology (size/shape), and surface topography simultaneously (termed Biofilm Spatiotemporal Population Analysis or BioSPA, see “Methods”, Supplementary Fig. 1). Several analyses can be performed, including (i) identification of spatial patterns of bacterial binding according to surface topographies (the terrain); (ii) assessment of the growth of the entire population of colonizing microorganisms (the individuals) on a given surface; (iii) visualization of how they organize themselves into structured communities (the habitation); and (iv) evaluation of symbiotic/competition behavior among the population (the residents interactions). The BioSPA and a tutorial guide are readily available in GitHub (https://github.com/amaurijp/BioSPA).
Bacterial colonization on an apatitic surface
Biofilm-assembly process involves bacterial colonization and further growth of the colonizers on the surface, leading to structured microbial communities1. Given the importance of surface topography on bacterial colonization, we first assessed the spatial distribution of initial colonizers on the hydroxyapatite disc (HAD) surface. We employed a hybrid confocal imaging-surface topography approach for the simultaneous analysis of colonizing bacterial structures and HAD surface topography from submicron to submillimeter length scales (Fig. 1). The bacterial cells were first incubated with HAD disc surface for 60 min in static condition to allow bacterial binding and then aseptically transferred to a flow chamber. Before starting the flow, the population of surface colonizers (C), grouped based on the number of adherent bacterial cells, was examined using our imaging approach (Fig. 1a–c). The bacteria channel revealed a large population of surface colonizers (C): C > 200 in an area of 319.45 × 319.45 µm with a varied number of bacterial cells (P0). Colonizers with 1 ≤ P0 ≤ 5 (single cells) represented 60–70% of C, clusters (5 < P0 ≤ 50) were 25–35%, and aggregates (50 < P0 ≤ 300) were 1–6%. By overlapping the binarized Z-projection of the bacterial channel on the image stack of the HAD surface topography, we identified all sites upon which bacterial surface colonizers were attached (t0) (blue color in Fig. 2a; see arrows). Topographical parameters such as average roughness (Sa), root-mean-square roughness (Sq), and skewness (Ssk) were then calculated for each bacterial colonization site. Since several experiments were performed independently, a large number of surface colonizers were analyzed (C > 800; Fig. 2b–g).
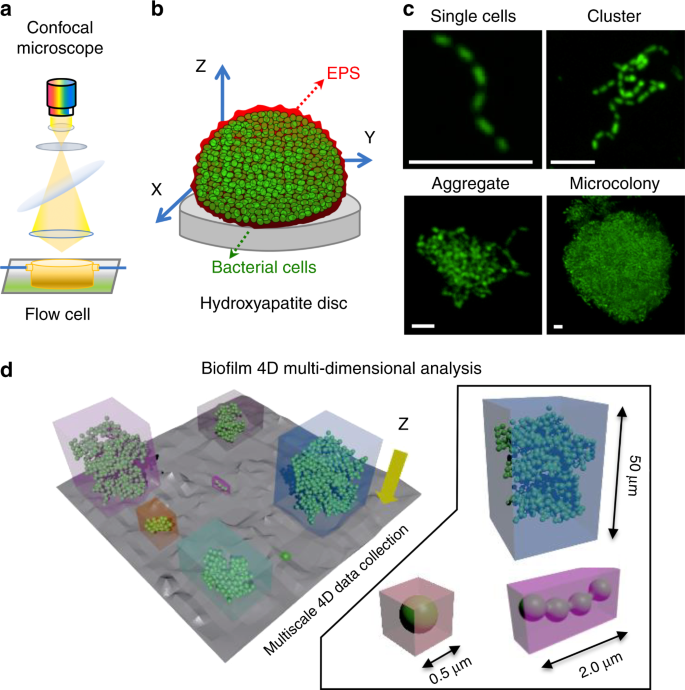
a Experimental setup for analyzing microbial colonization and further growth under flow in situ using confocal laser scanning microscopy-surface topography imaging approach. b Schematics of biofilm constituents detected by independent signal detection of bacteria (green), exopolysaccharides substances (EPS; red), and hydroxyapatite disc (HAD) surface (gray). The HAD is placed inside the flow cell in the position as shown in the diagram. c Representative Z-projection (max intensity) of the CLSM images depicting the evolution of a surface colonizer (single cells, cluster, aggregate) into structured communities (microcolony). White bars: 5 µm. d Schematics of the image-processing method to capture the population units (i.e., single cells, clusters, aggregates, and microcolonies) across time and space, i.e., three dimensions and at multiple scales. The data were analyzed using biofilm spatiotemporal population analysis (BioSPA) software.
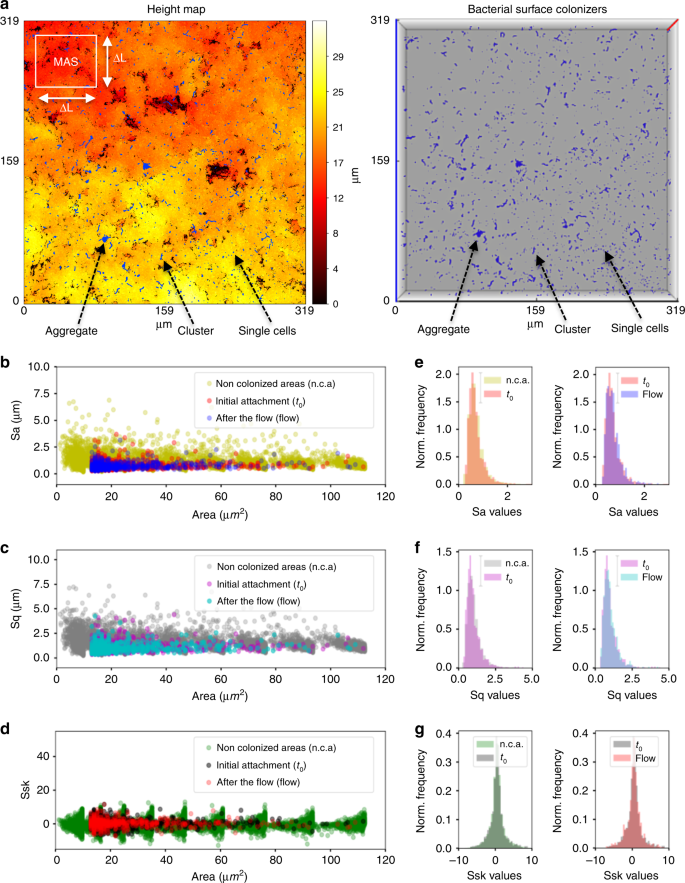
a In situ visualization of surface colonizers (at t0) on hydroxyapatite discs (HAD), overlapped with the surface topography (heightmap, left panel). Surface colonizers are shown in blue in the top view of a 3D representation of the bacterial cells on HAD (right panel). Z-axis (red line in right panel) represents a scale of 48 μm. Initial colonization of the surface consisted of single cells, clusters, and aggregates. b–d Topographical parameters average roughness (Sa), root-mean-square roughness (Sq), and skewness (Ssk) were determined at t0, and after the nutrient flow started in the chamber (flow). e–g Normalized histograms of Sa, Sq, and Ssk values. For non-colonized areas (n.c.a.), the parameters were calculated for the whole-scanned area and at different length scales (multiscale area selection—MAS; shown in a). The results represent a large population of bacterial surface colonizers (C > 800), captured from independent experiments (n = 3). Source data are provided as a Source Data file.
Traditionally, surface sensing and attachment mechanisms of microorganisms have been characterized by considering the substratum as a flat surface, thus overlooking topographical heterogeneity22,23,24. To address this, we locally analyzed the surface topography of the sites upon which bacterial colonizers were bound. This was performed by cropping the image stack containing the topographical profile (heighmap) exactly at the regions where bacterial colonizers were found at t0 and by calculating the surface roughness parameters Sa, Sq, and Ssk for these sites. Furthermore, we also measured Sa, Sq, and Ssk for the entire surface profile by splitting the heightmap (319.57 µm × 319.57 µm) into squared areas of ΔL × ΔL (3–115 µm2), termed multiscale area mapping (MAS), to calculate the roughness of all possible binding sites on the surface, in all possible scales (Fig. 2a). We found that bacteria initially bound (t0) to sites with low Sa and Sq values (<2.5 µm), regardless of the occupied area. Ssk values for colonized sites were also symmetrically distributed, indicating that the colonizers adhered to both “hills” and “valleys” present on the HAD. This result suggests flexibility in S. mutans mechano-sensing or surface interaction via EPS25,26, although additional studies are required to further understand their mechanisms of adhesion at the single-cell level27. In regard to a possible binding preference on the available surface sites (Sa = 0.2–7.0 µm), normalized histograms of Sa, Sq, and Ssk values for non-colonized areas (n.c.a.) overlap those calculated for surface sites containing colonizers at t0 (first column in Fig. 2e–g). This results revealed randomness for the initial attachment of the colonizers.
Upon initiating the flow in the chamber, ~40% of colonizing cells (C) detached, suggesting varying mechanical stability on the surface under fluid shear forces (Supplementary Fig. 2). This detachment occurred in a random fashion, as we observed similar patterns of normalized histograms of Sa, Sq, and Ssk values calculated before (t0) and after initiation of fluid flow (second column in Fig. 2e–g). Once the flow was initiated, the bacterial detachment was abundant across the HAD surface, while the detachment process was significantly decreased after 30 min of flow. Numerous dark red-colored boxes in Supplementary Fig. 2 indicated major detachment events occurred within 30 min. Highlighted boxes in Supplementary Fig. 2 with yellow color showed that detachment of surface colonizers with small sizes (cells and chains) occurred even at later stages of growth (>300 min), but cell clusters remained stably attached. These stably attached colonizers were followed individually to analyze changes in size and shape over time.
Growth dynamics of surface colonizers
To investigate the growth dynamics of surface-attached bacterial cells, we tracked each surface colonizer individually in real-time using 4D scalar field generated from the time-lapsed CLSM stacks (Fig. 3a). Cell growth and further biomass changes were observed where the initial colonizers remained on the HAD under flow (Fig. 3b; population highlighted in colored boxes from dark red to yellow). Histogram with the initial volume values (V(0 min)) for surface colonizers (at t0) and volume values at 420 min (V(420 min)) showed that majority of colonizers did not grow, while colonizers following power law (i.e., V(420 min) > 5 V (0 min)) evolved into various sizes of microcolonies over time (up to 750 µm3) (Fig. 3c, d).
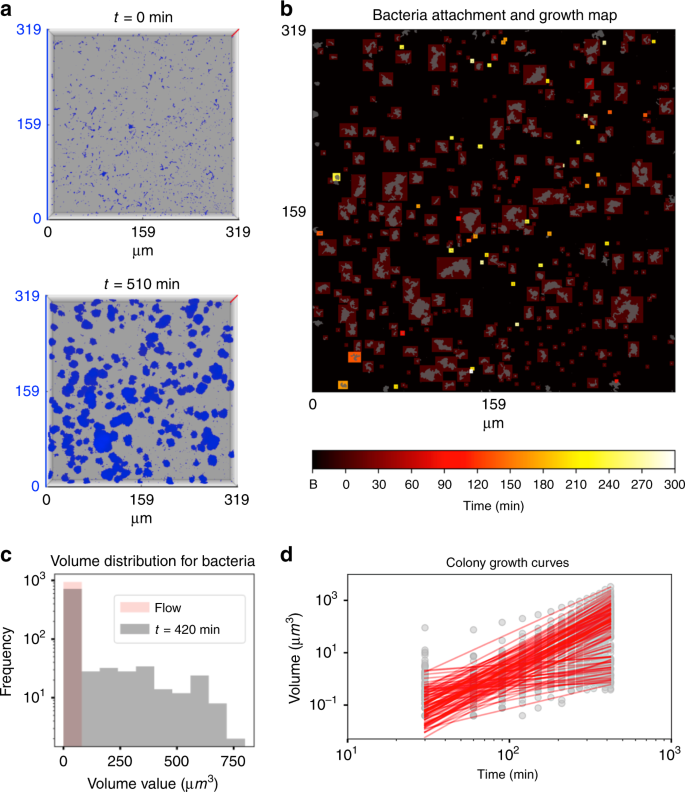
a Three-dimensional representation of the S. mutans growth under the flow of 1%-w/v sucrose at two different time points (0 and 510 min). Z-axis (red lines in (a)) represents a scale of 48 μm. b Time-lapsed heatmap of bacteria attachment and growth. Colored boxes indicate the time and location where bacteria attached. Elements shown in gray represent a projection of the bacteria signal at t = 300 min. Bacteria without colored boxes were not included in the population analysis. c Histogram with the initial volume values (V(0 min)) for surface colonizers at t0 (in pink) and volume values at 420 min (V(420 min); in gray). Flow indicates the time that the culture medium starts to flow. d The evolution of the colonizers into microcolonies was assessed by biofilm growth curves (in gray-colored data points for each time point) and fitted curves (red-colored continuous lines) (n = 3). Source data are provided as a Source Data file.
We unexpectedly found that only a subset of all settlers evolved into microcolonies. Thus, two distinctive phenotypes were identified: Static Colonizers (SC), comprising 60% of the initial colonizers, whereby the bacteria bound to the apatitic surface maintained their volume relatively constant (V(t)≈V(0 min)) (Fig. 4a); and dynamic colonizers (DC), the remaining fraction of colonizers exhibited active growth, which expanded their volume by following the relation V(t) = V(0 min) + a·tb, where “a” is a normalization constant and “b” is the exponential constant of the growth law (Fig. 4c, d). For DC population (V(420 min) » V(0 min)), the growth law becomes the power law24,28 V(t) = a·tb (“t” in minutes and “V(t)” in μm3), which can precisely model the spatial population-growth dynamics. The influence of the bacterial cell number of the surface colonizers (P0) on the growth dynamics is shown in Fig. 4e–g. The median value between different experiments for the normalization constant a is 1 × 10⁻⁵, while for exponent b is 2.6 (red lines in Fig. 4f, g). We compared the number of cells of initial colonizers (single cells, clusters, and aggregates) and their biovolumes at 0 min and at the end of the experimental period at 420 min. As shown in Fig. 4a (three colored lines), most of the single cells had less than the volume of 10 μm3 at 420 min (white line), while clusters developed to a structure with a range of 102–103 μm3 (blue line), and aggregates became large microcolonies (~103 μm3) (green line). In the static population (SC) (red rectangle in Fig. 4b), however, surface colonizers kept their volumes approximately constant regardless of the initial volume or cell number. Based on this analysis, we classified three biofilm developmental stages for DC population: (i) initial colonization: initial colonizers are spatially heterogeneously distributed on the HAD surface with a varied number of cells (P(t0) = P0), ranging from single cells (1 < P0 ≤ 5) and clusters (5 < P0 ≤ 50) to small aggregates (50 < P0 ≤ 300); (ii) individual development: certain colonizers (DC) grow and assemble into microcolonies with varying cell density with well-defined shapes and boundaries (P(t) >300); and (iii) mutual development: subsequent merging of multiple microcolonies into large biofilm structures. Thus, from a spatial and structural perspective, the growth dynamics display a pattern similar to urbanization, whereby some settlers (initial colonizers) stay static while others grow into clusters and aggregates (villages) that further expand toward densely packed microcolonies (cities), which in turn merge to each other resulting in larger biofilm superstructures (megacities).
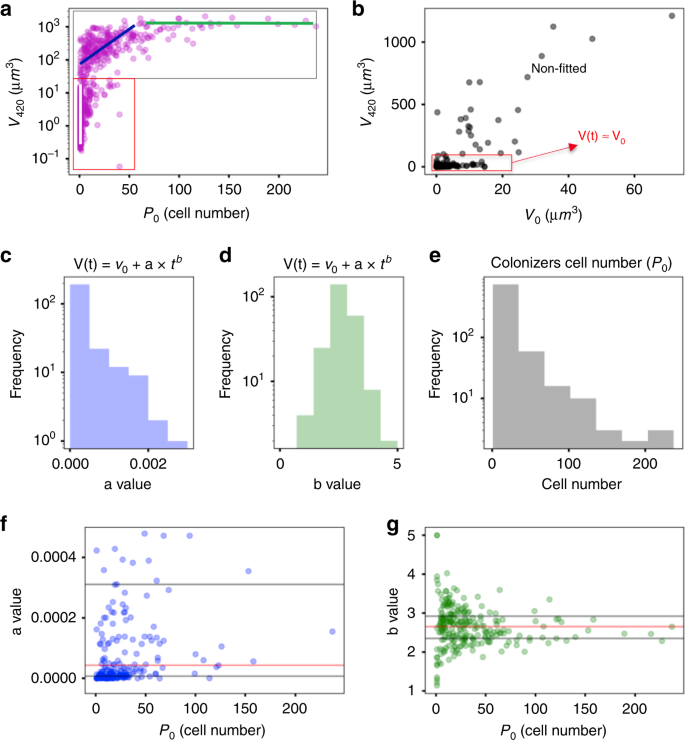
a V(420) as a function of P0 for all bacterial population units (fitted and non-fitted). Bacterial growth followed the power law V(t) = a·tb (for V(420 min) »V(0 min)), which represented around 40% of C (dark gray rectangle), termed dynamic colonizers (DC). b Distribution of V(420) as a function of V(0) for the non-fitted population and also for surface colonizers that do not grow (V(t) ≈V(0)). Non-fitted curves represented less than 0.1% of C. The results represent a large population of bacterial surface colonizers (C > 800), captured from independent experiments (n = 3). c, d Distribution values of the normalization constant (a) and the exponent (“b“) for the fitted curves. e Histogram depicting bacterial cell number of the surface colonizers at t0 (P0). f, g Distribution of “a” and “b” values as a function of P0. Median is represented with red lines, and 1st and 3rd quartiles with dark gray lines (n = 3). Source data are provided as a Source Data file.
Community merging toward a biofilm superstructure
To understand the physical and biological interactions between bacterial communities, we investigated the possible alterations in population-growth dynamics for multiple communities that underwent a merging process (Fig. 5a, b). We considered the centroids of adjacent communities and used the convex hulls from their contact planes to generate 3D scalar fields, in which the volume occupied by the cells was determined over time (see the Z-projections of the 3D scalar fields in blue, red and yellow in Fig. 5c). Interestingly, we did not find significant changes of the growth rate for the microcolonies during merging events under nutrient-rich (1% sucrose) condition (colored vertical lines in Fig. 5d, e indicate the merging moment). Hence, S. mutans communities manifest no clear impairment on each other, which collectively evolves into a densely packed biofilm superstructure as a result of several of these merging processes occurring over time.
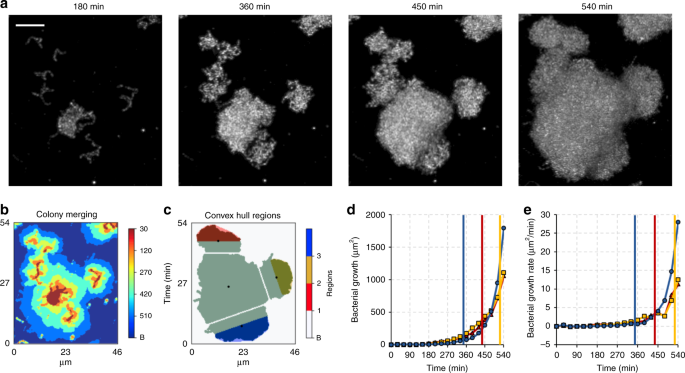
a Time-lapsed confocal images of microcolonies development. Scale bars indicate 10 µm. b Projection map of binarized stacks from 540 min showing elements merging of multiple S. mutans microcolonies along time. c 3D scalar-field analysis (represented as Z-projection) performed for each marginal element merging to the central one. The volumes were calculated for three colored regions of the marginal elements as shown in c. Black dots represent the centroids of each element at 540 min, determined on the Z-projection. d Growth and e growth rate curve of the respective marginal elements. Colored lines indicate the moment of merging to the central element (n = 3). Source data are provided as a Source Data file.
We next examined whether this merging behavior would change in nutrient-limiting conditions. Thus, we monitored the merging events in low sucrose (0.1%) and in feast and famine cycles (alternating between high and low sucrose; see “Methods”). Under low sucrose condition (0.1% sucrose), the biofilm development was substantially delayed disrupting both microcolony formation and the merging dynamics (retarding the merging events by >3 h vs 1% sucrose). Under feast and famine cycles, we found that the growth rate curves oscillate accordingly, but the oscillation was the same for all monitored communities undergoing merging, which indicates that even in nutrients scarcity S. mutans biofilm communities do not manifest a “prey” behavior on each other, i.e., one grows while the other halts or shrinks. Although competition between communities cannot be excluded, its existence in S. mutans biofilms does not impair the development of the population as a whole.
Role of EPS on bacterial growth dynamics and biofilm architecture
The production of extracellular polymeric substances such as exopolysaccharides (EPS) has been considered a vital attribute for the biofilm lifecycle21,29. We assessed whether the evolution of bacterial colonizers toward structured communities (microcolonies) is directly associated with EPS. EPS (glucans) are produced by S. mutans via exoenzymes termed glucosyltransferases (Gtf) using sucrose as substrate30. Using glucan-specific labeling technique based on Gtf activity30, we were able to assess spatiotemporal production of EPS in situ during the various stages of DC growth. The location of glucans was determined as the bacterial cells mediate intercellular adhesion, clustering and microcolony development from submicron to tens of micron in scale.
To investigate the role of EPS during the entire development process, we employed a two-pronged strategy: substrate and enzymatic-based approaches. First, we replaced sucrose with an equimolar concentration of glucose and fructose (sucrose monosaccharide moieties). Glucose and fructose cannot be utilized by Gtfs to produce EPS glucans yet they are efficiently metabolized by S. mutans allowing similar growth rates compared with sucrose-grown conditions. Interestingly, we observed that, in the presence of glucose and fructose, the colonizers grew as interwoven chains, forming a filamentous mesh-like morphology (Fig. 6a) without detectable EPS or development of microcolonies. In sharp contrast, the EPS were produced in the presence of sucrose and found co-localized or closely associated on the surface and in between individual cells. The EPS also enmeshed the cells forming a matrix that bridged them together into clusters, leading to structured aggregates or microcolonies as the time elapsed (Fig. 6b), resembling the matrix-mediated V. cholerae and P. aeruginosa cell clustering7,12. To further assess the role of EPS on the dynamics of bacterial community structuring, we added EPS-degrading enzymes (mutanase and dextranase) during biofilm growth. These enzymes can effectively reduce the accumulation of EPS by digesting them without affecting bacterial viability or growth rate31,32,33, thus allowing assessment of matrix contributions to biofilm development. As shown in Fig. 6c, EPS was minimally detected throughout the time-lapsed experiment when glucanohydrolases (mutanase and dextranase) were present during S. mutans biofilm growth in 1% sucrose, indicating its degradation by the enzymes during the experimental period. As a result, the cells were unable to form structured microcolonies, resembling the morphology of those grown in glucose and fructose (Fig. 6a).
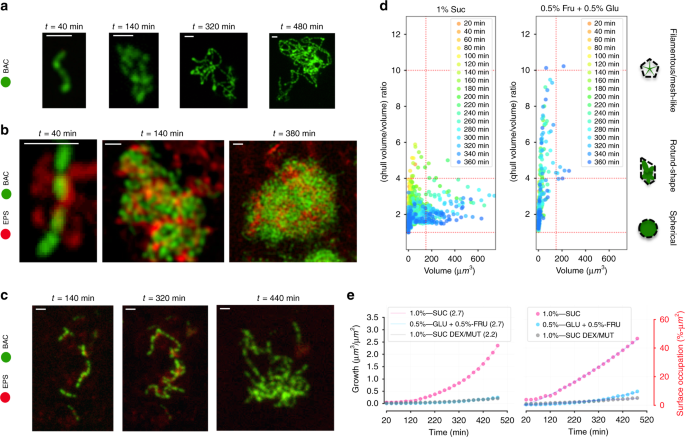
Z-projection (max intensity) of the CLSM images stack showing S. mutans growth on HAD in (a) 0.5 %-w/v fructose + 0.5 %-w/v glucose (0.5% Fru + 0.5% Glu) for bacteria (green), in (b) 1 %-w/v sucrose (1% Suc) for bacteria (green) and extracellular polymeric matrix (red), and in (c) 1 %-w/v sucrose with EPS-degrading enzymes (1% Suc, Dex/Mut) for bacteria (green) and extracellular polymeric matrix (red) over time. Scale bar indicates 2 μm. d Morphological analysis of the biofilm-forming elements formed over time, evaluated by the ratio between the volume and the convex hull volume (Volume/qhull volume). e Curves showing volume growth and surface area occupation of S. mutans growing on HAD in different conditions (n = 3). Source data are provided as a Source Data file.
To quantitatively compare the effect of the EPS production on the morphological evolution of DC, we determined the volume of the convex hull34 (qhull Volume) for each microorganism community captured in the stack (see Supplementary Fig. 3). By calculating the ratio of the convex hull volume over total biomass volume (qhull volume/volume), we determined the pattern of each element of the population, and we quantitatively determined how similar the community morphology is to a sphere or to a branched pattern (i.e., determination of the solidity; Supplementary Fig. 3) in each experimental condition. When the biofilm was grown in 1% sucrose, most of the elements in the population had an R(qhullVolume/Volume) smaller than 4, and this ratio decreases at later periods when the element volume increases (around R(qhullVolume/Volume) = 2 at 360 min). On the other hand, in the presence of 0.5% glucose + 0.5% fructose, the communities evolve to a high R(qhullVolume/Volume) (>4), even for elements with small volumes (<180 µm3). Interestingly, morphological homogeneity was observed in the shape of the communities formed in 1% sucrose over time (horizontally scattered points in Fig. 6d left panel). Furthermore, when mutanase and dextranase were added, the community structural shape was similar to that observed with 0.5% glucose + 0.5% fructose, in which EPS is absent (Fig. 6d right panel). For both conditions, whereby EPS-matrix assembly was compromised, the bacterial volume/accumulation was significantly lower compared with that in 1% sucrose as time elapsed (Fig. 6e left panel). This decrease in the biovolume reflects on the coefficient “a” value of the equation that fitted the curves (Fig. 6e left panel), in which the “a” value for the 1%-Suc experiment (EPS present) is several-fold larger (>5) than for experiments where EPS is absent (0.5% Fru + 0.5% Glu) or degraded (1% Suc + Dex/Mut). The same behavior was observed when the surface occupation by bacteria was analyzed over time: EPS production favors S. mutans to spread and colonize more efficiently the available surface (Fig. 6e right panel).
We also determined that the mechanical stability of the microbial communities (surface attachment) is also associated with EPS, which prevent the sloughing of clusters and microcolonies as they grow under the flow. Indeed, the presence of EPS-degrading enzymes (mutanase and dextranase) resulted in the displacement of bacterial clusters on HAD (Supplementary Fig. 4A). In addition, time-lapsed single-cell imaging analysis showed that S. mutans cell chains grown in 0.5% glucose + 0.5% fructose (EPS glucans absent) were unstable when oriented orthogonally, collapsing to the bottom over time (Supplementary Fig. 4B; see arrows). Altogether, degradation or absence of EPS scaffolding resulted in bacterial communities that lacked structural integrity and stability, disrupting the ability of colonizing cells to pack together and expand tri-dimensionally during growth, which prevented the establishment of organized microcolonies.
Growth dynamics in mixed communities
Biofilms found in clinical or environmental settings are often comprised of different species that can co-exist or antagonize like good and bad neighbors. Previous studies have shown an intriguing cross-kingdom symbiotic relationship between the fungus Candida albicans and S. mutans35,36,37, whereby both organisms can grow together in sucrose. In contrast, Streptococcus oralis can antagonize by producing hydrogen peroxide (H2O2)38, which can inhibit S. mutans growth. However, how these relationships locally affect the population-growth dynamics from initial colonizers to further development into biofilms remains unexplored. We found that the growth of S. mutans co-cultured with S. oralis J22 (Sm-So) was drastically impaired, as determined by the power law (V(t) = a·tb). Curve fitting analyses showed a > five-fold lower a value compared with that from either single-species S. mutans (Sm) or C. albicans-S. mutans mixed biofilms (Sm-Ca; Fig. 7a). Such changes resulted in S. oralis overtaking S. mutans population and disrupting further growth. In contrast, the presence of C. albicans did not alter the growth dynamics of S. mutans (Fig. 7a), while causing major structural changes in the mixed biofilm. The biovolumes of S. mutans in mixed Sm-Ca biofilm at early time points (<100 min; highlighted red box) were substantially higher (green dots in Fig. 7a) compared with those from S. mutans in single-species biofilm (dark purple dots). This disparity may be associated with changes in the structural organization and/or biovolume when C. albicans were co-cultured with S. mutans during mixed-species biofilm development.
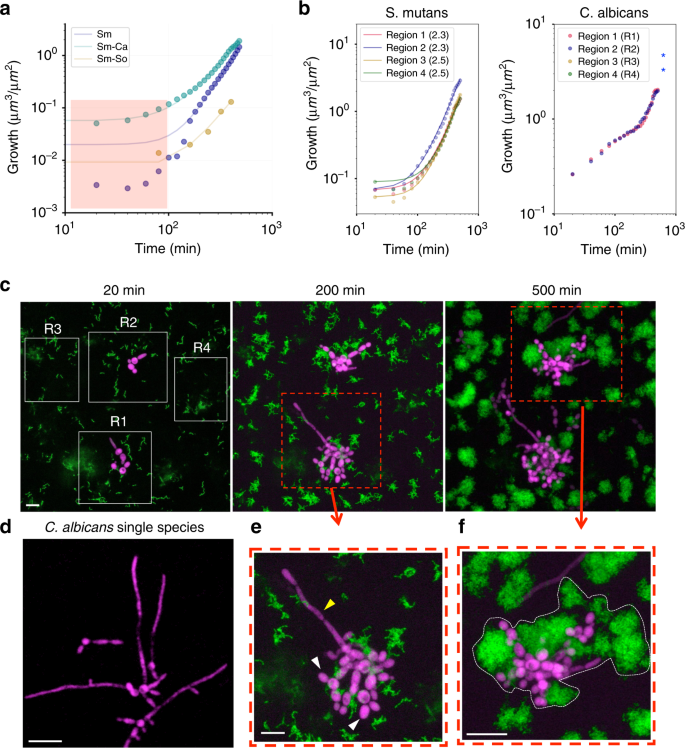
a Growth curve (dots) and fitting (lines) for S. mutans in single-species biofilm (Sm; dark purple dots), in cross-kingdom biofilm (Sm-Ca; green dots), and in mixed-bacterial species biofilm (Sm-So; yellow dots). b Localized S. mutans and C. albicans growth curves at distinct sites (R1, R2, R3, and R4 as shown in c). Exponent b values are in parenthesis. c Z-projection (max intensity) of the CLSM images stack showing growth of S. mutans and C. albicans on HAD, with bacteria (green) and fungi (purple) channels, (e, f) zoom-in images of S. mutans superstructures formed in the presence of C. albicans (also highlighted by dotted-white line in f). d Z-projection of the CLSM image of C. albicans single-species biofilms. Scale bars indicate 10 µm. Source data are provided as a Source Data file.
To further investigate this cross-kingdom interaction, the volume occupation was calculated for both the bacterium and fungus based on each individual fluorescence signal (Fig. 7b, c) by separating four representative 3D regions in the CLSM images stack (R1, R2, R3, and R4). In the four regions, S. mutans in the mixed biofilms grew under the same power law previously identified when it developed alone (Volume = a·tb). Exponent b varied between 2.3 and 2.5 in the regions, indicating that C. albicans cell did not compete with S. mutans and were able to share the nutrient (1% sucrose), thereby maintaining similar bacterial growth dynamics to that found in single-species S. mutans biofilm. However, when assessing the morphological development of the biofilm, we found that C. albicans caused intriguing changes in the spatial arrangement of the cells when co-cultured with S. mutans on the HAD surface. C. albicans grew occupying interstitial spaces of S. mutans communities (Figs. 7c–f), “stitching” different clusters and microcolonies together. The chain of yeast cells were bound in-between the S. mutans clusters even at early time points (at 200 min), leading to larger structures (at 500 min) than the microcolonies without C. albicans (i.e., R1 and R2). Interestingly, hyphae formation by C. albicans largely decreases when compared with a single-species C. albicans biofilm (Fig. 7d). In situ analyses revealed that C. albicans in the close proximity to S. mutans maintained yeast form (white arrows), while remotely located C. albicans displayed hyphal form (yellow arrow; Fig. 7c-i).
Altogether, the data reveal unique structural organization between bacteria and fungi at micron-scale which substantially impacted the morphology at large scale. It appears that the co-existence between S. mutans and C. albicans can promote the merging events, which resulted in larger mixed communities (possibly with greater stability) at earlier stages of biofilm development. Hence, cooperation between different neighboring communities accelerates the conurbation process, leading to the formation of a larger biofilm superstructure (city) more rapidly.
Source: Ecology - nature.com
