Changes in hydrothermal factors before, during, and after precipitation
Soil temperature
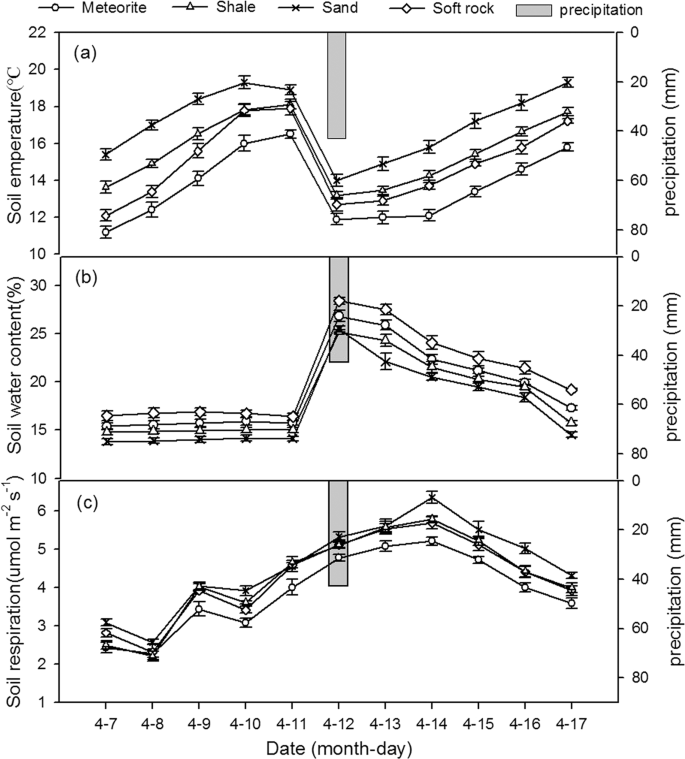
Figure 1(a) shows the change in soil temperature for 11 days (i.e. five days before, one day during, and five days after the first precipitation event). Precipitation significantly reduced soil temperature. During the observation period, temperature of all reconstructed soils increased before and after precipitation, only decreasing during the precipitation event. Relative to one day before precipitation, temperature of meteorite, shale, sand, and soft rock reconstructed soils decreased by 27.9%, 27.2%, 25.9%, and 29.1%, respectively. The temperature of reconstructed soils gradually increased before precipitation, and the upward trend decreased on the fifth day. The sand reconstructed soil even showed a decreasing trend. After precipitation, the temperature rose every day until pre-rainfall levels were restored. The temperature was not significantly different among the four reconstructed soils before precipitation. During and after precipitation, the reconstructed soils with added meteorite were significantly lower than the other reconstructed soils (p < 0.05), the reconstructed soils with added sand were significantly higher than the other soils (p < 0.05), but the reconstructed soils with added shale and soft rock did not show a significant difference (p > 0.05).

The change trend of temperature (a), volumetric water content (b) and respiration rate (c) of the four kinds of reconstructed soils during the first rainfall.
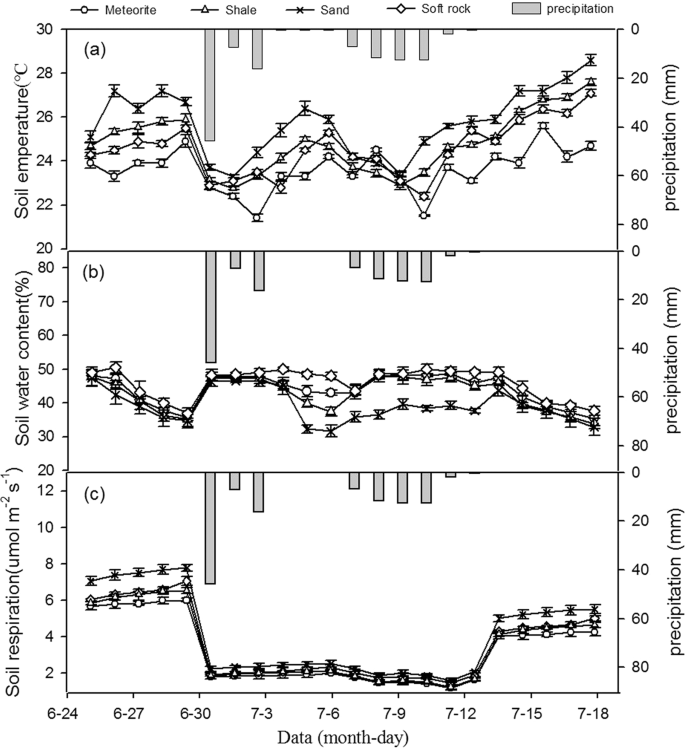
Figure 2(a) shows the change in soil temperature for 22 days (i.e. five days before, 12 days during, and five days after the second precipitation event). The precipitation significantly reduced soil temperature. During the observation period, the temperature of four reconstructed soils increased before and after precipitation, but with great temperature fluctuations after precipitation. Relative to one day before precipitation, average soil temperature decreased 7.3%, 8.0%, 7.4%, and 6.8% during the precipitation in meteorite, shale, sand, and soft rock, respectively. Before the second precipitation event, the reconstructed soils with added sand were significantly higher than the other soils (p < 0.05). The temperatures of the reconstructed soil with added shale and soft rock were not significantly different (p > 0.05). During the precipitation event, the temperature differences of the four reconstructed soils were not significant (p > 0.05). After precipitation, the reconstructed soils with added shale were significantly higher than the soils with added meteorite (p < 0.05).

The change trend of temperature (a), volumetric water content (b) and respiration rate (c) of the four kinds of reconstructed soils during the sencond rainfall.
Soil water
Figure 1(b) shows the change in soil volumetric water content for 11 days (i.e. before, during, and after the first precipitation event). Precipitation increased water content of the reconstructed soils. During the observation period, the soil volumetric water content was relatively stable before precipitation in all soils. During precipitation, soil volumetric water content significantly increased. The volumetric water content of the meteorite, shale, sand, and soft rock reconstructed soils increased by 41.6%, 27.2%, 26.0%, and 29.1% relative to one day before precipitation, respectively. After precipitation, the soil volumetric water content gradually decreased. The volumetric water content of meteorite, shale, sand, and soft rock reconstructed soils adding were significant different to each other before precipitation (p < 0.05) (soil volumetric water content of: soft rock> meteorite> shale> sand). There were no significant differences in soil volumetric water content among the four reconstructed soils during and after precipitation (p > 0.05).
Figure 2(b) shows the change in soil volumetric water content for 22 days (i.e. before, during and after the second precipitation event). During the first five days of the second precipitation event, the average volumetric water content of the meteorite, shale, sand, and soft rock soils was 41.9%, 41.0%, 39.8%, and 43.9%, respectively. The average volumetric water content of each soil increased to 46.5%, 45.1%, 39.6%, and 48.5%, respectively, and then gradually decreased. The average volumetric water content of the meteorite, shale, sand, and soft rock reconstructed soils during the five days after precipitation was 40.1%. 38.4%, 37.8%, and 42.0%, and decreased to 35.4%, 33.9%, 32.8%, and 37.6%, respectively, by the fifth day after precipitation. There was no significant difference in soil volumetric water content of the four reconstructed soils before or after precipitation (p > 0.05). During the second precipitation event, the soil water content of the sand reconstructed soils was significantly lower than the other reconstructed soils (p < 0.05). During the observation period, the volumetric water content of all reconstructed soils decreased gradually five days before precipitation. During the precipitation event, the precipitation first increased, then gradually decreased, then increased again and gradually stabilized; this was significantly related to the total precipitation time and quantity. On July 2, after 45.7 mm precipitation, soil volumetric water content increased significantly. From July 3 to 4, precipitation continued, the volumetric water content was relatively stable, and the frequent precipitation caused the soil water content to accumulate and saturate. From July 5 to 7, there was little precipitation and the soil volumetric water content began to decline, and on July 8, the precipitation increased, causing the soil volumetric water content to start increasing, until gradually stabilizing. The volumetric water content began to decrease after precipitation.
Changes in soil respiration before, during, and after precipitation
Figure 1(c) shows soil respiration for 11 days, i.e. before, during, and after the first precipitation event. During the first five days, the average respiration rate of meteorite, shale, sand, and soft rock reconstructed soils was 3.05, 3.42, 3.64, and 3.40 μmol m−2 s−1, respectively, and increased during the precipitation event to 5.22, 5.69, 6.36, and 5.79 μmol m−2 s−1, respectively; it decreased after five days of precipitation to 4.44, 4.82, 5.16, and 4.87 μmol m−2 s−1, respectively. Precipitation significantly stimulated soil respiration rate of all reconstructed soils. During the observation period, the respiration rate of all reconstructed soils increased before precipitation, and after precipitation it decreased until reaching the soil respiration rate levels before precipitation. The respiration rate of meteorite, shale, sand, and soft rock reconstructed soils increased by 23.2%, 19.3%, 28.1%, and 19.5% relative to one day before precipitation, respectively.
The respiration of meteorite reconstructed soil was significantly lower than the other reconstructed soil in the different periods of precipitation (p < 0.05). In contrast, the respiration of shale and soft rock reconstructed soils showed no significant differences (p > 0.05).
Figure 2(c) shows the soil respiration for 22 days (i.e. before and after the second precipitation event). During the first five days of the second precipitation event, the average respiration rate of reconstructed soils with added meteorite, shale, sand, and soft rock was 5.86, 6.49, 7.49, and 6.27 μmol m−2 s−1, respectively, and the average respiration rate during precipitation was 1.70, 1.95, 2.19, and 1.80 μmol m−2 s−1, respectively; i.e. there was a reduction of approximately 70.9%, 70.0%, 70.8%, and 71.3%, respectively. After five days of precipitation, the average values of soil respiration rate for meteorite, shale, sand, and soft rock reconstructed soils were 4.16, 4.61, 5.32, and 4.45 mol m−2 s−1, respectively; i.e. relative to the values before precipitation, there was a decrease of 29.3%, 30.2%, 32.6%, and 28.9%, respectively. This event generally inhibited respiration rate of the reconstructed soils, especially during precipitation. During the observation period, respiration rate of all reconstructed soils increased slowly before precipitation, and it showed an upward trend after precipitation, gradually stabilizing. However, the soil respiration rates did not return to the values observed before precipitation. The respiration rate of the meteorite, shale, sand, and soft rock reconstructed soils decreased by 69.8%, 72.7%, 71.0%, and 71.4% relative to one day before precipitation, respectively.
There was no significant difference in respiration among the four reconstructed soils during precipitation (p > 0.05). Before and after precipitation, the respiration rates of the sand reconstructed soil were significantly higher than the meteorite reconstructed soil (p < 0.05). In contrast, there were no significant differences in respiration rates between the shale and soft rock reconstructed soil (p < 0.05).
According to both precipitation analyses, the respiration trends of all reconstructed soils were similar for the two precipitation events, but soil respiration showed different degrees of difference in the different periods (before, during, and after) of precipitation.
The Relationship between soil respiration and hydrothermal influence factors before, during and after precipitation
Soil respiration and soil temperature
The relationship between respiration rate and temperature of all reconstructed soils was consistent with the exponential model (RS = a ebT), but the amount of variation in respiration rate explained by temperature was different for the four reconstructed soils (Table 2).
During the second precipitation event, the explanatory power of temperature of all reconstructed soils with respect to the soil respiration rate was less than during the first precipitation event. During precipitation, the temperature of different reconstructed soils had the highest explanatory power, followed by before precipitation, and was lowest after precipitation (the regression coefficient R2 of the exponential model was expressed as during precipitation > before precipitation > after precipitation). The exponential model was not a good fit for the relationship between temperature and respiration of the four reconstructed soils after the two precipitation events.
Soil respiration and soil volumetric water content
The relationship between respiration rate and volumetric water content for all reconstructed soils was consistent with a quadratic polynomial model (RS = a w2 + b w + c) (Table 3).
During the second precipitation event, the soil water content of all reconstructed soils explained the soil respiration rate worse than during the first precipitation event. Compared among the different periods of precipitation, the volumetric water content had the highest ability to respiration of different reconstructed soils, followed by before precipitation, and the lowest after precipitation.
Soil respiration, soil temperature and soil volumetric water content
During different periods (before, during, and after precipitation), exponential model of soil respiration rate and soil temperature (Table 2) and a quadratic curve model of soil respiration rate and soil volumetric water content (Table 3) can be used to determine the main factors affecting the respiration of reconstructed soils. It can be seen that the second period of the reconstructed soil was lower than the determinable coefficient of the first precipitation event in the same period (Table 4), indicating that the power-exponential model (two-factor model) had a stronger ability to represent the first precipitation event than the second precipitation event, which was the same as the two single-factor models of temperature (exponential model) and volumetric water content (binomial model) characterizing soil respiration rate changes.
Models of two single factors and both factors explaining reconstructed soils respiration were compared for the different periods of precipitation (before, during, and after). The temperature before the first precipitation event was the main influencing factor for respiration of meteorite, shale, sand, and soft rock reconstructed soils, explaining 67%, 61%, 61%, and 64% of the soil respiration rate variation, respectively. Alternatively, the combination of temperature and moisture during precipitation explained 98%, 96%, 94%, and 96% of the soil respiration rate variation in meteorite, shale, sand, and soft rock reconstructed soils, respectively. After precipitation, water was the main influencing factor of soil respiration, explaining 87%, 82%, 88%, and 88% of the soil respiration rate variation in meteorite, shale, sand, and soft rock reconstructed soils, respectively. Before the second precipitation event, soil volumetric water content was the main factor influencing respiration of the meteorite, shale, sand, and soft rock reconstructed soils, explaining 55%, 55%, 53%, and 53% of the soil respiration rate variation, respectively. During the precipitation event, the respiration of meteorite, shale, sand, and soft rock reconstructed soils was affected by temperature and soil volumetric water content, which explained 90%, 68%, 77%, and 85% of the soil respiration rate variation, respectively. After precipitation, soil volumetric water content was the main factor influencing respiration of meteorite, shale, sand, and soft rock reconstructed soils, explaining 62%, 59%, 51%, and 70% of soil respiration rate variation, respectively.
Source: Ecology - nature.com


