Seed collection and source populations
Blackgrass seeds were collected in 2014 from 132 wheat production fields from 71 farms across England47. Seeds were sampled using a stratified-random approach from ten locations within each field. At each location, seeds were collected from multiple plants, sampled from a circumference of ~5–10 m. A single representative seed population for each field was subsequently generated by combining 50% by weight of seed collected at all sampling locations within a field. These field-scale seed populations were used in all phenotypic and genotypic assays reported here. Blackgrass abundance in each field was visually recorded using a density-structured approach55, and with a density calculated per field on a scale of 0–4 (absent–very high).
Glasshouse resistance phenotyping
Phenotypic herbicide resistance was established using glasshouse dose–response experiments conducted over October 2014–May 2015. Three herbicides were tested: a commercial formulation of mesosulfuron-methyl + iodosulfuron (site of action; ALS: chemical class; SU), fenoxaprop-p-ethyl (site of action; acetyl-CoA-carboxylase, ACCase: chemical class; aryloxyphenoxypropionate, ‘Fop’), and cycloxydim (site of action; acetyl-CoA-carboxylase, ACCase: chemical class; cyclohexanedione, ‘Dim’). All herbicides are registered for blackgrass control. For each herbicide, the dose–response design consisted of six treatments (five herbicide doses plus a no-herbicide control). For the ALS herbicide, ‘mesosulfuron’, doses were 2.7, 5.4, 10.8, 21.6 and 43.2 g a.i. ha−1 (current recommended UK field rate is 14.4 g a.i. ha−1), fenoxaprop doses were 17.19, 34.38, 68.75, 137.5 and 275 g a.i. ha−1 (current UK field rate is 68.75 g a.i. ha−1), while cycloxydim doses were 37.5, 75, 150, 300 and 600 g a.i. ha−1 (current UK field rate is 150 g a.i. ha−1).
Seeds from each population were pre-germinated in an incubator (Sanyo, MLR-350) with a 17/11 °C temperature cycle and a 14/10 h light/dark cycle, before sowing into 8 cm plastic plant pots filled with a Kettering loam soil, mixed with 2 kg m−2 osmocote fertiliser. Eighteen pots, each with six seedlings, were sown per population, providing three pots at each herbicide dose. Replicate pots were blocked over three glasshouse compartments, with the position of pots within each compartment determined using a randomised alpha design. The glasshouse was set to maintain ~16 °C during the day and 10 °C at night, with a 14/10 h day/night cycle. Three reference populations with known herbicide resistance phenotypes (herbicide susceptible, target-site resistant and non-target-site resistant) were included as positive and negative controls. Over the three dose–response experiments, we phenotyped 324 plants per population, with over 40,000 plants phenotyped in total. Plants were maintained in the glasshouse for 2–3 weeks until they reached the 3–4 leaf stage. At this point, pots were removed from the glasshouse and sprayed with herbicide using a fixed track sprayer with a Teejet 110015VK nozzle placed 50 cm above the plant canopy. The boom speed was set at 0.33 m s−1, and herbicide was applied at a volume of 197–213 L ha−1. After spraying, pots were immediately returned to the glasshouse. After 3 weeks, the number of surviving plants per pot was assessed, and above-ground tissue was harvested on a per pot basis. Leaf tissue was oven dried at 80 °C for 48 h before weighing to determine plant biomass.
Target-site resistance sequencing
Known TSR mutations within the ALS and ACCase genes were analysed using pyrosequencing56. Approximately 2 cm of air-dried leaf material was homogenised in 400 µl of extraction buffer (100 mM Tris (HCl) and 1 M KCl at pH 9.5). A 5 µl aliquot of the resulting supernatant was diluted using 250 μl PCR grade water (Merck, Darmstadt, Germany) and used in PCR reactions containing HotStar Taq Master Mix (Qiagen, Hilden, Germany) and biotinylated primers. Two ALS fragments were amplified to include amino acid positions 197 or 574, sites at which resistance conferring mutations have previously been documented. Two ACCase fragments were amplified, the first of which included amino acid position 1781 and the second of which spanned positions 2027, 2041, 2078 and 2096; all sites where resistance conferring mutations have been reported. The biotinylated ALS and ACCase fragments were used in pyrosequencing reactions to amplify individual target-sites using site-specific primers. For pyrosequencing, 12 µl of amplified biotinylated PCR product was combined with a 70 µl solution containing binding buffer and streptavidin-coated Sepharose beads and shaken for 5 min, before washing and drying DNA coated beads at 80 °C. Sequencing was carried out using a Pyromark Q96 MD pyrosequencer (Qiagen, Hilden, Germany). In total, genotyping data were generated for 2574 individual plants (n ≥ 16 plants per population). All primer sequences, fragment lengths and PCR conditions are given in Supplementary Table 5. The geographical distribution of target-site mutations was visualised using ArcMaps (version 10).
To determine the importance of TSR mechanisms on the observed herbicide resistance phenotypes, we used the genotype sequencing (above) to calculate the proportion of individuals in each population which would be expected to survive each of the three tested herbicides, based on presence of TSR mutations alone. Whilst different ALS and ACCase mutations in A. myosuroides may vary in their protective efficacy, previously published information, e.g.,20,57,58,59 suggests that they can be considered dominant in conveying survival at field-relevant herbicide doses. Using this information, the proportion of individuals carrying TSR resistance to each herbicide was calculated, hereafter referred to as the ALS, Fop and Dim TSR frequencies. The ACCase 2096 Glycine—Alanine substitution is reported to convey variable levels of resistance to Dim herbicides20, but as some Dim resistance is reportedly provided by this mutation in A. myosuroides it was considered as a Dim resistance mutation in the current study.
Quantification of AmGSTF1 protein abundance
To determine the importance of the ‘generalist’ NTSR for these herbicides, we quantified the foliar concentration of AmGSTF1; a phi-class glutathione-S-transferase protein which has been validated as a marker for NTSR in blackgrass32,45 (and see Supplementary Fig. 2). Seeds from each population were pre-germinated as previously described, and seedlings were sown into 8 cm plastic plant pots filled with a standard soil mix (see above). Three replicate pots were sown per population, each containing 15 seedlings, and were maintained within a single glasshouse compartment for 2 weeks until the plants reached the two-leaf stage. Glasshouse conditions were as described above, and the position of pots was fully randomised within the compartment. After 2 weeks of growth, the above-ground leaf and shoot material were harvested on a per replicate pot basis (n = 3) and immediately flash frozen in liquid nitrogen. Harvested tissue was stored at −80 °C until analysis.
Total protein was extracted from 100 mg of pulverised foliage tissue with 500 µL of cold protein extraction buffer (100 mM Tris-HCl, 150 mM NaCl and 5 mM EDTA, adjusted to pH 7.5 with NaOH, and with the addition by volume of 5% glycerol and 2% PVPP (polyvinylpolypyrrolidone)). The mixture was incubated on ice for 15 min, and centrifuged twice at 12,000 × g, 4 °C for 15 min. Total protein concentration was determined by Bradford assay (Bio-Rad protein assay kit, Bio-Rad, California). Protein concentration was calculated from a standard curve of bovine serum albumen (BSA).
AmGSTF1 protein concentration was quantified by enzyme-linked immunosorbent assay using specific sheep antibodies for blackgrass GSTF1 protein. The 96-well microtiter plates were coated overnight at 4 °C with 100 µL of primary antibody (S909-D, diluted to 1 µg ml−1 in phosphate saline buffer). Plates were washed four times with phosphate saline buffer containing 0.1% tween 20 (PBS-T), and 200 µL PBS containing 1% BSA was added to each well to block unspecific binding of the antigen–antibody. Plates were incubated for 1 h at room temperature and then washed four times with PBS-T. 100 µl of plant protein samples was added and a dilution series of recombinant AmGSTF1 protein (0–1000 ng mL−1) was also included on each plate to provide a standard curve for quantification. Plates were incubated for 1 h at room temperature in the vertical shaker (150 rpm). Plates were washed with PBS-T before addition of 100 µl of secondary antibody conjugated with horseradish peroxidase (S908D-HRP, diluted to 25 ng ml−1 in PBS-T). Plates were incubated in a vertical shaker for 1 h, then washed with PBS-T, before addition of 100 µl of a tetramethylbenzidine solution to each well. Plates were incubated in the dark at room temperature for 30 min. Absorbance at 655 nm was measured using a microplate reader (iMark, Bio-Rad). The reaction was stopped by addition of 50 µl of 1 M HCL and the absorbance at 450 nm was determined. Samples and standards were analysed in duplicate. The concentration of the AmGSTF1 protein was calculated from standard curve (four-parametric logistic regression fitting) of recombinant AmGSTF1 protein.
Field management histories
Field management histories were collected for 94 of the 132 blackgrass populations47 and provide a mean of 7 years data on historical herbicide usage. These data were used to calculate indices of the intensity and heterogeneity of herbicide selection. To correspond with the herbicides used within the glasshouse phenotyping assays, measures of herbicide intensity were calculated as the mean annual number of applications of SU, ‘Fop’ and ‘Dim’ herbicides. Reflecting variance in both the number of year’s exposure, and the frequency of applications within year, herbicide intensity measures the degree to which each herbicide class has historically been used for each population. Herbicide diversity was measured as the mean number of different herbicide MOAs applied each year, giving an estimate of the range of herbicide MOAs used (see Supplementary Table 6). A measure of herbicide mixing was calculated as the mean number of different herbicide MOAs being applied on the same day. We made no distinction between mixtures applied at different times of year, or between pre-formulated herbicide products containing multiple MOAs versus separate single MOA herbicide products being applied simultaneously. Higher values indicate a greater likelihood that herbicides from any one MOA are applied alongside one or more herbicides from another MOA. In addition to these measures, the mean blackgrass density for each field was used as a measure of blackgrass population abundance, the proportion of years fields had been sown to autumn crops was calculated, and an index representing cultivation intensity was used, varying from 0 (no soil movement, e.g., direct drilling) to 4 (substantial soil movement, e.g., ploughing)47. All data were stored as comma separated value files before analysis (Microsoft Excel, version 15.0.5233.1000).
Statistical analysis
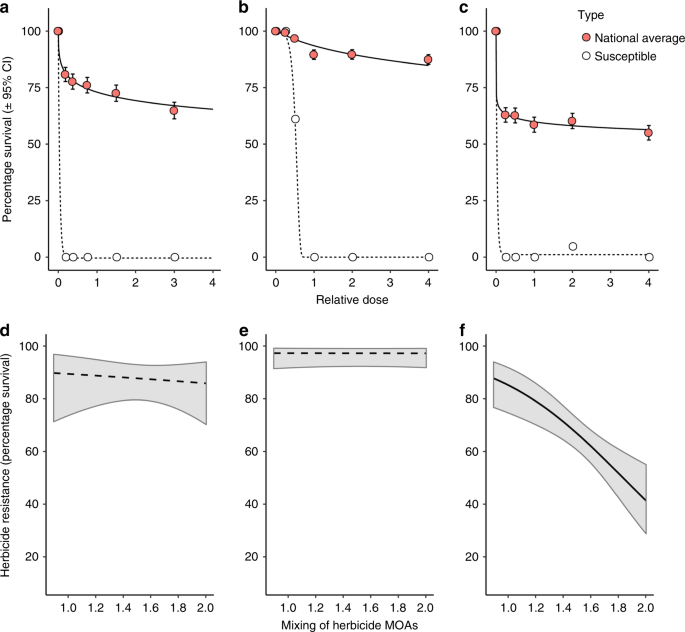
A dose–response curve fitting approach was used for the herbicide phenotyping data (survival of n = 18 plants per dose, per population). Data from all field populations, overall three herbicide screening experiments were included, with the model fitting a separate curve for each herbicide. In this way, the fitted curve for each herbicide is estimated using data from all of the screened populations, providing a relative estimate of resistance to each herbicide at the national scale. Models were initially fitted with two-parameter log-logistic, Weibull type-1 and Weibull type-2 curve types. The two-parameter Weibull type-2 model was retained for analysis based on comparison of each models Akaike’s information criterion. For comparison, a dose–response model was also fitted for each herbicide using herbicide screening data from a fully susceptible standard population. To avoid problems with model convergence, three separate models were fitted for the standard susceptible population, one for each herbicide tested. Results from this fully herbicide susceptible population are provided for reference, to illustrate the extent of resistance evolution amongst the national collection of field blackgrass populations. All models were fitted using the ‘drc’ package60 in R version 3.4.2.
Generalised linear mixed models (GLMM) were used to analyse herbicide selective histories as predictors of herbicide resistance phenotype for the three herbicides. Survival of individuals at each dose (n = 18) was specified as the (binomial) response variable, with population ID and herbicide dose included as random factors. The measures of field selection history, including the calculated indices of herbicide intensity and heterogeneity, blackgrass abundance, and location were added sequentially as fixed effects to the models, and their significance estimated using parametric bootstrapping with the package ‘pbkrtest’ version 0.4–761. In this way, the importance of herbicide mixtures is assessed from models containing fixed effect terms, which already account for variation in herbicide intensity and the overall diversity of herbicide products applied. Herbicide intensity (annual frequency of applications) was calculated separately for the SU, Fop and Dim herbicides, and in each case the corresponding herbicide intensity variable was used in models of SU, Fop or Dim resistance. Data for each herbicide were analysed separately, and models were fitted using the ‘lme4’ package62 in R version 3.4.2.
Further GLMM models were used to establish the significance of the TSR resistance frequency, AmGSTF1 protein concentration, and their interaction, as predictors of phenotypic herbicide resistance (survival). Again, the survival data were modelled as a binomial response, with population ID and herbicide dose included as random factors. Terms representing the two resistance mechanisms and their interaction were added to models sequentially as fixed effects, and their significance estimated using parametric bootstrapping as above. The AmGSTF1 variable was log-transformed before analysis.
A final set of mixed model analyses was used to assess the association between herbicide selective histories and the measures of TSR and NTSR resistance. For TSR, all three measures of TSR (the proportion of plants with TSR to the SU, Fop and Dim herbicides) were included as the response variable, and analysed using a binomial GLMM. A random effect term was included for the resistance MOA (SU, Fop and Dim), and a further random effect term for the population ID. For the ‘NTSR’ model, all three replicate measurements of the AmGSTF1 protein concentration were included as the response variable, analysed using a linear mixed model. AmGSTF1 protein concentrations were log-transformed before analysis. A random effect term was included for the ‘rep’, and a further random effect term for the population ID. In both models, as previously, field management variables representing the selective history were added sequentially as fixed effects, and their significance assessed using parametric bootstrapping with the package ‘pbkrtest’ version 0.4–7. The combined frequency of applications of SU, Fop and Dim herbicides was used as the measure of herbicide intensity. All models were fitted using the ‘lme4’ package62 in R version 3.4.2.
As a further test, the TSR models were then re-run for each TSR MOA (SU, Fop and Dim) separately, i.e., a separate model for TSR to the SU herbicides, the aryloxyphenoxypropionate herbicides (Fop) and the cyclohexanedione-oxime herbicides (Dim). In each case, model fitting and assessment of significance was as described above, with the exception that models were no longer fitted with a random effect term for the resistance MOA, as each MOA was analysed in a separate model. As in the models of phenotypic herbicide resistance, the annual frequency of applications of either SU, Fop or Dim herbicides was used as the measure of ‘herbicide intensity’ for the SU, Fop, or Dim TSR resistances, respectively. The overall results of all fitted mixed models are given within Supplementary Tables 1–4.
Reporting summary
Further information on research design is available in the Nature Research Reporting Summary linked to this article.
Source: Ecology - nature.com

