Enrichment and cultivation of anammox bacteria
Biomass from upflow column reactors (XK 50/60 Column, GE Healthcare, UK) with Ca. Brocadia and Ca. Scalindua were harvested and used as inoculum. Ca. Brocadia and Ca. Scalindua planktonic cells were enriched in two bioreactors (BioFlo®115, New Brunswick, USA) equipped with a microfiltration (average pore size 0.1 µm) hollow fiber membrane module (Zena-membrane, Czech Republic) (Supplementary Fig. 1a). Operating conditions of the membrane bioreactors (MBRs) were described previously15. The MBRs were operated at pH 7.5–8.0 and 35 ± 1 °C for Brocadia and room temperature (20–25 C) for Scalindua. The culture liquid in the MBRs was continuously mixed with a metal propeller at a stirring speed of 150 rpm and purged with 95% Ar–5% CO2 at a flow rate of 10 mL min−1 to maintain anaerobic conditions. The inorganic synthetic medium was fed continuously to the reactors at a rate of ~5 L d−1 and hydraulic retention time was maintained at one day. The synthetic medium was prepared by adding the following constituents; NH4+ (2.5–10) mM, NO2− (2.5–12) mM, CaCl2 100 mg L–1, MgSO4 300 mg L–1, KH2PO4 30 mg L–1, KHCO3 500 mg L–1, and trace element solutions36. In the case of Ca. Scalindua culture, the synthetic medium was prepared using non-sterilized Red Sea water. Samples for microbial community characterization were taken from the MBRs for FISH and metagenomics analysis (see FISH and DNA extraction, metagenome library preparation, sequencing and sequence processing and analysis sections below). A previously enriched K. stuttgartiensis culture was also used for the experiments4.
Incubation of anammox bacteria with NH4+ and graphene oxide
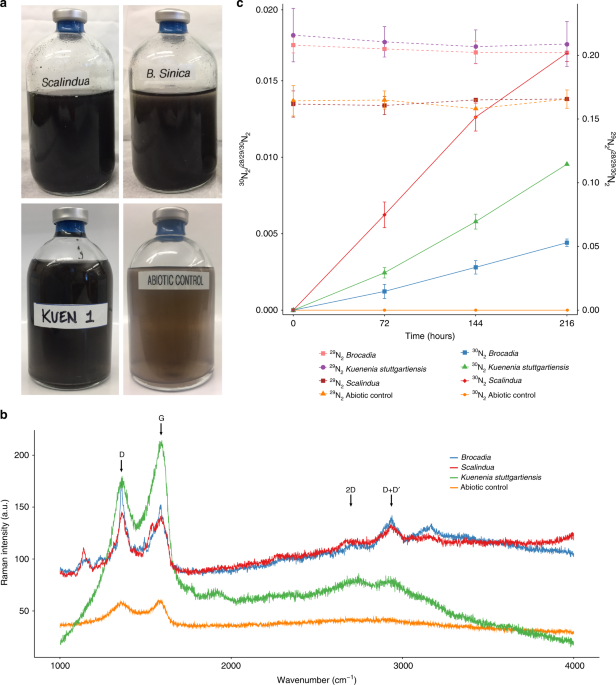
To test whether anammox bacteria have EET capability, the three enriched anammox cultures were incubated in serum vials for 216 h with 15NH4+ and graphene oxide (GO) as a proxy for insoluble extracellular electron acceptor. Standard anaerobic techniques were employed in the batch incubation experiments. All the procedures were performed in the anaerobic chamber (Coy Laboratory Products; Grass Lake Charter Township, MI, USA). Anoxic buffers and solutions were prepared by repeatedly vacuuming and purging helium gas (>99.99%) before experiments. Biomass from the MBRs was centrifuged, washed twice, and suspended in inorganic medium containing 2 mM 4-(2-hydroxyethyl)-1-piperazineethanesulfonic acid (HEPES, pH 7.8) prior to inoculation into the vials. The same composition of the inorganic medium used in the MBRs was supplied to the vials. The cell suspension was dispensed into 100 mL glass serum vials, which were sealed with butyl rubber stoppers and aluminum caps. Biomass concentration in the vials ranged from 0.1 to 0.9 mg–protein mL–1. The headspace of the serum vials was replaced by repeatedly vacuuming and purging with pure (>99.99%) helium gas. Positive pressure (50–75 kPa) was added to the headspace to prevent unintentional contamination with ambient air during the incubation and gas sampling. Prior the addition of 15NH4+, the vials were pre-incubated overnight at room temperature (~25 °C) to remove any trace amounts of substrates and oxygen. The activity test was initiated by adding 4 mM of 15NH4Cl (Cambridge Isotope Laboratories) and GO to a final concentration of 200 mg L–1 using a gas–tight syringe (VICI; Baton Rouge, LA, USA). No NO2− or NO3− was added to the incubations. The vials were incubated in triplicates at 30 °C for Ca. Brocadia and K. stuttgartiensis cultures and at room temperature (~25 °C) for vials with Ca. Scalindua. Vials without biomass were also prepared as abiotic controls. The concentrations of 28N2, 29N2, and 30N2 gas were determined by gas chromatography mass spectrometry (GC/MS) analysis37. Fifty microliters of headspace gas was collected using a gas-tight syringe (VICI; Baton Rouge, LA, USA) and immediately injected into a GC (Agilent 7890A system equipped with a CP-7348 PoraBond Q column) combined with 5975C quadrupole inert MS (Agilent Technologies; Santa Clara, CA, USA), and mass to charge (m/z) = 28, 29, and 30 was monitored. Standard calibration curve of N2 gas was prepared with 30N2 standard gas (>98% purity) (Cambridge Isotope Laboratories; Tewksbury, MA, USA). At the end of the batch incubations, DNA was extracted and sequenced for metagenomics analysis (see DNA extraction, metagenome library preparation, sequencing and sequence processing, and analysis section below). To confirm the reduction of the GO, the samples were centrifuged and subjected to dehydration process with absolute ethanol. Samples were maintained in a desiccator until Raman spectroscopy analysis. Raman spectroscopy (StellarNet Inc) was performed with the following settings: Laser 473 nm, acquisition time 20 s, accumulation 5 and objective 50×.
Bioelectrochemical analyses
To evaluate if anammox bacteria (Ca. Brocadia and Ca. Scalindua) are electrochemically active, single-chamber multiple working electrode glass reactors with 500 mL working volume were operated in microbial electrolysis cell (MEC) mode. The working electrodes (anodes) were graphite rods of 8 cm length (7.5 cm inside the reactor) and 0.5 cm in diameter. Platinum mesh was used as counter electrode (cathode) and Ag/AgCl as reference electrode (Bioanalytical Systems, Inc.). A schematic representation of the multiple working electrode MEC is presented in Supplementary Fig. 1h. The multiple working electrodes were operated at a set potential of –0.1, 0, 0.1, 0.2, 0.3, 0.4, 0.5, and 0.6 V vs. SHE. The amperometric current was monitored continuously using a VMP3 potentiostat (BioLogic Science Instruments, USA), with measurements every 60 s and analyzed using EC-lab V 10.02 software. To evaluate if K. stuttgartiensis is electrochemically active, experiments were conducted in single-chamber MECs (300 mL working volume) with carbon cloth working electrode (0.6 V vs. SHE). The reactors and working and counter electrodes were sterilized by autoclaving prior to the start of the experiments. The reference electrodes were sterilized by soaking in 3 M NaCl overnight and rinsing with sterile medium. After the reactors were assembled, epoxy glue was used to seal every opening in the reactor to avoid leakage. Gas bags (0.1L Cali -5 -Bond. Calibrate, Inc.) were connected to the MECs to collect any gas generated. The gas composition in the gas bags was analyzed using a gas chromatograph (SRI 8610C gas chromatograph, SRI Instruments).
The inorganic medium composition in the MECs was the same as the one supplied in the MBRs (see enrichment and cultivation of anammox bacteria section above), with variations in the NH4+ and/or NO2− concentration. After preparation, the inorganic medium was boiled, sparged with N2:CO2 (80:20) gas mix for 30 min to remove any dissolved oxygen and finally autoclaved. The autoclaved medium was cooled down to room temperature inside the anaerobic chamber (Coy Laboratory, USA). Prior to the experiments, KHCO3 was weighed in the anaerobic chamber and dissolved in the medium. The reactors were operated in fed-batch mode at 30 °C for Ca. Brocadia and K. stuttgartiensis cultures and at room temperature (~25 °C) for Ca. Scalindua. The medium in the MECs was gently mixed with a magnetic stirrer throughout the course of the experiments. The pH of the MECs was not controlled but was at all times between 7.0 and 7.5. To exclude the effect of abiotic (i.e., non-Faradaic) current, initial operation of the reactors was done without any biomass addition. After biomass inoculation, the MECs were operated with set potentials and optimal conditions for the anammox reaction (i.e., addition of NH4+ and NO2−). Afterward, NO2− was gradually decreased to 0 mM leaving the working electrodes as the sole electron acceptor. To confirm that the electrode-dependent anaerobic oxidation of NH4+ was catalyzed by anammox bacteria, additional control experiments were conducted in chronological order including addition of allylthiourea (ATU), operation in open circuit voltage mode (i.e., anodes were not connected to the potentiostat; electrode is not used as electron acceptor), addition of nitrite, operation without addition of NH4+ and then with addition of NH4+, and autoclaving. ATU was added to a final concentration of 100 μM to evaluate the contribution of nitrifiers to the process19. Biomass from a nitrifying reactor was incubated in triplicate vials with 100 μM of ATU and was used as a positive control for the inhibitory effect of ATU. Throughout the reactor operation, the concentrations of NH4+, NO2−, and NO3− were determined as described below (see “Analytical methods” section). All experiments were done in triplicate MECs, unless mentioned otherwise.
CV at a scan rate of 1 mV s–1 was performed for the anodic biofilms at different time intervals following initial inoculation to determine their redox behavior. Scans ranged from −0.6 to 0.6 V vs. SHE at pH 7.0 and 25 °C. Current was normalized to the geometric anode surface area. To determine the presence of extracellular secreted redox mediators by anodic communities, CVs were performed with cell-free filtrates (filtered using a 0.2 μm pore diameter filter) collected from the reactors and placed in separate sterile electrochemical cells. Also, experiments were conducted to evaluate the effect of adding riboflavin, which is a common soluble mediator involved in EET in gram-positive and gram-negative bacteria13,22. Riboflavin was added to the mature anammox biofilm to a final concentration of 250 nM22.
To test if cathodic reaction (i.e., hydrogen evolution reaction) has an effect on electrode-dependent anaerobic ammonium oxidation, experiments were also conducted in double-chamber MECs (Supplementary Fig. 1k) with a single carbon cloth working electrode (0.6 V vs. SHE). The anode and cathode chambers in double-chamber MECs were separated by a proton-exchange Nafion membrane. Also, to exclude the effect of heterotrophic activity on the current generation, 500 mg L−1 of penicillin G (Sigma-Aldrich, St. Louis, MO)8 was added in the last batch cycle to inhibit heterotrophs.
To determine the role of NO in the electrode-dependent anammox metabolism, single-chamber MECs were incubated with 4 mM NH4+ and 100 μM of 2-phenyl-4,4,5,5,-tetramethylimidazoline-1-oxyl-3-oxide (PTIO), a NO scavenger. MECs with 4 mM NH4+ and without PTIO addition were run in parallel as the negative control. PTIO inhibits K. stuttgartiensis activity when NO is an intermediate of the anammox reaction4, therefore vials with K. stuttgartiensis were used as positive control of the effect of PTIO. Liquid samples were taken every day and filtered using a 0.2 μm filter and subjected to determination of NH4+ concentration as described below (see “Analytical methods” section).
For isotopic and comparative transcriptomics analysis experiments, single-chamber MECs (Adams & Chittenden Scientific Glass, USA) with a single carbon cloth working electrode (0.6 V vs. SHE) and 300 mL working volume were used (Supplementary Fig. 1k).
15N tracer batch experiments in MECs
To elucidate the molecular mechanism of electrode-dependent anaerobic ammonium oxidation by different anammox bacteria, isotopic labeling experiments were conducted in single-chamber MECs operated at set potential of 0.6 V vs. SHE. All batch incubation experiments were performed in triplicate MECs. MEC incubations without biomass for the 15N tracer batch experiments were also prepared to exclude any possibility of an abiotic reaction. Standard anaerobic techniques were employed in the batch incubation experiments. All the procedures were performed in the anaerobic chamber (Coy Laboratory Products; Grass Lake Charter Township, MI, USA). Anoxic buffers and solutions were prepared by repeatedly vacuuming and purging helium gas (>99.99%) before the experiments. The purity of 15N-labeled compounds was greater than 99%. The headspace of the MECs was replaced by repeatedly vacuuming and purging with pure (>99.99%) helium gas. Positive pressure (50–75 kPa) was added to the headspace to prevent unintentional contamination with ambient air during the incubation and gas sampling. Oxidation of NH4+ to N2 was demonstrated by incubating the MECs with 15NH4Cl (Cambridge Isotope Laboratories, 4 mM) and 14NO2− (1 mM). The MECs were incubated for 144 h at 30 °C for Ca. Brocadia and K. stuttgartiensis cultures, and at room temperature (~25 °C) for Ca. Scalindua. The concentrations of 28N2, 29N2, 30N2, 14NO, 15NO, 28N2O, 29N2O, and 30N2O gas were determined by GC/MS37. Fifty microliters of headspace gas was collected using a gas-tight syringe (VICI; Baton Rouge, LA, USA) and immediately injected into a GC (Agilent 7890A system equipped with a CP-7348 PoraBond Q column) combined with 5975C quadrupole inert MS (Agilent Technologies; Santa Clara, CA, USA). Standard calibration curve of N2 gas was prepared with 30N2 standard gas (>98% purity) (Cambridge Isotope Laboratories; Tewksbury, MA, USA).
To investigate whether hydroxylamine (NH2OH) could be produced directly from NH4+ in electrode-dependent anaerobic ammonium oxidation by anammox bacteria, single-chamber MECs were incubated with 15NH4Cl (4 mM, Cambridge Isotope Laboratories) and an unlabeled pool of 14NH2OH (2 mM) for 144 h. Liquid samples were taken every day and filtered using a 0.2 μm filter and subjected to determination of 15NH2OH and 14NH2OH. NH2OH was determined by GC/MS analysis after derivatization using acetone38. Briefly, 100 µl of liquid sample was mixed with 4 µl of acetone, and 2 µl of the derivatized sample was injected to a GC (Agilent 7890 A system equipped with a CP-7348 PoraBond Q column) combined with 5975 C quadrupole inert MS (Agilent Technologies; Santa Clara, CA, USA) in splitless mode. NH2OH was derivatized to acetoxime (C3H7NO), and the molecular ion peaks were detected at mass to charge (m/z) = 73 and 74 for 14NH2OH and 15NH2OH, respectively. Twenty-five micrometers of 14NH2OH and 15NH2OH were used as standards. To determine the source of the oxygen used in the electrode-dependent NH4+ oxidation to NH2OH, MECs were incubated with 15NH4Cl (4 mM, Cambridge Isotope Laboratories) in the presence of 10% D2O for 144 h. Stable isotopes of NH2OH were determined by GC/MS analysis after derivatization using acetone as described above.
Activity and electron balance calculations
Activities of specific anammox (29N2) with nitrite as the preferred electron acceptor and electrode-dependent anammox (30N2) with working electrode (0.6 V vs. SHE) as sole electron acceptor were calculated based on the changes in gas concentrations in single-chamber MEC batch incubations. The activity was normalized against the protein content of the biofilm on the electrodes. Protein content was measured as described below (see “Analytical methods” section).
The moles of electrons recovered as current per mole of NH4+ oxidized were calculated using
$${n}_{CE}left( {mathrm{NH}}_{4}^{+} right) = frac{{mathop {smallint }nolimits_{t = 0}^{t} I,dt}}{{{mathrm{NH}}_{4}^{+} cdot F}}$$
where I is the current (A) obtained from the chronoamperometry, dt (s) is the time interval over which data were collected, NH4+ is the moles of NH4+ consumed during the experiment, and F = 96,485 C mol–1 is Faraday’s constant. CE was calculated using
$${mathrm{CE}}({%}) ={frac{n_{{CE}}({mathrm{NH}}_{4}^{+})}{n_{CE {mathrm{Theo}}}({mathrm{NH}}_{4}^{+})}} {times} 100$$
where nCE Theo(NH4+) is the theoretical number of moles of electrons (in our case it is three moles of electrons) recovered as current per mole of NH4+ oxidized.
Analytical methods
All samples were filtered through a 0.2 µm pore-size syringe filters (Pall corporation) prior to chemical analysis. NH4+ concentration was determined photometrically using the indophenol method39 (lower detection limit = 5 μM). Absorbance at a wavelength of 600 nm was determined using multi-label plate readers (SpectraMax Plus 384; Molecular Devices, CA, USA). NO2− concentration was determined by the naphthylethylenediamine method39 (lower detection limit = 5 μM). Samples were mixed with 4.9 mM naphthylethylenediamine solution, and the absorbance was measured at a wavelength of 540 nm. NO3− concentration was measured by HACH kits (HACH, CO, USA; lower detection limit = 0.01 mg l−1 NO3−-N). User’s guide was followed for these kits and concentrations were measured by spectrophotometer (D5000, HACH, CO, USA). Concentrations of NH2OH and hydrazine (N2H4) were determined colorimetrically as previously described40. For NH2OH, liquid samples were mixed with 8-quinolinol solution (0.48% (w/v) trichloroacetic acid, 0.2% (w/v) 8-hydroxyquinoline and 0.2 M Na2CO3), and heated at 100 °C for 1 min. After cooling down for 15 min, absorbance was measured at 705 nm41. N2H4 was derivatized with 2% (w/v) p-dimethylaminobenzaldehyde and absorbance at 460 nm was measured42. The concentration of biomass on the working electrodes was determined as protein concentration using the DC Protein Assay Kit (Bio-Rad, Tokyo, Japan) according to manufacturer’s instructions. Bovine serum albumin was used as the protein standard.
Fluorescence in situ hybridization (FISH)
The microbial community in the MBRs and the spatial distribution of anammox cells on the surface of the graphite rod electrodes was examined by FISH after 30 days of reactor operation. The graphite rod electrodes were cut in the anaerobic chamber with a sterilized tube cutter (Chemglass Life Sciences, US). The electrode samples were fixed with 4% (v/v) paraformaldehyde (PFA), followed by 10 nm cryosectioning at −30 °C (Leica CM3050 S Cryostat). FISH with rRNA-targeted oligonucleotide probes was performed as described elsewhere43 using the EUB338 probe mix composed of equimolar EUB338 I, EUB338 II, and EUB 338 III44,45 for the detection of bacteria and probes AMX820 or SCA1309 for anammox46,47. Cells were counterstained with 1 μg ml−1 DAPI (4′,6-diamidino-2-phenylindole) solution. Fluorescence micrographs were recorded by using a Leica SP7 confocal laser scanning microscope. To determine the relative abundance of anammox bacteria by quantitative FISH, 20 confocal images of FISH probe signals were taken at random locations in each well and analyzed by using the digital image analysis DAIME software as described elsewhere48.
Scanning electron microscopy
The graphite rod electrodes were cut in the anaerobic chamber with sterilized tube cutter (Chemglass Life Sciences, US). The electrode samples were soaked in 2% glutaraldehyde solution containing phosphate buffer (50 mM, pH 7.0) and stored at 4 °C. Sample processing and scanning electron microscopy (SEM) was performed as described elsewhere49. Samples from the carbon-cloth electrodes were punched out using a 4.8 mm Ø biopsy punch and placed into a 200 μm cavity of a type A platelet (6 mm diameter; 0.1–0.2 mm depth, Leica Microsystems) and closed with the flat side of a type B platelet (6 mm diameter, 300 μm depth). Platelet sandwiches were cryo-fixed by high-pressure freezing (Leica HPM 100; Leica Microsystems, Vienna, Austria) and stored in liquid nitrogen until use. For Hexamethyldisalizane (HMDS) embedding, frozen samples were freeze-substituted in anhydrous methanol containing 2% osmium tetroxide, 0.2% uranyl acetate, and 1% H2O50. The substitution followed several intervals: cells were kept at −90 °C for 47 h; brought to −60 °C at 2 °C per hour and kept at −60 °C for 8 h; brought to −30 °C at 2 °C per hour and kept at −30 °C for 8 h in a freeze-substitution unit (AFS; Leica Microsystems, Vienna, Austria). To remove fixatives the samples were washed four times for 30 min in the AFS device at −30 °C with anhydrous methanol and subsequently infiltrated with HMDS by incubating two times for 15 min with 50% HMDS in anhydrous methanol followed by two times 15 min 100% HMDS. After blotting and air-drying the electrode samples were mounted on specimen stubs using conductive carbon tape and sputter-coated with gold-palladium before imaging in a JEOL JSM-6335F SEM, operating at 3 kV.
Metagenomics sequencing and analysis
Biomass from the vials of the GO experiment was harvested by centrifugation (4000 × g, 42 °C) at the end of the batch incubations. Biofilm samples from the electrodes were collected after 30 days of reactor operation with the working electrode as the sole electron acceptor. The biomass pellet and the electrode samples were suspended in Sodium Phosphate Buffer in the Lysing Matrix E 2 mL tubes (MP Biomedicals, Tokyo, Japan). After 2 min of physical disruption by bead beating (Mini-beadbeaterTM, Biospec products), the DNA was extracted using the Fast DNA spin kit for soil (MP Biomedicals, Tokyo, Japan) according to the manufacturer’s instructions. The DNA was quantified using Qubit (Thermo Fisher Scientific, USA) and fragmented to ~550 bp using a Covaris M220 with microTUBE AFA Fiber screw tubes and the settings: duty factor 20%, peak/displayed power 50 W, cycles/burst 200, duration 45 s, and temperature 20 °C. The fragmented DNA was used for metagenome preparation using the NEB Next Ultra II DNA library preparation kit. The DNA library was paired-end sequenced (2 × 301 bp) on a Hiseq 2500 system (Illumina, USA).
Raw reads obtained in the FASTQ format were processed for quality filtering using Cutadapt package v. 1.1051 with a minimum phred score of 20 and a minimum length of 150 bp. The trimmed reads were assembled using SPAdes v. 3.7.152. The reads were mapped back to the assembly using minimap253 (v. 2.5) to generate coverage files for metagenomic binning. These files were converted to the sequence alignment/map (SAM) format using samtools54. Open reading frames (ORFs) were predicted in the assembled scaffolds using Prodigal55. A set of 117 hidden Markov models (HMMs) of essential single-copy genes were searched against the ORFs using HMMER3 (http://hmmer.janelia.org/) with default settings, with the exception that option (-cut_tc) was used56. Identified proteins were taxonomically classified using BLASTP against the RefSeq protein database with a maximum e-value cut-off of 10−5. MEGAN was used to extract class-level taxonomic assignments from the BLAST output57. The script network.pl (http://madsalbertsen.github.io/mmgenome/) was used to obtain paired-end read connections between scaffolds. 16S rRNA genes were identified using BLAST58 (v. 2.2.28+, and the 16S rRNA fragments were classified using SINA59 (v. 1.2.11) with default settings except min identity adjusted to 0.80. Additional supporting data for binning was generated according to the description in the mmgenome package60 (v. 0.7.1.). Genome binning was carried out in R61 (v. 3.3.4) using the R-studio environment. Individual genome bins were extracted using the multimetagenome principles25 implemented in the mmgenome R package61 (v. 0.7.1). Completeness and contamination of bins were assessed using coverage plots through the mmgenome R package and by the use of CheckM62 based on the occurrence of a set of single-copy marker genes63. Genome bins were refined manually as described in the mmgenome package and the final bins were annotated using PROKKA64 (v. 1.12-beta).
Phylogenomics analysis
Extracted bins and reported anammox genomes were used for phylogenetic analysis. Reported anammox genomes were downloaded from the NCBI GenBank. HMM profiles for 139 single-copy core genes63 were concatenated using anvi’o platform65. Phylogenetic trees with estimated branch support values were constructed from these concatenated alignments using MEGA766 with Neighbor Joining, Maximum-likelihood and UPGMA methods.
Comparative transcriptomics analysis
Comparative transcriptomic analysis was conducted to compare the metabolic pathway of NH4+ oxidation and electron flow when working electrode is used as the electron acceptor vs. NO2− as the electron acceptor. Samples for comparative transcriptomic analysis were taken from mature electrode’s biofilm of duplicate single-chamber MECs with NO2− as the sole electron acceptor and after switching to set potential growth (0.6 V vs. SHE, electrode as the electron acceptor). Biofilm samples were collected from carbon cloth electrodes with sterilized scissors in the anaerobic chamber. Samples were stored in RNAlater™ Stabilization Solution (Invitrogen™) until further processing. Total RNA was extracted from the samples using PowerBiofilm RNA Isolation kit (QiAGEN) according to the manufacturer’s instructions. The RNA concentration of all samples was measured in duplicate using the Qubit BR RNA assay. The RNA quality and integrity were confirmed for selected samples using TapeStation with RNA ScreenTape (Agilent Technologies). The samples were depleted of rRNA using the Ribo-zero Magnetic kit (Illumina Inc.) according to manufacturer’s instructions. Any potential residual DNA was removed using the DNase MAX kit (MoBio Laboratories Inc.) according to the manufacturer’s instructions. After rRNA depletion and DNase treatment the samples were cleaned and concentrated using the RNeasy MinElute Cleanup kit (QIAGEN) and successful rRNA removal was confirmed using TapeStation HS RNA Screentapes (Agilent Technologies). The samples were prepared for sequencing using the TruSeq Stranded Total RNA kit (Illimina Inc.) according to the manufacturer’s instructions. Library concentrations were measured using Qubit HS DNA assay and library size was estimated using TapeStation D1000 ScreenTapes (Agilent Technologies). The samples were pooled in equimolar concentrations and sequenced on an Illumina HiSeq2500 using a 1 × 50 bp Rapid Run (Illumina Inc).
Raw sequence reads in fastq format were trimmed using USEARCH67 v10.0.2132, -fastq_filter with the settings -fastq_minlen 45 -fastq_truncqual 20. The trimmed transcriptome reads were also depleted of rRNA using BBDuk68 with the SILVA database as reference database69. The reads were mapped to the predicted protein coding genes generated from Prokka64 v1.12 using minimap253 v2.8-r672, both for the total metagenome and each extracted genome bin. Reads with a sequence identity below 0.98 were discarded from the analysis. The count table was imported to R61, processed and normalized using the DESeq2 workflow70 and then visualized using ggplot2. Analyses of overall sample similarity were done using normalized counts (log transformed), through vegan71 and DESeq270 packages (Supplementary Fig. 9). Differentially expressed genes were evaluated for the presence of N-terminal signal sequences, transmembrane spanning helices (TMH) and subcellular localization using SignalP 5.072, TMHMM 2.0 software and PSORTb 3.0.273 respectively. Differentially expressed genes that appeared annotated as ‘hypothetical’ were reconsidered for a putative function employing BLAST searches (i.e., BLASTP, CD-search, SmartBLAST), MOTIF search, COG, and PFAM databases, as well as by applying the HHpred homology detection and structure prediction program (MPI Bioinformatics Toolkit).
Statistics and reproducibility
The number of replicates is detailed in the subsections for each specific experiment and was mostly determined by the amount of biomass available for the different cultures. In all experiments, three biological replicates were used, unless mentioned otherwise. No statistical methods were used to predetermine the sample size. The experiments were not randomized, and the investigators were not blinded to allocation during experiments and outcome assessment. Statistical analyses were carried out in R61 v. 3.3.4 using the R-studio environment.
Reporting summary
Further information on research design is available in the Nature Research Reporting Summary linked to this article.
Source: Ecology - nature.com

