Type 1 and Type 2 call emissions by Pipistrellus pipistrellus
We reconstructed flight paths of 12 audio recordings of foraging residents and intruders of P. pipistrellus containing 60 Type 1 calls and 74 Type 2 calls. In 11 of 12 recordings with Type 2 calls, both call types were present, whereas in one recording Type 1 did not accompany a Type 2 call. In 8 of 12 recordings, Type 1 calls were emitted shortly before Type 2 calls, with a median interval from beginning of Type 1 call to beginning of Type 2 call of 510 ms (Q1: 310 ms, Q3: 930 ms, n = 20, Fig. 2). Across all recordings, Type 1 and 2 were emitted exclusively by the resident with the exception of one case, where an intruder also emitted a Type 1 call.

Type 1 and Type 2 call between echolocation signals. Type 1 call and Type 2 call emitted by a resident in mutual flight with an intruder. Calls of the resident are marked by white symbols, with Type 1 and 2 calls (circles) interspersed between search calls (triangles).
Type 1 calls
Type 1 calls of P. pipistrellus consisted of 3–5 multiharmonic and frequency-modulated syllables with terminal frequencies of 16.0 ± 0.8 kHz (mean ± SD, n = 50). These complex calls lasted on average 25 ms (25.0 ± 3.9 ms, mean ± SD, n = 50) and were interspersed between echolocation signals. The number of echolocation calls between Type 1 calls varied from 2 to 83 signals within discrete recording sequences of 20-second duration. The social calls were emitted during foraging flight, indicated by feeding buzzes and typical pursuit behavior.
Type 2 calls
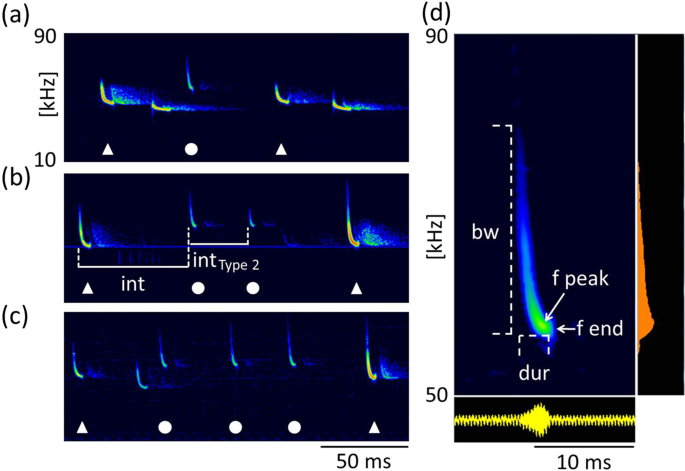
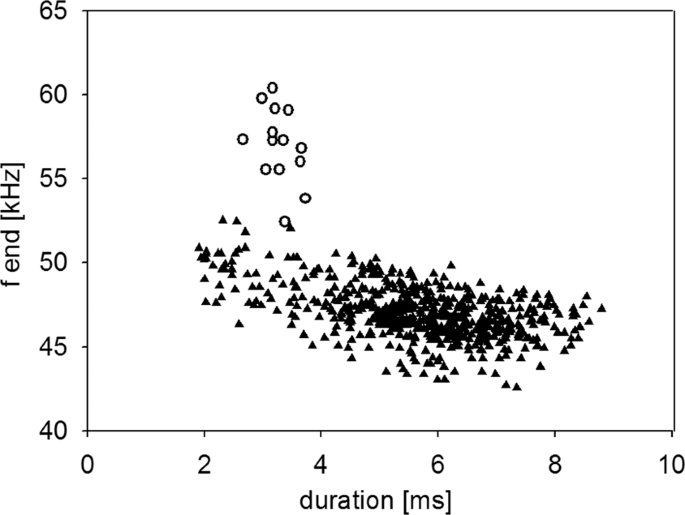
Type 2 calls were short, frequency-modulated calls with terminal frequencies above the terminal frequencies of echolocation signals of the emitter. They were interspersed between echolocation signals and delivered as either single calls, or groups of two or three consecutive calls (Fig. 3a–c). These calls were emitted by the resident and were recorded exclusively in presence of an intruder. A single recording revealed an emission in presence of an interspecific intruder (sp. Pipistrellus nathusii). The terminal frequency of Type 2 calls ranged from 51.3 to 60.4 kHz (56.7 ± 2.1 kHz, mean ± SD, n = 27) and was 4.5 to 13.9 kHz (8.8 ± 2.2 kHz mean ± SD, n = 27) higher than the terminal frequency of the preceding echolocation call by the same individual. Analysis of terminal frequency and duration for all Type 2 calls and search calls that fulfill the criterion of sufficient amplitude revealed significantly higher terminal frequencies (57.0 ± 2.2 kHz, Mean ± SD, n = 14) for Type 2 calls than search calls (48.7 ± 1.5 kHz, Mean ± SD, n = 35, Anova, F(1,47)=232.13, p < 0.0001) of comparable duration (2.7–3.7 ms, Fig. 4). Type 2 calls had peak frequencies of 58 ± 2.4 kHz (mean ± SD, n = 73), bandwidths of 6.4 ± 1.7 kHz (mean ± SD, n = 14) and durations of 3.3 ± 0.3 ms (mean ± SD, n = 14, Table 1).

Type 2 calls. Type 2 calls were emitted by the resident in presence of an intruder as single calls (a) or in groups of two (b) or three (c) consecutive calls. Calls of the resident are marked by white symbols, with Type 2 calls (circles) interspersed between search calls (triangles). Call parameters for characterization of Type 2 calls are bandwidth (bw), duration (dur), peak frequency (f peak) and terminal frequency (f end), (d). Pulse intervals of Type 2 calls were measured to the preceding search call (int, b) and within grouped Type 2 calls (int Type 2, b).

Correlation of terminal frequency (f end) of Type 2 calls and search calls with call duration. Type 2 calls (white circles) have higher terminal frequencies than search calls (black triangles).
Pulse intervals
In search flight, P. pipistrellus emitted echolocation signals with durations of up to 10 ms and pulse intervals around 95 ms (Median 95.4 ms, Q1: 80.8 ms, Q3: 107.6 ms, n = 2355). Pulse intervals of ~90 ms indicate sound emissions most likely in rhythm with wing beat, whereas a pulse interval of ~180 ms indicates a wing beat without sound emission.
Type 1 and Type 2 calls were interspersed between echolocation signals and their emission affected the pulse intervals of echolocation calls in the following way:
The median pulse interval from the beginning of Type 1 calls to the beginning of the preceding echolocation call was 46.8 ms (Q1: 44.2 ms, Q3: 51.4 ms, n = 60) and from the beginning of Type 1 calls to the beginning of the following echolocation call was 85.2 ms (median, Q1: 76.8 ms, Q3: 102.8 ms, n = 58). Resulting from the insertion of a Type 1 call, the pulse intervals between echolocation signals increased to median values of 133.6 ms (Q1: 124.2 ms, Q3: 154.2 ms; n = 59, Wilcoxon, p < 0.0001).
Type 2 calls were interspersed with median intervals of 53.5 ms (Q1: 45.8 ms, Q3: 60.1 ms, n = 58) to the preceding echolocation call. However, in contrast to Type 1, the interspersion of Type 2 calls did not always affect the pulse intervals of echolocation signals. Single interspersed Type 2 calls induced no extension of pulse intervals between echolocation signals (median 96.9 ms, Q1: 89.4 ms, Q3: 121.5 ms, n = 43, Wilcoxon, p = 0.0572), groups of two Type 2 calls induced extended pulse intervals between echolocation calls of 152.1 ms (median, Q1: 144.9 ms, Q3: 162.5 ms, n = 12, Wilcoxon, p < 0.0001) and a group of three consecutive Type 2 calls induced a median pulse interval of 169.4 ms between the preceding and following echolocation call of the emitter.
Pulse intervals of grouped Type 2 calls lasted 34.2 ms (median, Q1: 29.2 ms, Q3: 39.3 ms, n = 14).
Flight behavior
Type 1 calls
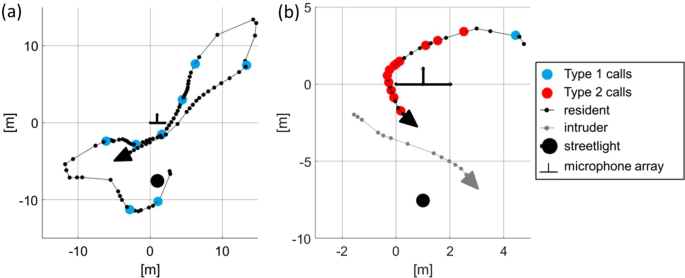
Type 1 calls were emitted by the resident in single flight and in flights with an intruder (Fig. 5a,b). Flight path reconstructions revealed flights along constant routes, interrupted by turning patterns with feeding buzzes, as usually observed in foraging bats. No false landings or gliding elements such as those reported from songflights were observed. The resident often emitted Type 1 calls shortly before a conspecific (or occasionally an individual of a different species) intruder emerged.

Top view of the flight paths of a foraging resident in single flight (a) and in flight with an intruder (b). Small dots indicate positions where echolocation signals were emitted by the resident (black) or by the intruder (grey). Large dots indicate Type 1 and Type 2 signals. Type 2 calls (red dots) were emitted exclusively by the resident in presence of an intruder, often during chase flights.
Type 2 calls
Type 2 calls were emitted only by the resident and exclusively in the presence of an intruder (Fig. 5b). Flight paths of residents and intruders revealed that Type 2 call emission mostly took place either during chases of the intruder by the resident (60%) or in frontal encounters of both bats (25%). In both flight situations the resident flew directly towards the intruder. Few Type 2 calls were emitted when flight paths already crossed (15%) and were still in close proximity. Analysis of consecutively-taken audio recordings revealed that intruders left the recording area after receiving Type 2 calls from the resident (Fig. 6).

Emission pattern and effect of Type 2 calls. Example of vocal behavior of a resident individual foraging alone or in the presence of intruders documented by 50 consecutive recordings each with a duration of 20 seconds. Recordings are interrupted by approx. 0.9 seconds for data saving by the recording device (total evaluation time 18 minutes). Black dots indicate that the resident only or both resident and intruder were present as evidenced by their echolocation signals. Recordings where the resident emitted one or more Type 1 calls are marked by blue triangles, recordings with Type 2 calls are indicated by red circles. The resident emitted Type 2 calls exclusively in presence of intruders. After the emission of Type 2 calls intruders left the foraging site and were not traceable during the subsequent audio recording.
Bearing angle and inter-individual distance between resident and intruder at Type 1 and Type 2 call emission
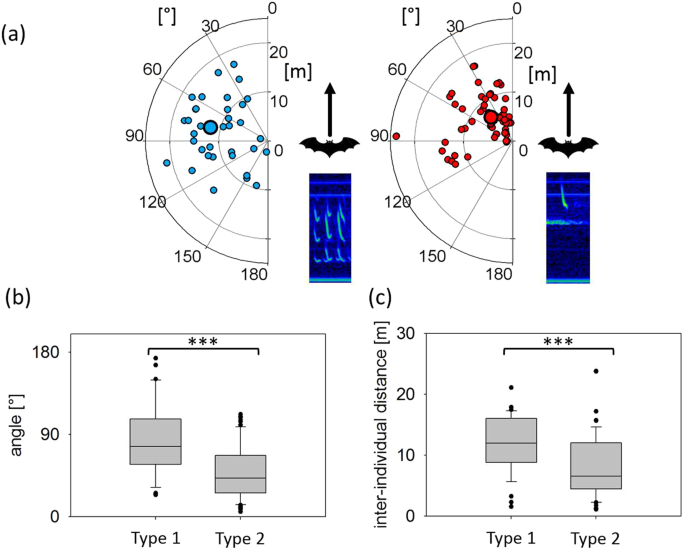
During Type 1 call emission, the bearing angles to the intruder varied widely, with a range from 23.9 to 173.5°. The values for the same measurement at Type 2 call emission were less variable and ranged from 5.3 to 112.2°. Bearing angles to the intruder were significantly smaller during Type 2 call emissions (42.1 ± 3.6°, median ± SEM, n = 68) than during Type 1 call emissions (76.8 ± 6.5°, median ± SEM, n = 36; Anova, F(1,102) = 26.82, p < 0.0001, Fig. 7a,b). Inter-individual distances between resident and intruder were also significantly smaller during Type 2 call emissions (6.5 ± 0.6 m, median ± SEM, 1.1–23.8 m, min-max, n = 68) than during Type 1 call emissions (12.0 ± 0.8 m, median ± SEM, 1.5–21.1 m, min-max, n = 36; Anova, F(1,102)=11.74, p = 0.0009, Fig. 7a,c).

Spatial positions of intruders in relation to the position and flight direction of the resident at the emission of Type 1 and Type 2 calls. Spatial positions of intruders (small circles) at Type 1 call (left) and Type 2 call emission (right) by the resident with median position (large circles) indicated by distance and angle relative to the resident’s position and flight direction (0°) (a). Comparison of relative angles (b) and distances (c) at the emission of Type 1 (n = 36) and Type 2 calls (n = 68) revealed significant differences. Bearing angles and inter-individual distances were smaller at Type 2 call emissions than for Type 1 call emissions.
Annual distribution of social calls
Type 1 and Type 2 calls were recorded throughout the entire activity season from May to October (Table 2). As shown by the annual distribution, Type 1 call emission was evenly distributed over 82% of all recording nights, whereas Type 2 was emitted in 45% of nightly samples and occurred only in detached nights in July, August and September. The highest rates of Type 1 and Type 2 calls were recorded in October.
Source: Ecology - nature.com


