Bottom-up effects of precipitation manipulation on Brandt’s voles
To confirm the bottom-up effects of precipitation on small mammal, we monitored the vole population and plant community in a rainfall simulation experiment. We first assessed whether the plant community differed between rainfall treatment and control. In enclosures, the plant community structure mainly comprised of species such as C. squarrosa, LC, SK, Saussurea runcinata, Medicago sativa, Phlomis dentosa, and Carex enervis (Fig. 1a). Moderate precipitation (MP) supplementation dramatically facilitated the overall recovery of LC (F2, 9 = 4.7, P = 0.04; Fig. 1a). Precipitation manipulation groups exhibited a 5.5-fold increase in the proportion of LC biomass compared with the control group (t = 2.8, P = 0.02). There was also a trend for the biomass of LC to increase in the LP supplementation group compared with the control group, although the effect was marginally non-significant (Fig. 1a). There were no significant differences in the biomass of other plant species across the precipitation treatment groups (P > 0.05).
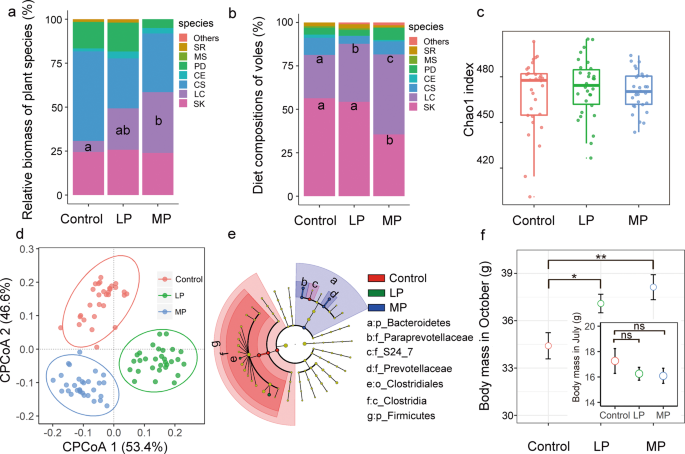
The roles of precipitation manipulation in forage availability and diet composition of voles (a, b). LP light precipitation supplementation group; MP medium precipitation supplementation group; SR S. runcinata; MS M. sativa; PD P. dentosa; CE C. enervis; CS C. squarrosa; LC L. chinensis; SK S. krylovii. Different letters indicate significant differences between the treatments (P < 0.05). c The roles of precipitation manipulation in L. brandtii gut microbiota community structure (Chao1 index). d Constrained PCoA plot of OTU-level Bray-Curtis distances between samples from control, LP, and MP. e Responses of L. brandtii gut microbiota to precipitation manipulation. Cladogram representing the bacterial biomarkers found to be significantly associated with precipitation manipulation by LEfSe (LDA > 2; P < 0.05). f Differences in L. brandtii body growth across different precipitation manipulation treatments from July to October (ns non-significance; *P < 0.05; **P < 0.01).
We then assessed whether the vole’s diet differed between rainfall treatment and control. LC and SK were the dominant grass species in vole’s diet, accounting for more than 80% of the total food (Fig. 1b). Precipitation manipulation alters the diet composition of voles (Fig. 1b). Specifically, the proportion of LC in L. brandtii diets was higher in LP and MP enclosures (LP: t = 2.1, P = 0.03; MP: t = 5.4, P < 0.001; Fig. 1b), whereas the proportion of SK was lower in MP enclosures (MP, t = −2.3, P = 0.04). We found no significant differences in the abundance of other plant species in vole diets among precipitation groups (P > 0.05).
We further revealed extensive variation in gut microbiota of Brandt’s vole in different precipitation treatment groups by processing raw data from amplicon sequencing datasets. We obtained a total of 7875868 microbial 16S rRNA raw sequence reads (87,509 ± 13,529 reads per individual) for 90 samples from the enclosures. The sequences were then quality-filtered and clustered with 97% similarity. Consequently, we identified a total of 530 OTUs (451 ± 20 OTUs per individual) across the samples. Within these OTUs, we identified 8 phyla, 13 classes, 13 orders, 21 families, and 25 genera. The dominant phyla present were Firmicutes (87.9 ± 5 %) and Bacteroidetes (8.8 ± 2%). MP reduced the ratio of Firmicutes/Bacteroidetes from 9.7 to 6.8 compared with control group (P < 0.05). We found no significant effect of precipitation manipulation on OTUs-level alpha diversity metrics (observed OTU richness and Chao1; P > 0.05, Figs. 1c and S2). However, principal coordinates analysis (PCoA) revealed a marked distinction between samples from the control, LP, and MP groups in ordination space (PERMANOVA; F = 3.6, P = 0.0001; Fig. 1d). LEfSe analysis showed that, from phyla to genera, precipitation manipulation groups influenced L. brandtii gut microbiota. The taxa from the phyla Firmicutes, class Clostridia, order Clostridiales, and family S24_7 were more frequently observed in L. brandtii gut microbiota in the control group, whereas genus Ruminococcus and Marvinbryantia were more prevalent in the L. brandtii gut microbiota of the LP group (Fig. 1e). The phyla Bacteroidetes, family Prevotellaceae, family Paraprevotellaceae, genus Prevotella, and genus YRC22 were more abundant in the MP group (Fig. 1e).
To further characterize cascading effect of precipitation on vole population, here we mainly focused on the body growth of vole. In early July, the average body weight of young voles was not significantly different among the three precipitation manipulation groups (Fig. 1f). After three months of growth, body weight increased to 30–44.6 g (mean, 36.7 g). Notably, the average changes in body weight of voles in the LP and MP treatments was 7.8% and 10.8%, respectively, higher than in the control group (Fig. 1f).
Identification of key nutrients in vole’s diet
Each plant species has its own unique nutritional composition (Fig. 2a and Table S1). PCoA analysis of seven common plant species in the vole’s diets, clearly distinguish species in ordination space based on their food quality indexes (including fructose, FOS, crude fiber, silicon, crude protein, glucose, resistant starch, fat, and tannin) included in the vole diet (F = 176.7, P < 1e−6). Samples of LC, SK, and C. squarrosa (belonging to family Poaceae) were overlapped with the samples of C. enervis (belonging to family Cyperaceae) in the ordination space (Fig. 2a). However, samples of the species belonging to family Poaceae and Cyperaceae were well separated from the samples of S. runcinata (family Asteraceae), M. sativa (family Fabaceae), and P. dentosa (family Lamiaceae). In addition, the ranking of mean decrease in Gini index for the nine nutritional indexes in the random forests model (Fig. 2c) indicated that fructose and FOS were the best variables that brought the apparent discrimination of nutrition among the seven plant species. LC and SK also had a substantial difference in the content of fructose and fructo-oliose, with fourfold higher fructose and fructo-oliose in LC compared with SK (Fig. 2b, d).
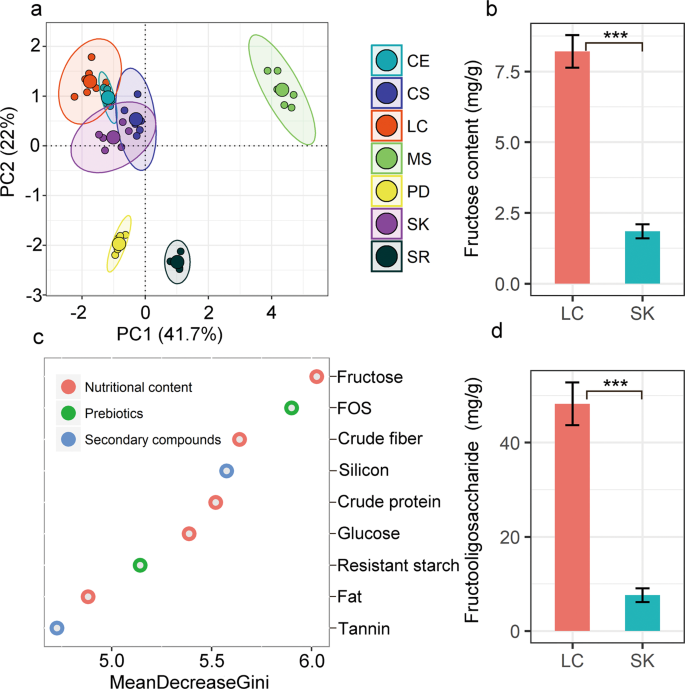
a Principal component analysis of plant nutrition distribution in seven plant species. CE: Carex enervis; CS Cleistogenes squarrosa; LC Leymus chinensis; MS Medicago sativa; PD Phlomis dentosa; SK Stipa krylovii; SR: Saussurea runcinata. c The ranking of mean decrease Gini index for the nine variables in random forests model. A higher mean decrease in Gini indicates higher variable importance. (b, d) Differences in fructose and FOS content between L. chinensis and S. krylovii.
Effect of varied plant-based diets on Brandt’s vole
To validate the relationship between the diet change, microbiota responses and body growth, we measured the body weight and fecal amino acid concentrations and also characterized the gut microbiome using shotgun metagenomics sequencing in a diet manipulation experiment. The bacterial community of voles fed with LP diet in the lab (LPL treatment) and voles fed with MP diet in the lab (MPL treatment) was marginally different from that of voles fed with the control diet (adonis analysis: LPL, P = 0.1; MPL, P = 0.06; Fig. S3). To further quantify the number of microbial species affected by different plant diets, the distribution patterns of the dominant enriched species (at a relative abundance of >5‱) were illustrated by ternary plots among the control, LPL, and MPL groups (Fig. 3a). Of all 380 bacterial species, the number of enriched species for control, LPL, and MPL were 14, 19, and 7, respectively (Table S2), with the remaining 340 species being shared among the three diet treatments. The HUMAnN2 results suggested that the most abundant functions of gut microbiota of voles were related to adenosine ribonucleotides de novo biosynthesis, L-isoleucine and L-valine biosynthesis, and pyruvate fermentation to isobutanol (Table S2). Of all 303 microbial function pathways, we identified 26 metabolic pathways (11 pathways were enriched in control; 9 pathways were enriched in LPL; and 6 pathways were enriched in MPL; Table S3) that are differentially abundant across the control, LPL, and MPL groups (Fig. 3b). Differentially abundant metabolic functions across the three treatment diets are listed in Fig. 3e. Notably, L-histidine degradation pathways were strikingly enriched in control diet compared with LPL and MPL (P < 0.05).
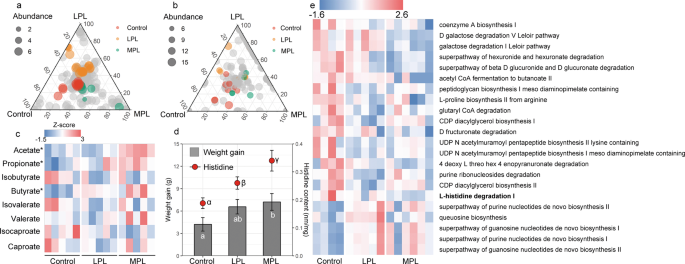
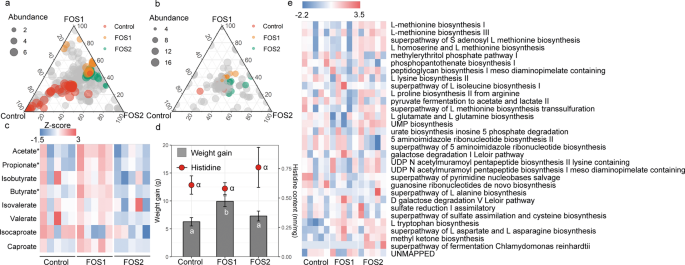
Ternary plots showing the relative abundance of all gut microbial species (>5‱; a) function pathways (b) for control, LPL, and MPL groups. Each point corresponds to a species or one function pathway. The location of each point in the plot represents its mean relative abundance with respect to each diet group, and its size represents the mean value across all three groups. Colored points represent species or function pathways enriched in one diet group compared with the others (red in control, orange in LPL, and green in MPL samples). c Heat map indicating metabolite differences in short-chain fatty acids across L. brandtii consuming different diets. Metabolites with an asterisk represent significant differences between different diet groups. d Differences in weight gain and fecal histidine content across L. brandtii consuming different diets. e Marker pathways with significantly different abundances between precipitation treatment and control.
Targeted metabolomic results showed that the fecal SCFA concentrations were significantly different in voles across the feeding treatments, and 97.7% of the fecal SCFA contained acetate, propionate, and butyrate (Fig. S4). Acetate, propionate, and butyrate concentrations in the fecal matter of voles from the MPL group were significantly higher than in the control group (acetate, t = 3.8, P = 0.002; propionate, t = 2.4, P = 0.03; butyrate, t = 2.6, P = 0.02; Fig. 3c). By contrast, isobutyrate, isovalerate, valerate, isocaproate, and caproate concentrations in the fecal matter remained unaffected (Fig. 3c). A higher weight gain was observed in voles fed with the MP diet (P = 0.047) for 1 month compared with the control diet (Fig. 3d). Similarly, higher fecal histidine contents were found in voles fed with LP diet or MP compared with the control diet (Fig. 3d). However, food intake across the three groups were not significantly different (P > 0.05).
Effects of dietary supplementation of fructose on Brandt’s vole
To assess the potential roles of fructose in regulating the gut microbiome and body growth, we collected the body weight data and measured the fecal amino acid concentrations and also characterized the gut microbiome using shotgun metagenomics sequencing in a diet manipulation experiment. Different diets altered the microbial composition (Fig. S5) and functional pathways. The ternary plots showed that, among all 420 microbial species, the number of enriched species for control, F1, and F2 were 17, 12, and 15, respectively (Fig. 4a and Table S5), of the remaining 376 species shared across the three diet treatment groups. Out of the 186 function pathways, we identified 30 metabolic pathways differentially abundant across control, F1, and F2 groups. Fourteen pathways were enriched in the control, ten pathways were enriched in F1, and six pathways were enriched in F2 (Fig. 4b). Differentially abundant metabolic pathways across the three treatment diets are listed in Fig. 4e. In particular, compared with F1 and F2, the degradation pathway of histidine was markedly enriched in control diet, while the biosynthesis pathway of histidine was depleted in control diet (Fig. 4e). The concentration of acetate and propionate in the fecal samples—came from voles within the F1 group (acetate, t = 3.8, P < 0.01; propionate, t = 3.1, P < 0.01; Fig. 4c) and F2 group (acetate, t = 3.8, P < 0.01; propionate, t = 2.7, P = 0.02; Fig. 4c) were significantly higher than the control group. In addition, the concentration of butyrate in the fecal sample of the F1 group was significantly higher than the control group (t = 2.7, P = 0.02). We found no significant difference in another type of SCFA across the diet treatments (P > 0.05). A higher weight gain was observed for both the F1 group (P = 0.021) and the F2 group (P = 0.019) compared with the control group (Fig. 4d), although there was no significant difference in the food intake between groups (P > 0.05). Fecal amino acid results showed the concentration of histidine in feces was higher in F1 diet and F2 diet compared with control diet (Fig. 4d).
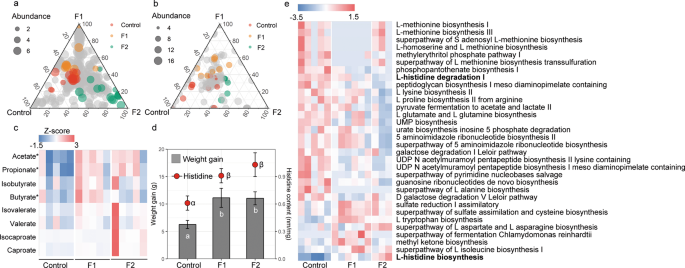
Ternary plots showing the relative abundance of all gut microbial species (>5‱; a) and function pathways (b) for control, F1, and F2 groups. Each point corresponds to a species. The location of each point in the plot represents its mean relative abundance with respect to each diet group, and its size represents the mean value across all three groups. Colored points represent species or function pathways enriched in one diet group compared with the others (red in control, orange in F1, and green in F2 samples). c Heat map indicating metabolite differences in short-chain fatty acids across L. brandtii consuming different diets. Metabolites with an asterisk represent significant differences between different diet groups. d Differences in weight gain and fecal histidine content across L. brandtii consuming different diets. e Marker pathways with significantly different abundances between precipitation treatment and control.
Effect of dietary supplementation of FOS on Brandt’s vole
To further assess whether the increase in dietary FOS affected the gut microbiome and body growth, we recorded the body weight and measured the amino acid concentrations and also processed raw sequencing data from fifteen shotgun sequencing datasets in a diet manipulation experiment. Different diets shaped the microbial composition (Fig. S6) and functional pathways. Out of the 367 microbial species, the number of enriched species for control, FOS1, and FOS2 were 46, 18, and 26, respectively (Table S4), with the remaining 277 species shared across diet groups. Of a total of 202 function pathways, we identified 23 metabolic pathways (three pathways were enriched in the control group; nine pathways were enriched in the FOS1 group; and 11 pathways were enriched in the FOS2 group) that were differentially abundant across the control, FOS1, and FOS2 groups (Fig. 4b). Differentially abundant metabolic functions across the three treatment diets are listed in Fig. 5e. Specifically, we did not observed differences in L-histidine degradation pathways between control and FOS supplementation groups. The concentration of acetate, propionate, and butyrate in voles’ fecal samples from the FOS1 group were significantly higher compared with the control group (acetate, t = 3.68, P < 0.01; propionate, t = 2.2, P = 0.04; and butyrate, t = 2.1, P = 0.05; Fig. 3c). However, we did not observe significant differences between FOS2 and the control group (P > 0.05). Interestingly, we found a negative quadratic relationship between the voles’ weight gain and the doses of FOS supplementation in the diet (Fig. 5d). This n‐shaped relationship indicated that voles with 5% FOS supplementation have more weight gain than voles with no FOS supplementation (FOS1 vs control, P = 0.008) and 10% FOS supplementation (FOS1 vs FOS2, P = 0.04; Fig. 5d). We did not find difference in fecal histidine content between control and FOS supplementation groups (Fig. 5d).
Ternary plots showing the relative abundance of all gut microbial species (>5‱; a) and function pathways (b) for control, FOS1, and FOS2 groups. Each point corresponds to a species. The location of each point in the plot represents its mean relative abundance with respect to each diet group, and its size represents the mean value across all three groups. Colored points represent species or function pathways enriched in one diet group compared with the others (red in control, orange in FOS1, and green in FOS2 samples). c Heat map indicating metabolite differences in short-chain fatty acids across L. brandtii consuming different diets. Metabolites with an asterisk represent significant differences between different diet groups. d Difference in weight gain and fecal histidine content across L. brandtii consuming different diets. e Marker pathways with significantly different abundances between precipitation treatment and control.
Shared and unique microbial populations and function pathways
In the plant-based diet experiment, we reported a total of 37 enriched species. Some of the enriched species were shared with enriched species community in the fructose (21.6%) and FOS (29.7%) supplementation experiments. Notably, there were five enriched species (Eubacterium hallii, Flavonifractor plautii, Libanicoccus massiliensis, Heliobacterium modesticaldum, and Olsenella uli) common across the three diet experiments (Fig. 6a). There were 26 function pathways enriched in a plant-based diet experiment, of which, 30.8% and 7.7% were found with fructose and FOS supplementation, respectively (Fig. 6b).
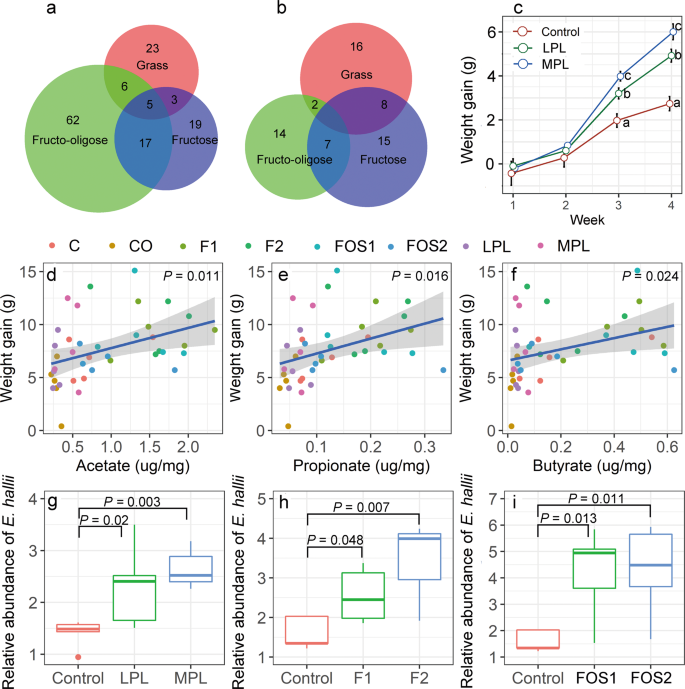
Venn diagrams showing the number of enriched microbial species (a) or enriched function pathways (b) shared by grass feeding, fructose addition, and FOS addition experiments. Body weight gain of voles who received feces from control, LPL and MPL donors, different letters indicate significant differences between the treatments (P < 0.05; c). The linear relationships between short-chain fatty acid contents and L. brandtii weight gain (d–f). The relative abundance of E. hallii across different diet groups (g–i).
FMT, SCFA, and body growth
To test whether microbial changes are causal to body growth of voles in our study, a FMT experiment was carried out. Results showed that at first 2 weeks after gavage administration, voles grew slowly and no significant changes in body growth were found among control, LPL, and MPL groups (Fig. 6c). The body weight has steadily increased by the end of third week, voles who received feces from LPL and MPL donors experienced a greater weight gain than voles who received feces from control donors (Fig. 6c), although the food were all the same during the 4 weeks.
The concentrations of fecal SCFA showed a significant positive effect on the body growth of voles (acetate, P = 0.01; butyrate, P = 0.024; propionate, P = 0.016; Figs. 6d–f). Overall, the weight gains in voles fed with rodent chow-based diet (with/without the addition of fructose or FOS) was significantly higher than that with the plant-based diet (t = 2.3, P = 0.025). In addition, the concentrations of fecal SCFA were higher in voles fed with rodent chow-based diet than plant-based diet (acetate, P < 0.001; butyrate, P < 0.001; propionate, P < 0.001; Fig. S6). We found that the relative abundance of E. hallii was readily affected by different diet supplements. In the plant-based diet experiment, compared with the control group, the relative abundance of E. hallii in the LPL and MPL groups showed 64.3% and 89.3% increases, respectively (Fig. 6g). In the fructose supplementation experiment, we found that voles with dietary fructose supplementation (5 or 10%) had a significantly higher abundance of E. hallii than the control (Fig. 6h). Similarly, in the FOS supplementation experiment, the relative abundance of E. hallii in the FO1 and FO2 groups was 2.6 times higher than in the control group (Fig. 6i).
Source: Ecology - nature.com
