We evaluated dFe bioavailability in 12 water samples from different locations and depths (Table 1; Supplementary Table S1) by conducting ~85 short-term Fe uptake experiments with Fe-limited cultures of 7 different phytoplankton strains varying in size, taxa, and isolation site (Table 2). From these measured Fe uptake rates, we calculated the dFe uptake rate constant for each experiment, for a specific phytoplankton species and seawater (SW) sample:
$$,,{mathrm{k}}_{{mathrm{in – app}}}left( {{mathrm{L}};{mathrm{cell}}^{ – {mathrm{1}}}{mathrm{d}}^{ – {mathrm{1}}}} right) =, {mathrm{uptake}};{mathrm{rate}}left( {{mathrm{mol}};{mathrm{Fe}};{mathrm{cell}}^{ – 1}{mathrm{d}}^{ – 1}} right) {hskip 10pt}/,{mathrm{SW}};{mathrm{dFe}};{mathrm{concentration}}left( {{mathrm{mol}};{mathrm{Fe}};{mathrm{L}}^{ – 1}} right)$$
(1)
These phytoplankton- and seawater-specific kin-app values were then normalized to their respective cell S.A. to derive our dFe bioavailability proxy:
$${mathrm{Bioavailability}};{mathrm{of}};{mathrm{SW}};{mathrm{dFe}}left( {{mathrm{L}}; {upmu} {mathrm{m}}^{ – 2}{mathrm{d}}^{ – 1}} right) = {mathrm{k}}_{{mathrm{in – app}}}left( {{mathrm{L}};{mathrm{cell}}^{ – 1}{mathrm{d}}^{ – 1}} right) quad {hskip 10pt}/,{mathrm{S}}{mathrm{.A}}{mathrm{.}}left( {{upmu}{mathrm{m}}^2{mathrm{cell}}^{ – 1}} right)$$
(2)
Establishing surface area-normalized Fe uptake rate constant—kin-app/S.A.—as a proxy of dFe bioavailability in natural seawater samples
Having proposed a novel methodology for probing dFe bioavailability in natural waters, we first present raw data from a single seawater sample (Baffin Bay) to discuss our experimental design and interpretation of results. The availability of dFe in Baffin Bay water (BBA, Table 1) was tested using six different Fe-limited phytoplankton species (Table 2) in 11 individual uptake experiments, using 55Fe and stringent trace-metal clean protocols (Fig. 1; Supplementary Table S2). In each experiment, the internalization of 55dFe by the cells was monitored over 3–6 h by repeated filtrations of subsamples (Fig. 1a, b; Supplementary Table S2). These cellular 55Fe uptake rates (e.g., Fig. 1a) were divided by the total dFe concentration in the assays ([dFe] + 0.4 nM 55Fe), to derive the Fe uptake rate constants—kin-app—for each phytoplankton species (Eq. 1).
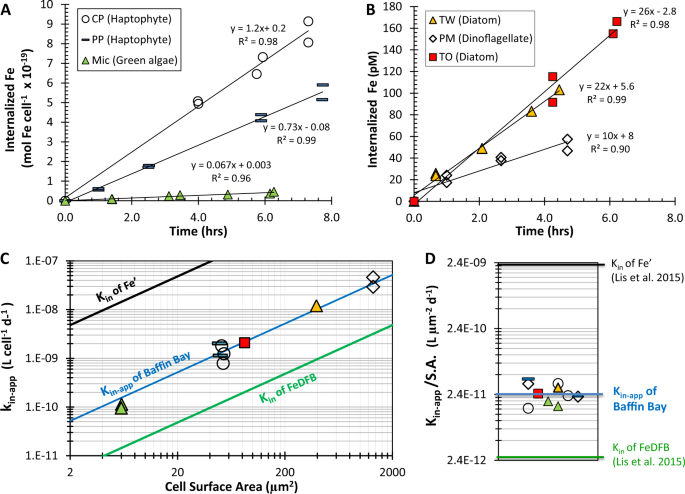
a, b Dissolved Fe uptake by Fe-limited phytoplankton species measured under stringent trace-metal clean protocols and internalized Fe plotted per cell (a) or as total internalized Fe (b). c, d Calculated Fe uptake rate constants for Baffin Bay water—kin-app—the measure of dFe bioavailability as probed by Fe-limited phytoplankton species. Plotting kin-app versus cellular surface area (S.A.) in a log-log plot yielded a single line (c), implying that all phytoplankton probe dFe bioavailability similarly when normalized to surface area (S.A.). Hence, a single kinetic term, kin-app/S.A., can describe the dFe bioavailability in these waters (d). The bioavailability of dFe in Baffin Bay is intermediate between that of inorganic Fe (Fe′) and that of Fe bound to the strong siderophore desferrioxamine B (FeDFB), determined previously. Each phytoplankton strain is labeled in a unique symbol and color that is consistent across all panels.
In order to calculate kin-app by dividing Fe uptake rate by dFe concentration—mostly composed of organically bound Fe—and not by the inorganic Fe concentration (Fe′), it is necessary to demonstrate that the cells are indeed accessing Fe from the organic Fe pool. To do this, we first estimated dissociation rate constants of the organically bound Fe complexes (k′d) in our natural seawater samples containing L1 and/or L2 organic ligands (Supplementary Table S3), using the formation rate constants (k′f) determined in natural seawater by Croot and Heller [32] and our measured log (K_{FeL_i,{{Fe}^prime} }^{cond}) (Supplementary Table S3). For example, for Baffin Bay we calculated a dissociation rate constant—k′d—of 1.1–2.4 × 10⁻⁷ s−1 [calculated from (K_{FeL_i,{{Fe}^prime} }^{cond}) = k′f/k′d, where log (K_{FeL_1,{{Fe}^prime} }^{cond}) = 12.46 and k′f = 3.2–6.9 × 10⁵ M−1 s−1]. Then, using these dissociation rate constants and the measured [dFe], we estimated the maximum supply of Fe′ to the cell surface for biological uptake; which in the case of Baffin Bay it was 1.3 pmol Fe L−1 h−1 (Supplementary Table S3). This supply rate of Fe′ due to dissociation of Fe from organic Fe complexes (FeL) is significantly slower than the Fe uptake rates measured under very dim light (ranged from 7 to 32 pmol Fe L−1 h−1; Fig. 1b, Supplementary Table S2), implying that the cells were indeed accessing Fe from the organic Fe pool. Moreover, the Fe′ concentration initially present in Baffin Bay seawater (2 pmol L−1, Table 1) makes a negligible contribution to the 48–270 pmol L−1 Fe internalized by the cells throughout the experiments (Fig. 1b; Supplementary Table S2). Similar findings were determined for all water types, except for one (Supplementary Tables S2–S4). Hence, we deduced that phytoplankton were indeed accessing Fe from organic complexes in the dissolved Fe pool, and thus the kin-app should be calculated by dividing Fe internalization rates by concentration of dFe, most of which (>99%) is organically bound [24]. Note that our kinetic-based account of Fe uptake from Fe– organic ligand complexes does not specify or confine the transport mechanism at play. The reported mechanisms include reductive release of Fe(II) from the Fe–organic ligand complex [11, 17,18,19, 33], ternary complex formation and possible transfer of Fe from the organic to cell-surface ligand [34, 35], and internalization of the whole complex [36, 37], any of which may act simultaneously or separately.
Another important criterion for calculating kin-app is that the rate of Fe uptake has to remain constant for the duration of the experiments (i.e., linear regression between internalized Fe and time). Indeed, the vast majority of the Fe uptake rates were linear (R2 > 0.85) and had an intercept near the origin (e.g., Fig. 1a, b). In a few experiments (<10%), we observed slower Fe internalization in the last time point, which was then excluded from the calculated rates of Fe uptake. For uptake to remain linear over the course of the experiment it is important to ensure that the overall Fe concentration acquired by the cells does not approach the total available Fe pool; this was accomplished using low cell densities in the experiments (Supplementary Tables S2, S4). The internalized Fe at the end of our uptake assays with the different water samples ranged from 2 to 270 pM (Supplementary Tables S2, S4), and at most, accounted for 22% of the total dissolved Fe concentration.
Next, we examined if all tested phytoplankton species equally probe the bioavailability of dFe in a single water sample by plotting kin-app against cell S.A., or by normalizing kin-app to S.A. For Baffin Bay water, all 11 kin-app values fall on a single line when plotted against S.A. (Fig. 1c) and can thus be normalized to their respective cellular S.A. to yield an average kin-app/S.A. of 2.6 × 10⁻¹¹ ± 8.5 × 10⁻¹² L µm−2 d−1 (Fig. 1d; Supplementary Table S2). This surface area-normalized kin-app describes the average bioavailability of the dissolved Fe in Baffin Bay seawater, and it fits within the “bioavailability envelope” of Lis et al. [16] (black and green lines in Fig. 1c, d).
Evaluating dFe bioavailability in different seawater samples
To evaluate dFe bioavailability in a variety of seawater samples, in addition to Baffin Bay, we present the dissolved Fe bioavailability proxy—kin-app/S.A.—for all 12 water types in two formats: the value for individual experiments for each seawater sample and phytoplankton (Fig. 2a); and the average dFe bioavailability value for each water type (Fig. 2b). We also present all kin-app/S.A. values in a supplementary table organized according to the phytoplankton species with which they were probed (Supplementary Table S5). In the individual experiments (Fig. 2a), it is evident that in some water types, all kin-app/S.A. values obtained by different phytoplankton species agree well with each other (8–14% standard error), while in other samples kin-app/S.A. values are more scattered (18–27% standard error). In some water types, Micromonas Sp. (Mic) and Prorocentrum micans (PM), yield the highest kin-app/S.A., but this trend is reversed in other samples where Thalassiosira weissflogii (TW), Thalassiosira pseudonana (TP) and Phaeocystis pouchetii (PP) yield maximum values (Fig. 2a). Comparison of kin-app/S.A. values from all water types across phytoplankton species (Supplementary Table S5), did not show any statistical differences among them. The lack of systematic differences in the dFe bioavailability parameter among phytoplankton species for a single seawater sample (Fig. 2a; Supplementary Table S5) suggests that the surface area-normalized Fe uptake constants of eukaryotic phytoplankton are similar, in line with previous studies [11, 16, 38]. This lack of systematic differences in kin-app/S.A. among tested phytoplankton strains does not necessarily imply that they all use similar uptake mechanisms, rather it indicates that their uptake mechanisms operate at the optimum efficiency permitted by fundamental physical, chemical or biochemical factors [13, 14]. These findings suggest that multiple or any Fe-limited eukaryotic phytoplankton species can be used to probe dFe bioavailability in a water sample, and that the grand average Fe bioavailability value derived from a series of experiments with a single or several different phytoplankton species can be used to estimate the dFe bioavailability in that water sample. In future experiments employing this methodology, we recommend the use of phytoplankton with rigid cell walls and simple shape, such as centric diatoms, to ease experimental manipulations and calculations.
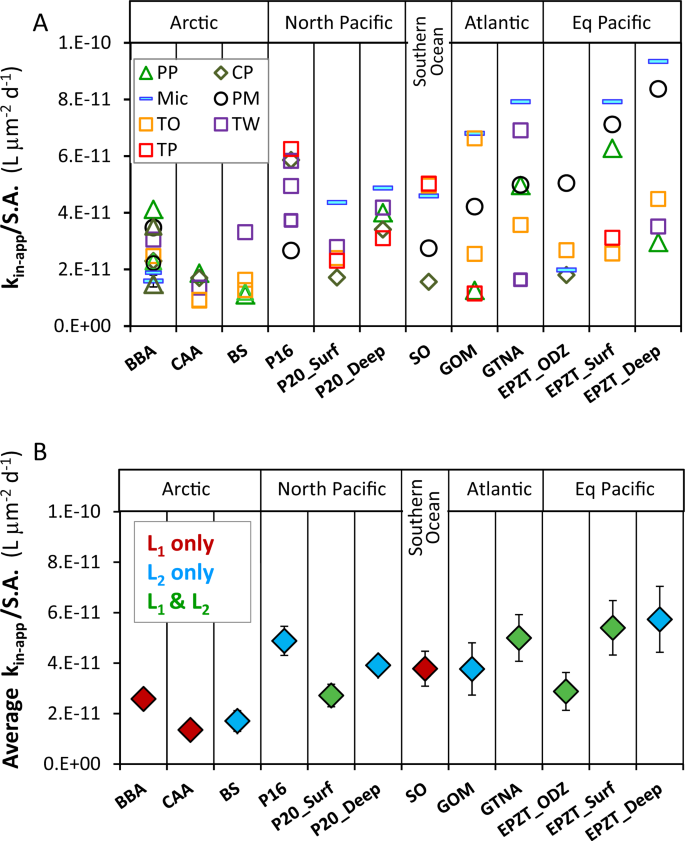
a Individual dFe bioavailability proxies (kin-app/S.A.) in all tested water types (abbreviated on the x axis), derived from Fe uptake rates of various Fe-limited phytoplankton (abbreviated in the legend). b Average dFe bioavailability (average kin-app/S.A.) of all phytoplankton species as a function of water types, colored according to the classes of ligands present in each sample. Error bars are 1 standard deviation of the average. Phytoplankton species: Prorocentrum micans (PM), Thalassiosira weissflogii (TW), Thalassiosira oceanica (TO), Thalassiosira pseudonana (TP), Chrysochromulina polylepis (CP), Phaeocystis pouchetii (PP), and Micromonas sp. (MIC). Seawater samples: Arctic—Baffin Bay (BBA), Canadian Arctic Archipelago (CCA), Beaufort Sea (BS); North Pacific—Line-P stations—P16, P20 surface (P20_Surf), P20 depth (P20_Deep); Southern Ocean (SO); Atlantic—Gulf of Mexico (GOM), GEOTRACES GA03 Atlantic Zonal Transect (GTNA); Equatorial Pacific—GEOTRACES GP16 Oxygen Depleted Zone (EPZT_ODZ), surface (EPZT_Surf), and depth (EPZT_Deep).
Moving from individual experiments (Fig. 2a) to average values (Fig. 2b), we performed one-way repeated-measures analysis of variance to test whether the average bioavailability of dFe was indeed significantly different among seawater samples. This analysis revealed that dFe bioavailability proxy (kin-app/S.A.) was significantly different among seawater samples (p < 0.01). The bioavailability of dFe among water types differs by ~four-fold, from the least bioavailable dFe in the Canadian Arctic Archipelago (CAA) to the most bioavailable dFe in the Equatorial Pacific Deep (EPZT_Deep; Fig. 2b). All three Arctic samples had relatively low dFe bioavailability, whereas some of the Equatorial and North Pacific samples had relatively high dFe availability. While seawater temperature and irradiance will affect dFe bioavailability in surface oceanic waters, in our laboratory experiments these variables were constant. Hence, the differences in dFe bioavailability reported here likely reflect differences in the chemical speciation of Fe in seawater. To explore the link between Fe speciation and dFe bioavailability, we performed Pearson correlations between the average kin-app/S.A. values for each seawater sample and the Fe speciation parameters we determined, and are present in Table 1 and Supplementary Table S1. These include: Fe concentrations ([dFe] and [Fe′]), ligands concentrations ([L1], [L2], [Ltotal] (i.e. sum of both ligands), and [eL] (i.e. excess ligands not bound by Fe)) and complexation capacity of total ligands (α) and free ligands (α′). The statistical analysis did not reveal any significant correlations (p > 0.05). In addition, visual examination of samples with different ligand types (L1 or L2 only, or both), did not reveal consistent trends between kin-app/S.A. and [dFe], calculated FeL dissociation rate, complexation capacity of the free Fe-binding ligands in seawater (α′), or excess ligands [eL] (Supplementary Fig. S1).
Effect of photochemistry on dFe bioavailability
All laboratory experiments were conducted under room-dim lights, not inducing photochemical production of Fe′ from organically bound Fe. In the upper ocean, light and temperature influence the speciation of dFe and are thus likely to affect dFe bioavailability [36]. To examine the effect of photochemistry on our measured dFe bioavailability, we conducted a limited set of outdoor uptake experiments with three species of diatoms and six water types. In all the experiments, exposure to sunlight significantly increased the dFe bioavailability, with an average increase of six-fold in kin-app/S.A. relative to the outdoor, dark controls (Fig. 3, sunlight/dark ratio ranging from 1 to 13).
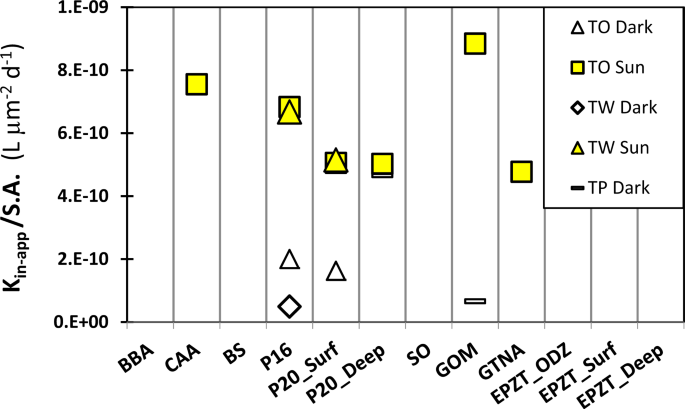
Diatoms species: TW, Thalassiosira weissflogii; TO Thalassiosira oceanica; TP, Thalassiosira pseudonana. Illuminated samples are noted as Sun, while covered samples are noted as Dark. See Table 1 for seawater type descriptions.
In order to compare our experiments with published in situ experiments, we converted the Fe uptake rates reported in these studies to kin-app/S.A. (Supplementary Table S6). In the Southern Ocean [18] and the California upwelling system [27], sunlight resulted in a 3- to 27-fold increase in dFe availability to natural phytoplankton, similar to the light enhancement in our experiments (1–13-fold, Fig. 3). In addition to documenting a positive effect of photochemistry on natural dFe availability, our outdoor experiments yielded kin-app/S.A. values that agree well with other sunlight-exposed experiments [33, 37] (Supplementary Table S6), suggesting that our dFe bioavailability estimates can be generalized and implemented in models. Our findings are in agreement with previous studies documenting that in situ Fe ligands are photolabile, implying that photochemistry in surface waters may play a significant role in Fe acquisition from the dissolved organic Fe pool by oceanic planktons [18, 27].
Source: Ecology - nature.com
