Temperature and fungal fields in test bin
At the start of experiment, the grain temperature increased gradually due to conductive heat transfer between the grain and the (cold and hot) walls. On day 12, the grain temperature reached a stable (equilibrium) condition, increasing from approximately 10 °C at the left wall to 44 °C at the right wall in the upper part of the bin (Figs. 2 and 4). There was a clear temperature gradient in the x-direction (from the cold to the hot wall) at any given grain depth. Some variations in grain temperature were also observed in the y-direction (along the grain depth) due to the effect of cold air inlet (lower left corner) and hot air inlet (upper right corner), causing higher temperature in the upper portion of the bin, in particular along the hot wall (Fig. 2). The overall observation indicated that the temperature distribution (field) in the stored grain was physically driven (mainly through conduction) by the temperature difference between the cold and hot walls at this stage.
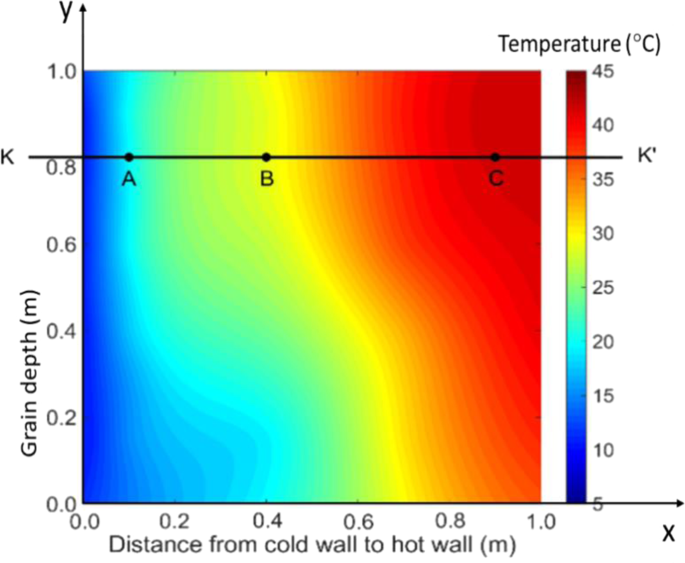
Temperature field (distribution) in the test bin on day 12.
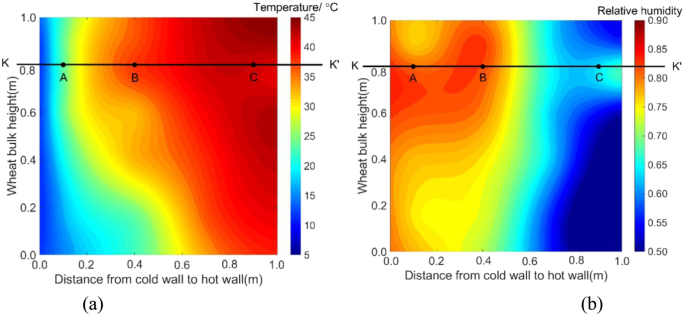
The measured temperature and RH fields of mid-plane in test bin on day 36. (a) temperature, (b) RH (Note: a sampling port was near C, which caused a slight temperature drop and RH rise).
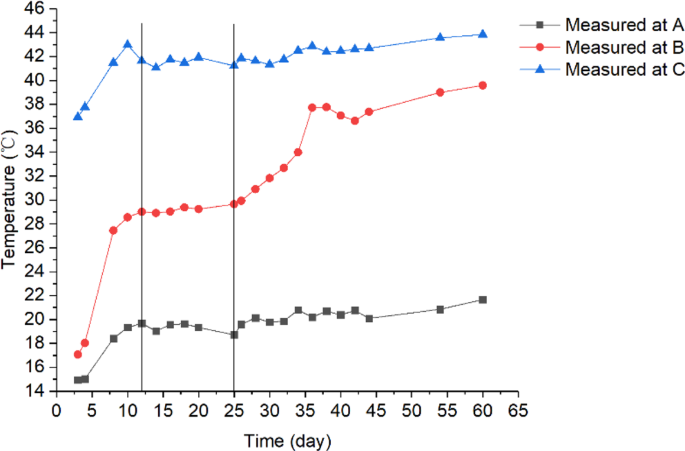
Variations of measured temperature during the experimental period at three locations A(0.1, 0.8), B(0.4, 0.8) and C(0.9, 0.8) in the test bin.
On day 36, a clearly noticeable temperature rise occurred at a point located 0.8 m from the bin bottom and 0.4 m from the cold wall (this location is denoted as B, with coordinates x = 0.4 and y = 0.8) (Fig. 3a). To further examine the temperature changes at location B, the time history of temperature was plotted and compared with other two locations A and C, both were at the same grain depth as B (Figs. 3 and 4). It could be seen: (1) temperature at B started to increase on day 25, and reached a peak of 38 °C on day 38; and (2) little temperature increase (besides some fluctuations) was observed at locations A and C (Fig. 4). At the same time, high moisture (measured RH) was observed at B (Fig. 3b). These observations indicated that a biological field of fungi was emerging at B, causing temperature and humidity to rise. The grain samples taken on day 36 confirmed that the fungal spore count at B had increased to 8 × 10⁶ g−1, which is more than 10 times the initial value (at the start of experiment). The grain samples also showed an increased ergosterol concentration of 43.52 μg g−1, which is 4 times the initial value. Both the spore count and ergosterol concentration indicated significant fungal growth at B on day 36. The fungal spore count increased further to 8 × 10⁷ g−1 and the ergosterol concentration to 50.06 μg g−1 on day 54 (the last grain sampling day). When the test bin was opened at the end of experiment (day 60), moldy grain was found in a small region round B (Fig. 5). Following the method of NSRPC14, A. flavus was identified as the main species, with some A. candidus, in the moldy grain.
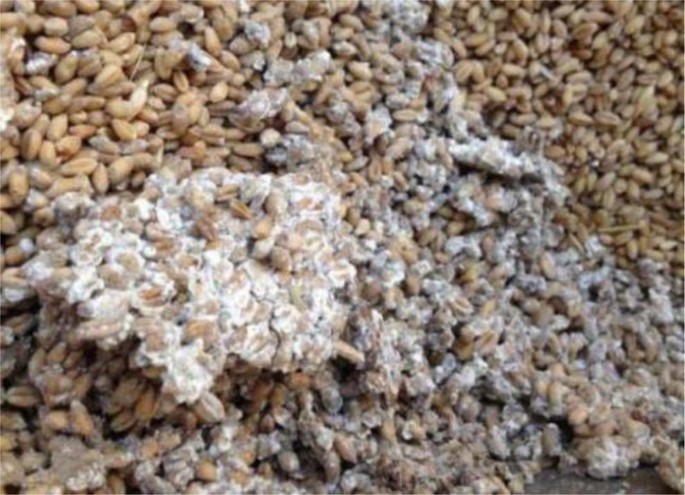
Spoiled (mouldy) grain found at location B (0.8 m from the bin bottom and 0.4 m from the cold wall) on day 60.
Interactions of fungal field with temperature and moisture fields
To explore the multi-field interactions, the measured temperature and RH at B were compared with the two neighboring locations A (0.1, 0.8) and C (0.9, 0.8). Physically, points A and C located at the same grain depth as B (0.8 m from the bin bottom), but A was closer to the cold wall (0.1 m) and C closer to the hot wall (0.1 m). The measurements showed that temperature and RH at B were 29 °C and 80% on day 12 (after reaching equilibrium) (Figs. 4 and 6), respectively, which are suitable for fungi to germinate (the minimum condition of temperature and RH for the growth of main grain storage fungi: >20 °C and >65%RH)18. In comparison, temperature at A was 19 °C, which is lower than the minimum temperature for fungal germination although the relative humidity (83%) at A was suitable for fungi (Figs. 4 and 6). At point C, temperature was 42 °C, which is suitable for fungal germination, but the relative humidity decreased from 74% RH to 60% RH very quickly, because grain was dried near the hot wall (Figs. 4 and 6), which is not suitable for fungal germination. This comparison of environmental conditions among the three points showed that a suitable state of physical fields (both temperature and RH) was reached at B first, and strong interaction occurred between the biological and physical fields at this point: fungi germinated, grew and sporulated, and temperature rose significantly due to heat production by fungi. Whereas, the suitable state of physical fields was not reached at points A and C and no interaction was observed.
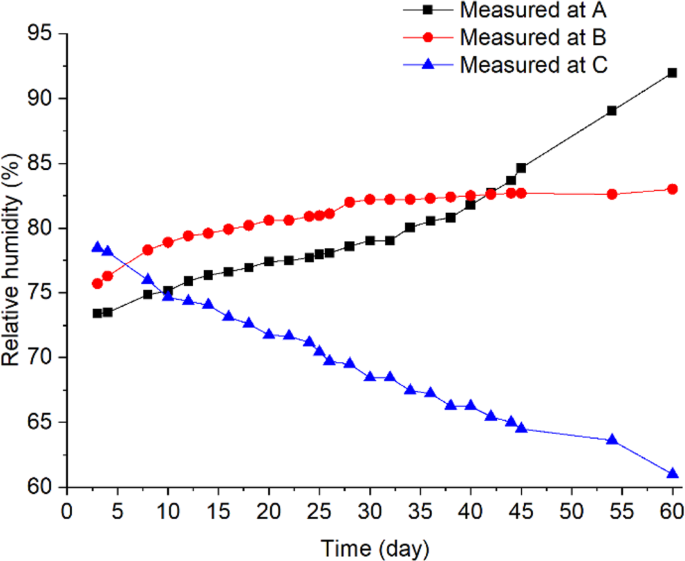
The measured relative humidity at locations (A–C).
Strength of biological field of fungi
To determine the strength of fungal field in the stored grain, the measured temperature data was used in Eq. 3 to calculate heat production by fungi. First, the sensible heat absorbed by grain (ET) was calculated from the grain temperature rise ΔT. Since the left and right walls were maintained at constant temperatures of 10 °C and 44 °C, respectively, grain temperature would increase linearly from 10 °C at the left wall to 44 °C at the right wall once the steady-state was reached. However, the grain was dried more near the hot wall, resulting in a lower thermal conductivity k value and this decrease in thermal conductivity from the cold to the hot wall resulted in a slightly curved temperature profile before fungus emergence (Fig. 7). The measured temperature (Fig. 4) indicated that the equilibrium condition was reached on day 12 and lasted until day 25 when the temperature started to rise due to fungal heating. Using the temperature data for days 12, 14, 16, 18, 20 and 25 to represent the temperature profile before fungal heating, regression analysis was performed using the Origin Data Analysis and Graphing Software (OriginLab Corporation, Northampton, MA, USA) to generate an equation to mathematically predict the temperature profile between the cold and hot walls before fungal emergence (Fig. 7):
$${T}_{B}={10.5}+{32.1}{(x+{0.006})}^{0.6},{R}^{2}={0.999}$$
(4)
where TB is the grain temperature profile (°C) between the cold and hot walls before fungus emergence and x is the distance from the cold wall (m).
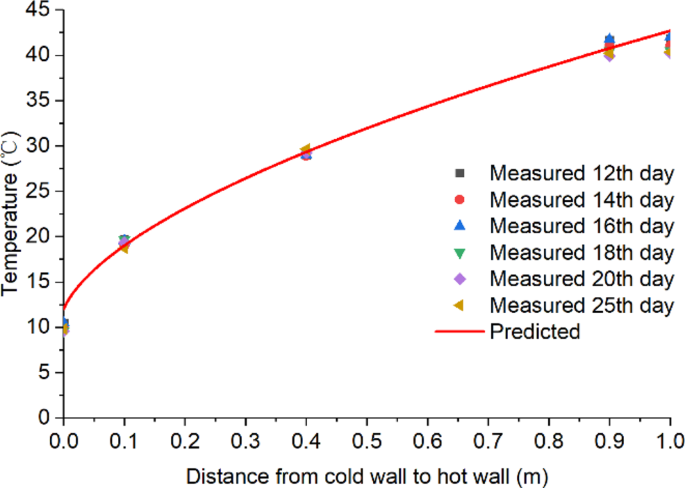
Temperature profile between the cold and hot walls after reaching equilibrium but before fungal emergence (from days 12 to 25) at grain depth of 0.8 m from bottom (covering locations A–C).
When fungi started to grow at B on day 25, heat produced by fungi caused the grain temperature to rise around B, causing the temperature profile to rise above that at the equilibrium, and the grain temperature rise at a given time and location between the cold and the warm walls could be calculated as the difference between the two temperature profile curves (Fig. 8). Generally speaking, the temperature rise ΔT would be a function of both time (t) and location (x, y, z). Mathematically, the temperature rise due to heat production by fungi could be calculated from the temperature difference before and after fungus emergence as follows:
$$Delta T(x,y,z,t)={T}_{A}(x,y,z,t)-{T}_{A}(x,y,z)$$
(5)
where ΔT is the temperature rise due to fungal activities at a given time and location (°C) and TA is the measured grain temperature at a given time after fungal emergence (°C). Note: only the x-direction was considered in this experiment. Based on the temperature rise calculated by Eq. 5, heat absorbed by grain was calculated as follows:
$${E}_{T}=frac{Srho Delta VDelta T(x,y,z,t)}{Delta V}=Srho Delta T(x,y,z,t)$$
(6)
where S is the specific heat of grain (J kg−1°C−1), ρ is the density of grain (kg m−3), ΔV is the space (volume of grain) influenced by the fungal activities (m3).
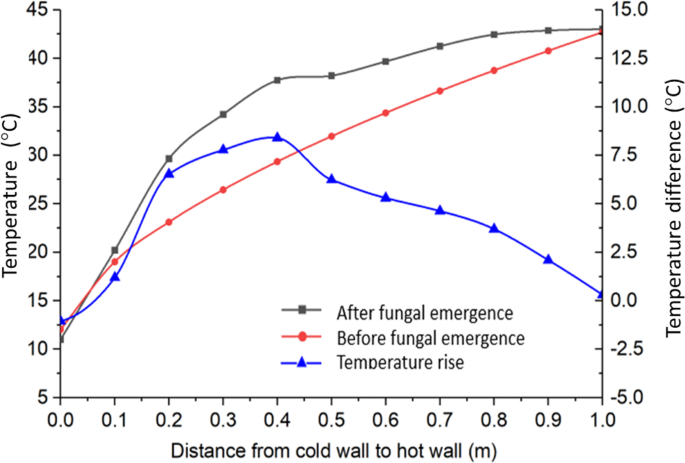
Measured temperature profile with fungal heating (after fungal emergence) and temperature profile before fungal emergence (predicted by Eq. 4), for day 36, and the corresponding temperature rise due to fungal heating.
The conduction heat loss (EC) was determined by considering heat transfer from the center of a small space of Δx = 0.1 m, Δy = 0.1 m, and Δz = 0.1 m (ΔV = ΔxΔyΔz = 0.001 m3) to the surrounding grain mass. The size of this small space was based on the spacing of temperature and RH sensors in the test bin (0.1 m by 0.1 m). Fourier’s law was used to calculate EC as the sum of heat loses by conduction from all six faces of the cubical space (ΔxΔyΔz) under consideration:
$${E}_{C}=frac{kDelta t}{Delta xDelta yDelta z}mathop{sum }limits_{i=1}^{6}frac{{A}_{i}Delta {T}_{i}}{{l}_{i}}$$
(7)
where k is the thermal conductivity of grain, Δt is the time increment (s), Ai is the area of one of the six faces of the cubical space (m2), e.g., A1 = ΔyΔz for the face in the positive x-direction, ΔTi is the measured temperature difference between the center of the cubical space (ΔxΔyΔz) and the corresponding face Ai at a given time (°C), and li is the distance from the center of the cubical space and the corresponding face Ai (m), e.g., l1 = 0.5Δx for the face in the positive x-direction.
Heat loss by convection is due to the movement of air through the interstitial spaces in the grain bulk. Given that the grain was not aerated in the experiment and bin was sealed (minimal free convection), there was little air movement, and therefore, heat loss by convection EV was negligible. Similarly, heat of evaporation was also negligible because the grain moisture changed little during experiment. Therefore, Eq. 3 was reduced to:
$${Q}_{H}={E}_{T}+{E}_{C}$$
(8)
Substituting Eqs. 6 and 7 into Eq. 8, and then into to the definition of field strength given by Eq. 1, the strength of the biological field of fungi in stored wheat was determined as follows:
$$P=frac{Delta {Q}_{H}}{varDelta t}=frac{{E}_{T}}{Delta t}+frac{{E}_{C}}{Delta t}=Srho Delta T(x,y,z,t)+frac{kDelta t}{Delta xDelta yDelta z}mathop{sum }limits_{i=1}^{6}frac{{A}_{i}Delta {T}_{i}}{{l}_{i}}$$
(9)
Using the measured grain temperature TA in Eq. 5 and TB from Eq. 4 to calculate ΔT, and the field strength P was calculated by Eq. 8 as a function of time t (Fig. 9) for location B, and as a function of location x on days 36, 38 and 60 (Fig. 10). A time step Δt = 86400 s (1 day) was used in the calculation to ensure that temperature rise was sufficiently high to be accurately measured by the temperature and RH sensors between time steps.
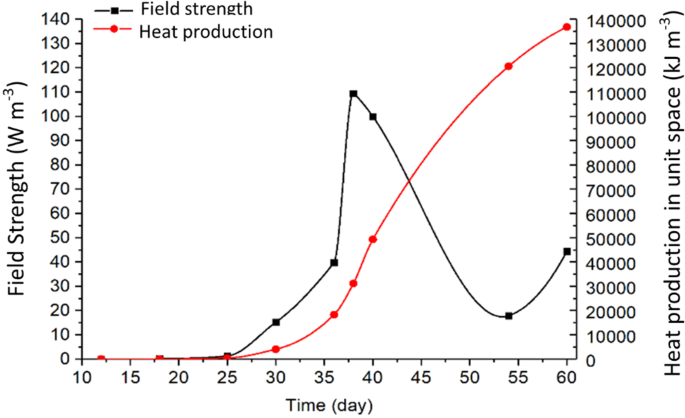
Variation of heat production and field strength of fungi in a small space surrounding B (0.4, 0.8, 0) in the grain stored in a test bin of 1 × 1 × 1 m.
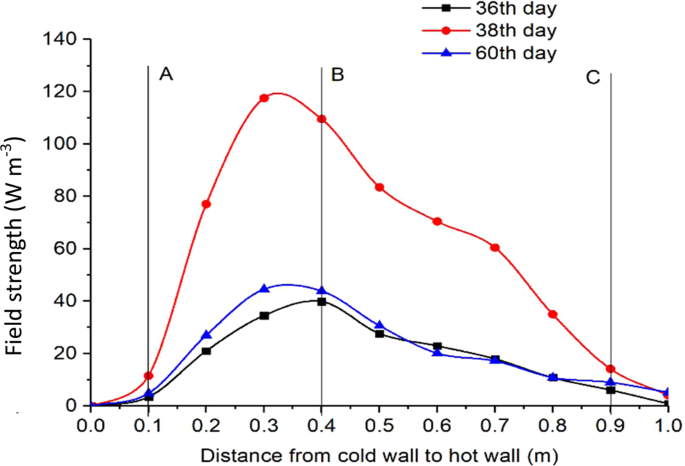
Variation of field strength from the cold to hot walls at a grain depth of 0.8 m in the test bin on different days.
The biological field of fungi remained “latent” until day 25 (i.e., the filed strength increased little between day 5 and day 25, Fig. 9). From day 25 to 38, the biological field developed rapidly (Fig. 9). The strongest field strength was measured to 110 W m−3 at B on day 38. And the heat production accumulated in the small space (0.1 × 0.1 × 0.1 m) surrounding B from day 25 to day 38 was about 30 MJ m−3 (Fig. 9). Using the strongest field strength at B (110 W m−3) on day 38, the heat production was calculated to be 9.5 MJ m−3d−1. Based on the cellular respiration equation under the aerobic condition (C6H12O6 + O2 → CO2 + H2O + heat), This amount of heat production was estimated to be equivalent to the consumption of 3.4 mol m−3d−1 (604 g m−3d−1) of glucose, production of 20.4 mol m−3d−1 (367 g m−3d−1) of H2O, or 898 g m−3d−1 of CO2. Assuming that wheat contained 75% starch (commonly 70% to 80%), the dry matter consumption by fungi was estimated to be about 823 g m−3d−1 at the peak of field strength.
The field strength started to decrease after day 38, while heat continued to accumulate (Fig. 9). It is interesting to note that the field strength started to increase again after reaching a low point (about 18 W m−3) on day 54, indicating the possibility of emergence of another biological field. This is a typical phenomenon of succession of microorganisms in stored grain ecosystems – rising temperature and moisture, or changes in levels of various gases (e.g., oxygen and carbon dioxide) level created a favorable environment for another biological entity to grow.
The spatio-temporal distribution of field strength is illustrated in Fig. 10. On day 36, the field strength peaked at B. While the shape of the curve remained about the same, the field strength reached the highest level on day 38, with the peak (about 120 W m−3) slightly shifted to the left from B. The field strength started to decrease after day 38 because of excessive heat production, causing temperature to rise beyond the optimal range for fungi, or exhaustion of oxygen and nutrients, but the spatial distribution (the curve shape) of field strength remained the same (Fig. 10). The above observations clearly indicated that the distribution and evolution of biological entities (fungi) measured in this experiment behaved like a physical field in that the field strength varied spatio-temporally.
Source: Ecology - nature.com


