Temperature and productivity trends
The analysis of the whole dataset, employing traditional statistics on the monthly series, is shown in Figs. 2, 3 and Tables S1 and 2. Along with raw data (Fig. 2A), we also show the long-term series of annually averaged data (Fig. 2B). This record showed large interannual variability of all variables, revealing patterns more complex than simple and synchronous monotonic changes in time. Trend analysis identified highly significant long-term changes in only two variables as: temperature increase and NPP decrease (p < 0.001; Table S1). Phosphate concentration also showed a positive trend that was statistically significant (p < 0.001), but this result was less reliable because it was driven by one isolated spike in the dataset at the end of the series. Slightly significant trends (p < 0.05) were detected for concentrations of silicate (negative trend) and chlorophyll b (positive trend). No significant trend was identified for the mixed-layer depth or the density gradient.
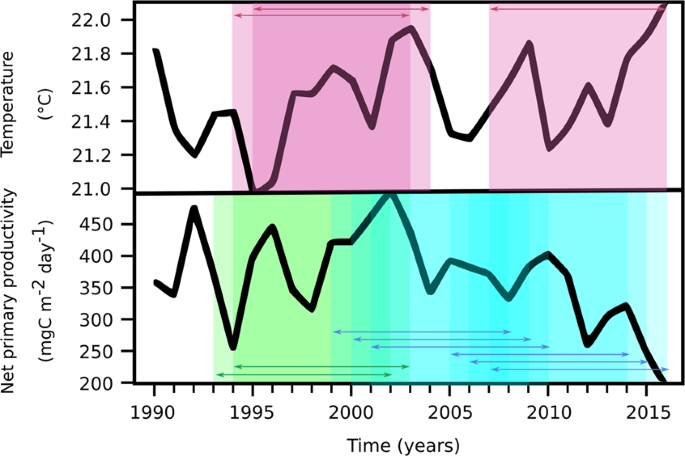
Associated trends of temperature and net primary productivity at the BATS site. The annual averaged time-series of temperature and net primary productivity (NPP) are shown, in comparison with the results of time-windowed Seasonal Kendall tests (window = 10 years) conducted on the monthly-averaged time series. In the uppermost plot, red boxes highlight periods of significant warming; in the lowermost plot, green and blue boxes highlight periods of significant increasing and decreasing of NPP, respectively. In both plots, arrows indicate overlapping between subsequent windows showing statistically significant ten-years trends.
As further evidence of the putative association between temperature and NPP, the time-windowed analysis identified an opposite covariance of these variables over the whole record (Fig. 3). Positive trends in temperature were detected in the periods 1994–2004 (p < 0.01) and 2007–2016 (p = 0.02), with the first being the decade of fastest warming. Positive trends of NPP were detected over the period 1993–2003 (p < 0.01), in agreement with analyses of Saba and co-authors27 and Lomas et al.16 who reported a 2% increase per year in NPP from 1989 to 2007. However, our analysis of the 1990–2016 record identified two eras of NPP decrease after 2007: 1999–2010 (p = 0.01), and 2005–2016 (p < 0.01), with the fastest decrease occurring between 2007 and 2016. These results suggest the possibility of a biogeochemical transition at the BATS site beginning in the mid-2000s.
Based on our working hypothesis, the overall negative NPP trend could be related to the long-term changes in the physical properties of the water column, driven by the multi-decadal rising of temperature in the photic zone. However, as revealed by the time-windowed analysis, the fastest decade of decreased NPP occurred at the end of the record, while the fastest temperature increase occurred from 1994–2004. Thus, even though 2010–2016 was the period of highest heat accumulation in the upper (<−700 m depth) Atlantic Ocean over the last 150 years28, we cannot attribute the largest drops in NPP (occurring in the last decade of the time series) solely to warming because there was an earlier decade when temperature increased at a faster rate. One possible explanation for this observation is that the fast warming between 1995 and 2004 induced a a physiological response in phytoplankton (e.g., changing C:P ratios in cells) that maintained high NPP levels, whereas the following further warming led to conditions outside the cells’ physiological range and, thus, the collapse of NPP. However, as a general consideration, mechanistic interpretations should be limited at this stage because of potential inter-dependencies of several variables that can affect NPP.
Mechanisms behind productivity trend
Ocean monitoring is increasingly applied to use observed dynamics of physical-chemical variables to hindcast, and eventually forecast, the dynamics of key processes such as primary productivity. However, oceanographic databases often include sparse and missing values of variables having large-amplitude fluctuations and high variance. As a result, these datasets contain weak signals when explored with traditional statistical techniques, which basically work under the assumption of linearity. In fact, ecological processes are driven by nonlinear responses to perturbation29,30, such as changes in community composition, physiological acclimation and evolutionary adaptation to change, which can be fast and dramatic in phytoplankton31. Moreover, due to the complexity of plankton communities, environmental factors can affect key functional groups both directly and indirectly, e.g. through indirect effects playing at community level32, and long-term amplifications occurring at ecosystem scale33.
To explore mechanistic relationships between phytoplankton productivity, the chemical environment, and stratification dynamics, and to identify the mathematical laws mapping those relationships, we applied different categories of ML techniques to the BATS dataset. Results from ML are summarized in Table 1, showing correlation coefficients between measured and mathematically-predicted NPP and the Mean Absolute Error (MAE) as a metric of model skill34. Among all techniques, the best match (highest correlation, smallest MAE) between measured and predicted NPP was obtained from Genetic Programming (GP), and we discuss herein the outcome of that analysis in detail. Nonetheless, we must note that the best performing ML method still has a 25% error. This reflects the complexity of oceanic systems, including many other potential driving factors that are missed from our analysis, such as biological interactions and algal physiological plasticity that can have cascading effects on ocean biogeochemistry33,35,36,37.
The match between observed and predicted NPP by the ten different GP experiments is shown in Fig. 4 (see also equations in Methods). Most equations from ML experiments were successful at predicting NPP based on inputs of the physical/chemical/biological variables we considered. In seven out of ten experiments, the correlation coefficient between predicted and measured NPP was higher than 0.7 (Fig. 4A). As a main driving factor, temperature negatively impacted NPP, as it showed a minus sign in the equations derived in nine of the ten experiments (Fig. 4B, Tables S4–13). When considering the sensitivity analysis, deriving from a 10-fold validation procedure performed for each experiment, the negative impact of temperature on NPP was 100% probable in each experiment. This observation verifies the strong dependence of NPP variability on temperature at the BATS station over the 1990–2016 observation period, consistent with the long-term trend analysis above. However, unlike trend analysis, ML allowed us to analyse the impact of other, potentially interconnected variables on net primary productivity that did not show long-term trends.
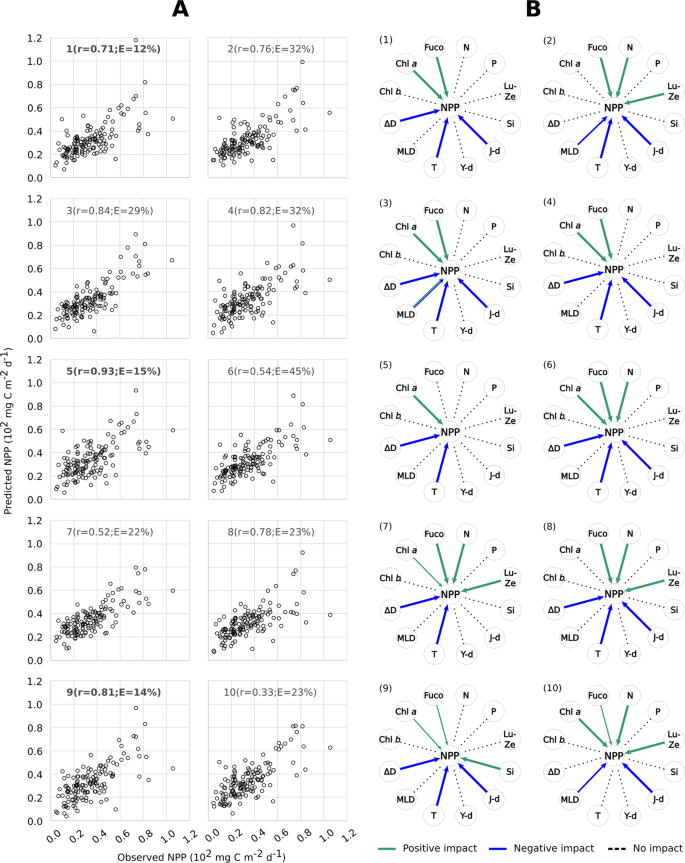
Results of genetic programming analyses on the BATS dataset. (A) Comparisons between observed values of net primary productivity (NPP) and those predicted by ten different GP experiments; the regression coefficient ‘r’ and the Mean Absolute Error ‘E’ are indicated for each experiment. The Mean Absolute Error in Table 1 is the average of values indicated in this figure. The experiments with the best match between real and predicted data are in bold. (B) Synthetic representation of the impact of different variables (N = nitrates; P = phosphates; Lut-Zea = lutein-zeaxanthin; Si = silicates; J-day = Julian day; Y-day = the day of the year, i.e. a parameter used to express the progress of seasons; T = temperature; MLD = mixed layer depth, ΔD = density gradient; Chl b = chlorophyll b; Chl a = chlorophyll a; Fuco = fucoxanthin) on net primary productivity NPP, according to ten GP experiments, coded as (1–10) in the graphs; green and blue arrows indicate either positive or negative impacts of a variable on NPP, respectively; arrow thickness is proportional to the magnitude of the impact.
For instance, the density gradient negatively impacted NPP in eight out of ten experiments and this impact was 100% probable, based on 10-fold validation (Fig. 4B, Tables S4–13). This means that, over the whole period of observation, the smallest NPP coincided with the highest density differences between the surface and deep layers. This association reinforces the hypothesis that NPP decreased between mid-2000s and 2016 due to the parallel stabilization of the water column as stratification intensified. However, we must note that the depth of the mixed layer (MLD) did not show the same influence on NPP as the density gradient. After ML, MLD was present in the final equation in only three out of ten experiments and in two of them it showed a significantly negative impact (see experiments #2, 10; yet, in exp. #3 MLD could impact NPP both positively and negatively with the same 50% probability; Fig. 4B, Tables S4–13). The apparent disconnect between the density gradient and the mixed-layer depth can be explained as follows.
Phytoplankton productivity in the open ocean is regulated by the transport of nutrient-rich deep waters to the photic zone. This transport is mediated by vertical mixing that is damped by thermal stratification13. Based on our analyses, NPP is negatively impacted by surface warming and its strengthening of stratification, measured as the density gradient. GP results indicate that MLD had little effect on NPP, suggesting that other factors, such as the rate of mixing and not its absolute vertical extension, are more determinant in the production dynamics17. For example, if mixing is slow enough, due to a stronger density gradient, nutrients in the photic zone are exhausted more quickly, thus limiting phytoplankton productivity.
Analogous to the density gradient, Julian day was also well represented in the final equations derived from GP: this variable was included in the outcome of all ten experiments and exerted a strong and negative impact (probability = 100%) over NPP in eight of them (Fig. 4B, Tables S4–13). In this respect, GP confirms the long-term decrease of NPP – i.e., temperature increases and NPP decreases as the observations extend over time.
On the contrary, the day of the year (Y-day) – i.e. an independent variable representing seasons in the mathematical equation from GP – showed no effect on NPP. This result could stem from the fact that the codification of the Y-day from 1 to 365 is not adequate, because it could fail to convey the cyclical character of the seasonal changes, unless it is transformed using periodic functions (e.g. Gregor et al.38). We addressed this point by running GP with transformed Y-day data, but this operation yielded lower predictive power: in this way Y-day had a forced proportionality with temperature, resulting in a weak correlation between measured and predicted NPP (MAE > 300%). As a matter of fact, formulas deriving from genetic programming (see the ten GP equations in the methods section) identified no role played by annual periodicity in driving the long-term trend of primary productivity. The trend of decreasing NPP was mainly associated with interannual and decadal variability of controlling factors, as already indicated by our trend analysis using linear statistics.
In synthesis, based on GP analysis, temperature, stratification and time (expressed as Julian day) were highly statistically interrelated – i.e., they all showed negative associations in the mathematical formulation of NPP as a function of all the other variables (see GP equations in Methods). These three variables exerted a similar impact on NPP (see sensitivity analyses results in Tables S4–13).
Unlike temperature and stratification, the concentrations of pigments Chl a and fucoxanthin exerted a positive impact on NPP, with Chl a showing a 100% sensitivity in six out of ten experiments, and fucoxanthin in seven out of ten (Fig. 4B; see also equations in Methods and sensitivity analyses results in Tables S4–13). This suggests that the largest increments of phytoplankton productivity in the Sargasso Sea were generated by blooms of eukaryotic microalgae (i.e., diatoms which contain fucoxanthin), which reach the highest biomass peaks at the BATS station39. However, since Chl a and fucoxanthin are positively associated with NPP, the long-term productivity decrease could be explained by weakening of phytoplankton blooms during the investigated period. Lutein-zeaxanthin, which is diagnostic of Synechococcus cyanobacteria, also exerted a positive but smaller magnitude impact on NPP (100% positive sensitivity was gathered in four experiments only, Fig. 4B; Tables S4–13). Chl b, diagnostic of Prochlorococcus cyanobacteria, had no association with NPP.
Ocean chemistry and productivity decrease
Our results are consistent with previous studies showing that both eukaryotic and prokaryotic microalgae drive phytoplankton biomass variability at the BATS site. Based on previous studies, the relative contributions from eukaryotes/prokaryotes can change in response to: (i) seasonal hydrodynamic modifications in the water column (production is generally higher during winter-spring), and (ii) shifts in the dominant circulation regime occurring in the Sargasso Sea over multi-annual time scales (i.e., relating to the North Atlantic Oscillation)39.
However, at both annual and multi-annual time scales, phytoplankton composition depends on the state of the chemical environment, i.e., which nutrients are present and at what concentrations and supply rates13. In this context, nutrient remineralization plays an important role in open-ocean productivity, by driving processes underlying NPP trends. Based on our ML analyses, nitrates are the only inorganic compound exerting a significant impact on primary production in the Sargasso Sea, while phosphates and silicates do not (the former never being significant and the latter showing a 100% positive sensitivity in only one experiment; see Fig. 4; Tables S4–13). Furthermore, since ML analysis was based on raw data points, we can reliably exclude that the analysis of the association between NPP and phosphates was affected by the single and isolated spike shown by the latter at the end of the time series (see Fig. 2A).
Thus, nitrates showed a significant positive impact on NPP (100% sensitivity) in five out of ten ML-experiments, and these nutrients were interrelated with pigments (they all had positive coefficients in the equations resulting from GP). This suggests that higher concentrations of nitrates were essential to drive blooms of phytoplankton groups having Chl a and fucoxanthin, such as diatoms. Thus, a decrease of nitrate supply to surface waters by the intensification of stratification would have reduced phytoplankton bloom magnitude in the photic zone. Conversely, the lack of influence of phosphates and silicates on NPP, revealed by GP results, could be explained as follows.
Firstly, phosphate is quickly re-mineralised and, therefore, made biologically available in the upper 50 m of the water column of the observed region40. This fast recycling would limit the negative impact exerted by the enhanced stratification on phosphate replenishment in the photic zone. In addition, changes in phytoplankton composition due to the relative increase of prokaryotes (see the higher values of Chl b, in comparison to Chl a, during the last decade of the BATS series; Fig. 2) can change phytoplankton C:P ratios to an extent that they need 50–67% less phosphates to maintain the same level of NPP35.
Secondly, silicates are essential for some eukaryotic microalgae to build exoskeletons, but concentrations in the upper 100 m of the Sargasso Sea are never depleted to levels observed for nitrates19. The surface ocean is under-saturated in silicate because the frustules of dead diatoms dissolve rapidly and release Si that is quickly assimilated by living diatom cells that require low concentrations to support vegetative growth41,42.
Source: Ecology - nature.com
