NMR analysis of Hot Water Extracted (HWE) green tea samples
An overlay of representative 1D 1H spectra from HWE buried and buried tea is shown in Fig. 1.

600 MHz 1H NMR spectra of the HWE (a) unburied, (b) grassland, (c) woodland, (d) RMII and (e) RMI buried green tea. The assignment of the unburied tea signals is given in Supplementary Fig. S2.
The spectra can be divided into three main regions: 8.5–6 ppm – aromatics (mostly catechins), caffeine (in the unburied tea); 5.5–3 ppm – mostly carbohydrates, caffeine, amino acids, catechins and organic acids; and 3–0 ppm, aliphatic molecules and moieties, such as amino acids, fatty acids and catechins. Assignment of the major signals present in the 1H NMR spectrum of the HWE unburied tea based on literature data22,29,30 and 2D NMR analysis31, is given in Supplementary Fig. S2. The spectrum of unburied green tea shows a number of sharp resonances, as one would expect for a mixture of small to medium size molecules. Signals of a polysaccharide, amylopectin32, were also identified (Supplementary Fig. S3). There are clear differences between the HWE spectra of the buried and unburied tea, which indicate that burial has changed the molecular composition. Starting with the aromatic region, the signals of catechins dominate the spectra obtained from the unburied tea and the Red Moss of Balerno raised bog under restoration (herein referred to as RMII), as broad signals in the latter sample, while these are greatly reduced in the other samples (Fig. 1 and Supplementary S4). The carbohydrate region separates spectra into two groups: peatland and grassland/woodland samples. For both groups, most of the unburied tea carbohydrates have disappeared (Supplementary Figs. S5 and 6), including the polysaccharide, amylopectin. New polysaccharide signals appeared in the spectra of peatland samples that belong to arabinogalactans – a known component of the green tea33. While in the woodland/grassland samples the small carbohydrates, trehalose and mannitol were identified, which are known stress molecules of microbial origin (Supplementary Fig. S7)34,35. Finally, in the unburied tea, the region below 3 ppm contains signals of typical tea compounds (CH2 groups of catechins, theanine – a tea specific amino acid -, other amino acids, carboxylic acids and fatty acids). In the peatland samples these CH2 signals are broad with additional broad humps appearing at around 2.1, 1.3 and 0.9 ppm in all four samples, again with distinct differences between the peatland samples and the grassland/woodland samples. The signals of theanine (and also caffeine) disappeared in all samples and compounds such as alanine (1.47, 3.76 ppm) became more pronounced in the spectra of the latter two samples, while lactic acid (1.32, 4.1 ppm) appeared strongly in the grassland samples. Several grassland samples also contained elevated levels of fatty acids. Some of the spectra obtained from the damaged Red Moss of Balerno raised bog site (herein referred to as RMI) were similar to the RMII spectra, while the others appeared similar to the woodland spectra. The characteristics described above are typical for the majority of the spectra obtained from an individual site (Supplementary Figs. S8–S11).
Relaxation and Diffusion Order SpectroscopY (DOSY) analysis of HWE green tea samples
To investigate the nature of the changes in the 1H spectra discussed above, T1 and T2 relaxation and DOSY experiments were recorded on the representative samples presented in Fig. 1. Generally, the T1 and T2 relaxation times of buried samples shortened significantly (see Supplementary Tables SIII–SV and Figs. S12–S21) relative to the unburied tea sample. The RMI sample had the shortest relaxation times, while the woodland sample had values close to the unburied tea sample. These experiments indicated that, within the NMR detection limits, both large and small molecules were generated by the burial process, unexpectedly across the compound class range.
Analysis of the DOSY spectra (Fig. 2) confirmed the results of the relaxation experiments showing a spread of molecular sizes between 90 g/mol to 55,000 g/mol (Supplementary Fig. S22). The DOSY peaks of the unburied tea sample appeared in the expected molecular range, reflecting the presence of small (amino acids such as theanine, caffeine, theobromine, gallic acid, glucose), medium (sucrose, catechins) and large (mainly amylopectin) molecules.
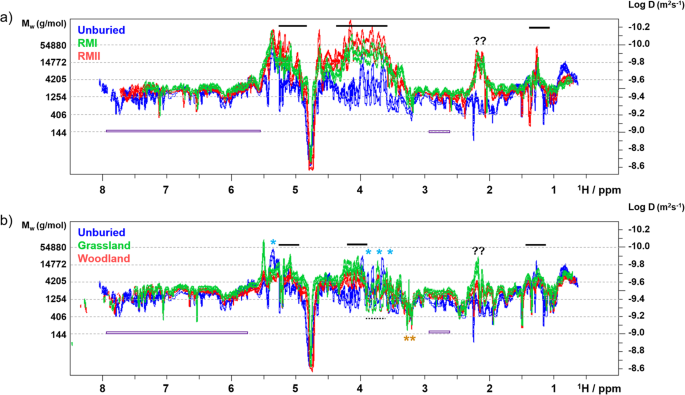
The 800 MHz 2D DOSY spectra of the HWE tea samples. Overlay of the (a) unburied tea spectra with RMI/RMII and (b) grassland/woodland spectra. Selected areas are labelled and discussed in the text. Blue stars above the spectra indicate signals of amylopectin, arabinogalactans are labelled by horizontal bars, dashed bars indicate signals of trehalose and mannitol. Orange stars indicate OCH3 groups. Question marks label unassigned signals from large molecules. Catechin signals are marked by purple bars. The shift of the signals towards larger molecular weight seen in the grassland spectra could be due to presence of oxidation products of catechins, e.g. Theasinensins42.
The DOSY spectrum of the RMII sample confirmed that the broad signals in the aromatic region belong to catechins and not to large molecules. The broadness thus being a consequence of heterogeneity due to their partial modifications or dynamic aggregation. The dominant and unique feature of the DOSY spectra of the RM samples (Fig. 2, Supplementary Figs. S24 and 25) is the appearance of a large arabinogalactan (Supplementary Figs. S5 and S6)33. On the other hand, sharp and intense signals resonating between 3.5 and 4 ppm in the spectra of the woodland and grassland samples (Supplementary Figs. S26 and 27) belong to trehalose and mannitol34,35.
Chemometric analysis of 1H NMR spectra of HWE green tea samples
Principal Component Analysis (PCA) of 1H spectra of 34 HWE tea samples was performed to characterise the sample set. Two principle components were extracted (Fig. 3a) accounting for 76% of the total variance (39 and 37% by PC1 and PC2, respectively). The percentage of the total predicted variance was 85% (28 and 57% by PC1 and PC2, respectively). As expected, the unburied tea samples clearly separated from the rest, falling outwith the 95% Hotelling’s T2 ellipse.

PCA score plot based on the 1D 1H 600 MHz NMR spectra of (a) all 34 green tea samples: unburied, tea buried in grassland, woodland, RMI and RMII, (b) only buried tea samples. The legend indicates the colour coding for each sample site. The Hotelling’s T2 ellipse represents the 95% confidence interval. Outlying RMI or RMII samples are marked by a single or double asterisks, respectively.
Focusing on the buried samples, PCA was repeated excluding spectra of the unburied tea (Fig. 3b). Two principle components were again extracted accounting for 72% of the total variance (59 and 12% by PC1 and PC2, respectively). The percentage of the total predicted variance was 75% (56 and 20% by PC1 and PC2, respectively). The samples separated along PC1 in a similar manner as seen in the relaxation and DOSY experiments, into RMI/RMII and grassland/woodland groups. The largest separation was seen between the RMII and grassland samples, while the woodland samples partially overlapped with the grassland samples. The RMI samples were the most heterogeneous group, with some overlapping with the RMII and others with the woodland samples. Visual inspection of the RMI 1H NMR spectra confirmed that the respective samples share a similar appearance to either the RMII or woodland spectra (Supplementary Figs. S10 and S11). Overall, the PCA analysis of the 1H NMR spectra of the HWE buried tea indicated that the within-group variation was significantly less than the between-group variation for the RMII and grassland samples. The PC1 loadings (Supplementary Fig. S28) identified spectral regions responsible for this separation reflecting the disappearance of catechins and the appearance of trehalose, mannitol and aliphatic compounds (unassigned signals at ~3.15 ppm) in the woodland, grassland and some RMI samples, as well as the appearance of arabinogalactans in most RMII and some RMI samples. The amylopectin anomeric signals visible in the PC2 loadings at ~5.4 ppm were most abundant in some of the RMI spectra.
The subsequent PLS-DA analysis (Supplementary Figs. S29 and 30), in addition to demonstrating a clear separation of the RMII and grassland samples seen by PCA, also separated the woodland samples from the rest. Some RMI samples continued to overlap with RMII samples, while some moved towards the woodland samples. The regions of the NMR spectra that contributed most to the PLS clustering are indicated in the form of biplots (Supplementary Fig. S29); the compounds resonating in these areas were identical to those identified by PCA analysis presented above. The hierarchical clustering analysis (HCA) dendrogram based on PLS-DA (Supplementary Fig. S30) mirrors the clustering of the PLS-DA score plots with labelling of individual samples linking them to the original 1H NMR spectra (Supplementary Figs. S8–11).
Despite significant overlap of 1H signals, chemometric analysis of the NMR data identified differences between the composition of the HWE buried tea from different soil types and provided structures of discriminatory molecules.
FT-ICR-MS analysis of the HWE green tea samples
The sensitivity and resolution of FT-ICR-MS provides a complementary view to the analysis of tea offered by NMR. High quality MS spectra were obtained for unburied and buried green tea samples (Table SVIII) with between 489 and 2023 peaks observed with S/N > 5 in the m/z range between 150 and 1000 g/mol. An assignment rate of 81–86% (including isotopologues) with a standard deviation ≤2% was achieved for all samples. The average number of formulae assigned per site had a low standard deviation (±11–18%) with the exception of the RMI samples (±46%) (Table SIX).
Altogether, 2385 unique monoisotopic molecular formulae were identified in the complete sample set (24% CaHbOcNd, and 76% CaHbOc). Woodland and grassland samples yielded the largest number of formulae (1675 and 1667, respectively), approximately double the number seen in the unburied samples (834). This is in stark contrast with the peatland samples that yielded numbers closer to those observed for the unburied tea, nevertheless, with distinct differences. For RMI samples, 29% more formulae (1079) were identified, while the trend was the opposite for the RMII samples, with 26% less formulae (620) identified. A closer inspection of the six RMI samples indicated that half of the samples had a larger average number of molecular formulae assigned (721), while the other samples had less than half (327) – an amount comparable to the RMII samples. The number of nitrogen compounds identified in the buried samples was in the order: grassland > woodland > RMI > RMII. This order follows the elemental analysis of the non-HWE buried samples (Table SII).
The assigned molecular formulae were analysed with the help of an UpSet plot (Fig. 4, Table SX)36. These plots help visualize the distribution of compounds in a sample set, revealing a wealth of information. Molecular formulae for samples from n = 5 different environments can be represented by a maximum of 25 − 1 = 31 intersections (I1 to I31) containing compounds common to k = 1–5 sample sets. Symbols ({I}_{i}(begin{array}{c}5 kend{array})) are used here to refer to individual intersections; these were ordered in the descending order of the number of formulae they contain. Formulae were only found up to ({I}_{28}(begin{array}{c}5 kend{array})) and the first 19 intersections shown in Fig. 4 represent more than 99% of the compounds.
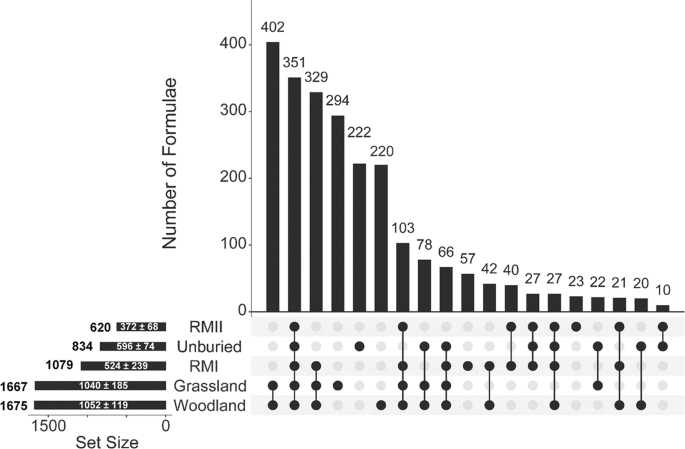
UpSet plot of the (-) ESI FT-ICR-MS data of the green tea samples. The plot shows for each site: the total number of unique total formulae (on the left); the average + standard deviation of formulae assigned (inside the horizontal bar). The vertical bars indicate the number of common assigned formulae for individual intersections defined by black circles and ordered in the descending population. Intersections I1–3 covered 46% of the assigned formulae, while the I4–6 and I7–9 intersection cumulatively extended the coverage to 77% and 88%, respectively.
A closer inspection of the intersection plots gives further insight into the molecular make-up of the tea buried in different sites. As I1 to I9 contained 88% of unique formulae, a detailed analysis presented here is limited to these intersections. The largest number of formulae (402) belongs to the ({I}_{1}(begin{array}{c}5 2end{array})) group containing formulae found in woodland and grassland samples only. Similarity between the grassland and woodland samples is reinforced by the fact that the ({I}_{2}(begin{array}{c}5 5end{array})) intersection, containing 351 formulae common to all sites, was the second most populated. It was interesting to see that the next most abundant intersection was ({I}_{3}(begin{array}{c}5 3end{array})), containing 329 formulae from the grassland, woodland and RMI samples. In contrast, the ({I}_{22}(begin{array}{c}5 3end{array})) intersection, containing formulae from the grassland, woodland and RMII, showed only 5 formulae (data not shown). This points towards similarities between the green tea buried at RMI and grassland/woodland sites and indicates differences between the green tea buried at the two RM sites. The I4 to I6 intersections are all of the ((begin{array}{c}5 1end{array})) type, i.e. contain unique formulae found in one site only. The 222 formulae identified in the unburied tea only, I5, represent compounds that were degraded in all environments. The numbers in the grassland (I4) and woodland (I6) intersections are significant (half of the I1 compounds), indicating the different effect these environments have on the tea samples. The next three intersections, I7–9, extend the coverage to 88% of compounds. The ({I}_{7}(begin{array}{c}5 4end{array})) intersection, encompassing all but the unburied tea samples, showed 103 formulae. These represent compounds that were removed from samples in all environments. The next two intersections I8 and I9 are of ((begin{array}{c}5 3end{array})) and ((begin{array}{c}5 4end{array})) type, respectively. Neither includes the RMII site samples, both include unburied, woodland and grassland samples, and in the case of the ({I}_{9}(begin{array}{c}5 4end{array})) also the RMI samples. These intersections therefore identify which compounds were removed from the RMI and RMII samples (78 formulae) and exclusively from the RMII samples (66 formulae), respectively. It is interesting to note that the ({I}_{24}(begin{array}{c}5 4end{array})) intersection that contained formulae exclusively removed from the RMI samples had only three entries. These observations further emphasize the unique makeup of the tea buried in the RMII site. From the point of view of new formulae in the RM samples, these appear in ({I}_{10}(begin{array}{c}5 1end{array})), ({I}_{15}(begin{array}{c}5 1end{array})) and ({I}_{12}(begin{array}{c}5 2end{array})) intersections, corresponding exclusively to RMI (57 formulae), RMII (23 formulae), and both RM samples (40 formulae), respectively. This is approximately 10 times less than the unique formulae detected in the woodland and grassland samples.
Molecular level analysis of the FT-ICR-MS data
The H/C and O/C ratios were determined for the individual molecular formulae obtained from the FT-ICR-MS data and these were inspected using van Krevelen diagrams. These are presented for the representative samples in Supplementary Fig. S31. At the same time, the molecular formulae were examined by calculating their double bond equivalent (DBE) and a modified aromaticity index (AImod)37. The results presented here focus on van Krevelen diagrams of selected intersections (Fig. 5) as identified by the UpSet plot; these intersections were also characterized by the oxygen class and mass distribution of their compounds (Supplementary Figs. S32 and S33).

Van Krevelen diagrams for selected intersections identified by the UpSet plot. (a) preserved in all, I2; (b) produced in all I7; (c) produced in grassland only, I4; (d) produced in woodland only, I6; (e) removed in all environments, I5; (f) produced in RMI or RMII (I10 + I12 + I15). Colour coding denotes the DBE. The lines represent aliphatics (above the dashed line), aromatics (between the dotted and the full line) and condensed aromatics (below the full line) based on the AImod index76. Letters denote the following compound classes, A: fatty acids/lipids, B: carbohydrates, C: glycosides, D: nucleic acids, E: polyphenols, F: lignin- like compounds, G: oxidised polyphenols, H: condensed aromatics.
Preserved in all environments (I2, 351 compounds)
Using the AImod index, the majority of these compounds (189, Mw 174–900 g/mol) can be classified as non-aromatic, followed by aromatic compounds (130, Mw 168–900 g/mol). Their mass distribution is centred between 200 and 600 g/mol, while their oxygen classes show a broad, skewed Gaussian distribution between O2 and O17 with a maximum at O12. The majority of molecular formulae identified in green tea by others are present in this intersection22,38,39,40. These include fatty acids, namely, oleic acid, palmitic acid, linolenic acid, linoleic acid, stearic acid, myristic acid38,39, while others are tentatively assigned to pentadecanoic acid and palmitoleic acid. The glycoside region contains molecules, such as rutin and kaempferol glycosides22,41. The molecular formula C12H22O11 represents many disaccharides, including sucrose and trehalose that were identified by NMR. All major catechins were identified, the most abundant being ECGC, however dimers and oxidative products, such as theaflavins, were also found. Removal of catechins in some samples, as detected by NMR, was therefore not complete. There is very little of condensed aromatics, all of which are low molecular weight compounds (12, Mw 162–302 g/mol).
Produced in all environments (I7, 103 compounds)
Only 103 (61 non-aromatic, 39 aromatic, 3 condensed aromatic) new compounds were detected in all soil environments. Their mass distribution was bimodal with maxima at 300 and 600 g/mol, respectively, while their oxygen class distribution peaked at O15. The non-aromatic molecules were a mix of fatty acids and glycosides with a few carbohydrates. Molecular formulae of theaflavins and theanapthoquinones42,43, oxidative products of the green tea typically found in the black tea, were identified.
Removed from all environments (I5, 222 compounds)
The majority of these compounds are non-aromatic (166, Mw 150–800 g/mol) falling into the glycoside area, followed by fatty acids, carbohydrates and condensed aromatics. Their mass distribution was Gaussian, centred at around 600 g/mol, showing a fairly even range of masses, while higher oxygen classes were more populated. Few tentative assignments were made, namely C5H10O5 which is likely arabinose and C15H18O9, which has been identified as caffeoyl-d-glucose. Many of the I5 molecular formulae are related to I2 formulae by a specific molecular unit such as oxygen, or isoprene units. Comparing the produced in all and removed from all sites, more glycosides were removed than were produced.
Produced only in grassland (I4, 294), only in woodland (I6, 220), and only in peatland (I10 + I12 + I15, 120 compounds)
The van Krevelen plots show a clear difference between molecules produced in grassland only (I4) and woodland only (I6), with grassland samples having more fatty acid compounds, while woodland samples contain more flavonoids/glycosides. In addition, more aromatic molecules were produced in the woodland (57 aromatic, 27 condensed) compared to the grassland (17 aromatic, 12 condensed) samples. The molecular weight distribution in the grassland samples shows mainly low Mw compounds (centred on 400 g/mol), while the woodland produced larger molecules (centred on 600 g/mol). The grassland compounds belong to low oxygen classes (centred on O6), while the woodland compounds have a broad distribution up to O20. A few amino acids (histidine and tryptophan) could be identified in the grassland samples only, while xanthines such as theophylline as well as certain theaflavin mono/digallates were found only in the woodland samples. The abundance of fatty acids in the grassland samples (also seen by NMR) is a striking feature.
Compared to the grassland and woodland, far fewer compounds were produced in the peatland, over 70% of which were found in the oxidised polyphenols and glycoside regions of the van Krevelen with a bimodal distribution in the oxygen classes centred on O7 and O16. A number of their formulae belong to large compounds, e.g. theasinensin digallate and its homologues.
The stress induced molecule, mannitol, was not found in these intersections; it only appeared in the I3 intersection, in agreement with NMR data.
Chemometric analysis of the FT-ICR-MS spectra of the HWE green tea samples
The PCA analysis of the FT-ICR-MS spectra using two principle components accounted for 68% of the total variance (53 and 16% by PC1 and PC2, respectively). The percentage of the total predicted variance was 62% (47 and 15% by PC1 and PC2, respectively). The MS PCA score plots (Fig. 6) indicate significant between-group variation with a tight, well-separated cluster of the unburied tea (two samples measured in triplicate confirming the reproducibility of the method).

PCA score plot from the (-) ESI FT-ICR-MS data. Each circle represents an individual HWE tea sample mass spectrum. (a) analysis of unburied tea, tea buried in grassland, woodland, RMI and RMII; (b) analysis of only buried tea samples. The legend indicates the colour coding for each sample site. The Hotelling’s T2 ellipse represents 95% confidence interval. Outlying RMI and RMII samples are marked with a single and double asterisks, respectively.
Grassland and woodland samples appeared close together in one area of the score plot, with more variation in the woodland sample set. Three RMI samples were located closer to the woodland samples, while the rest overlaid with the RMII samples. Only one RMII sample trended towards the RMI/woodland samples, while the rest clustered tightly in a separate area of the score plot.
The PCA analysis of the FT-ICR-MS spectra excluding the unburied tea samples using two principle components accounted for 72% of the total variance (60 and 12% by PC1 and PC2, respectively). The percentage of the total predicted variance was 65% (56 and 10% by PC1 and PC2, respectively). Removing the unburied tea samples from the analysis (Fig. 6b) preserved the features discussed above and accentuated within-group differences in the grassland and woodland samples, as seen by their spread along the PC2. This was not the case for the RM samples, which did not change their clustering pattern. This PCA score plot shows a significant “arch effect”, which may occur with multivariate methods where the data is projected onto low dimensions. This may reflect a single dominant gradient in the data and that the samples are highly structured according to PC1. Nevertheless, as discussed44 the arch effect is not necessary artefactual. Since the MS data show a similar ordination of samples as the NMR data, this is also likely the case here.
PCA loadings for the analysis with and without the unburied tea are shown in Supplementary Figs. S34–S36, respectively. The majority of the discriminating molecular formulae were assigned to the most likely compounds, considering those previously found in green tea18,19,20,22,30,40,42,45,46.
Based on well-separated PCA scores, PLS-DA was performed next. Similar to the analysis of NMR data, the PLS-DA of the MS data accentuated the within-group differences in the grassland and woodland samples, while it did not change the clustering pattern of the RM samples (Supplementary Fig. S37). The corresponding HCA dendrogram (Supplementary Fig. S38) mirrors the clustering of the PLS-DA score plots. The overlaid biplots singled out the molecular formulae/compounds that contributed most to the PLS-DA score plot definition. All were already identified as significant by the PCA and are highlighted in the figure legends of Supplementary Figs. S35 and S36.
The biplots (Supplementary Fig. S37) reflect higher concentrations of EGCG, ECG/CG, gallic acid and C24H20O15 in the RM samples, while trehalose was particularly elevated in the grassland samples. EGC/GC, C16H14O9, flavonols (such as myricetin), C30H26O13 (catechin dimers), epicatechin trimer procyanidin C1, as well as, polyphenol flavonoids (such as theasinensin B and C) were elevated in woodland and some RMI samples.
Source: Ecology - nature.com
