Whole-genome long-read sequencing of the Dsuz-WT3_v2.0 D. suzukii strain
The Dsuz-WT3_v2.0 D. suzukii individuals used to produce our genome assembly derived, after six additional generations of full-sib crossing, from the WT3 isofemale strain (here named Dsuz-WT3_v1.0) that was previously established from a female sampled in Watsonville (USA) and sequenced by9. The Dsuz-WT3_v2.0 strain hence went through a total of at least 16 rounds of full-sib crossing.
Genomic DNA extraction
High-molecular weight DNA was extracted from 40 adult D. suzukii females (Dsuz-WT3_v2.0) using the Blood & Cell culture DNA midi kit (Qiagen). The quality and concentration of the DNA was assessed using a 0.5% agarose gel (run for > 8 h at 25 V) and a Nanodrop spectrophotometer (ThermoFisherScientific). PacBio libraries were generated using the SMRTbell™ Template Prep Kit 1.0 according to manufacturer’s instructions. In brief, 10 µg of genomic DNA per library (estimated by Qubit assay) was sheared into 20 kb fragments using the Megaruptor system, followed by an exo VII treatment, DNA damage repair and end-repair before ligation of hair-pin adaptors to generate a SMRTbell™ library for circular consensus sequencing. The library was then subjected to exo treatment and PB AMPure bead wash procedures for clean-up before it was size selected with the BluePippin system (SAGE) with a cut-off value of 9,000 bp. In total 48 units of SMRTcell™ with library was sequenced on the PacBio Sequel instrument using the Sequel 2.0 polymerase and 600 min movie time. The raw data were then imported into the SMRT Analysis software suite (v2.3.0) where subreads shorter than 500 bp and a polymerase read quality below 75 were filtered out.
Genome assembly based on PacBio long reads
We generated two separate assemblies using two approaches: Falcon (https://github.com/PacificBiosciences/FALCON) using the parameters detailed in the Supplementary Text S1 and Canu 1.336 with the default options (except -minReadLength = 7,000 -stopOnReadQuality = 0 -minOverlapLength = 1,000).
The resulting Falcon assembly, hereafter called dsu_f, was 281 Mb long while the Canu assembly, hereafter called dsu_c, was 267 Mb long. We noticed that each assembly lacked different parts of the genome. For instance the gene Abd-B was absent from dsu_c and the gene Or7a was absent from dsu_f; see Supplementary Fig. S1 for more exhaustive BUSCO gene content statistics37. We therefore decided to follow a hybrid strategy (similarly to38) and merged these two assemblies. To that end we proceeded in three successive merging steps (following recommendations provided by Mahul Chakraborty’s) using: (i) the nucmer (with options -l 100) and delta-filter (with options -i 95 -r -q) programs from the MUMmer v3.23 package39 to perform alignment of assemblies on a whole genome scale, and (ii) the Quickmerge program38 (with options -hco 5.0 -c 1.5 -l 660,000 -ml 10,000) to merge assemblies based on their resulting alignment. In the first step, we aligned dsu_c (taken as reference) and dsu_f (taken as query) and obtained the dsu_fc merged assembly. In the second step, we aligned dsu_fc (taken as reference) and dsu_c (taken as query) and obtained the dsu_fc2 merged assembly. In the third and last step, we aligned dsu_fc2 (taken as reference) and dsu_f (taken as query) and obtained the dsu_fc2f merged assembly. We further added a polishing step to account for the high error rate in PacBio reads (above 10%40). This polishing step can be performed after the merging using PacBio reads if they are abundant enough38,41. We mapped back a subset of our PacBio raw data (to obtain 80X coverage) to the dsu_fc2f assembly using pbalign and corrected the assembly using quiver with default parameters (both programs obtained from the SMRT Portal 2.3; https://www.pacbiodevnet.com). The dsu_fc2f_p resulting assembly was ~ 286 Mb long and contained 669 contigs.
We finally sought to remove both exogeneous sequences (e.g., bacterial contaminant) and duplicated sequences resulting from the poor handling of diploidy by assemblers (although Falcon produces a partially diploid genome). We first used BUSCO v2 with the bacterial database (bacteria_odb9 containing 148 genes in 3,663 species) to identify contigs containing bacterial genes. Twenty-two contigs were removed from the assembly, most of them aligning onto the Acetobacter pasteurianus genome. Also, we manually retrieved five additional contigs mapping to Lactobacillus genome leading to a total of 27 bacterial contigs discarded (corresponding to ca. 3 Mb). We then used BUSCO v2 with the Diptera database (diptera_odb9 containing 3,295 genes in 25 species) to identify putative duplicated contigs and flagged the shortest one as redundant. To avoid removing valid contigs, we recovered the contigs that contained at least 10 predicted genes. To this end, we mapped possible ORFs (longer than 200 bp) using the NCBI tool ORFinder v0.4.0 (https://www.ncbi.nlm.nih.gov/orffinder/) that was run with default options. The identified ORFs were then aligned onto the assembly without the redundant contigs using BLAST 42, considering as significant hits with e-value < 10–4 and > 80% of identity. Using this procedure, we removed 69 contigs that had fewer than ten unique ORFs considering that they were likely alternative sequences and we split four contigs in two because the unique ORFs were all located at a contig end with the rest of the contig appearing duplicated. Also, the annotation of structural variants (see below) lead us to remove 27 additional contigs, flagged as translocations but that further scrutiny made us consider as alternative haplotypes. In total 96 redundant contigs plus 4 partial contigs (covering ca. 16 Mb) were removed from the main assembly and were added to the file already containing 457 alternative haplotyes assembled by Falcon, covering approximately 26 Mb and assembled together with dsu_f. In total, this resulted in an assembly of alternative haplotypes of ca. 42 Mb in total.
Only 16 Mb out of the 42 Mb of alternative sequences were assigned to a contig from the main assembly using BUSCO. In addition, this assignation did not provide precise positioning on the main assembly. We therefore decided to precisely map all alternative sequences to our main D. suzukii assembly using the methodology described in the section “Whole genome alignment with other assemblies” below. Aligned regions that varied in size more than two folds between the alternative sequence and the main assembly were filtered out. Following this procedure, we were able to assign 91% of the contigs to the main assembly, covering 97.5% of the alternative sequences (41 Mb/42 Mb).
The final assembly, hereafter called Dsuz-WT3_v2.0 consisted of 546 contigs for an overall size of 268 Mb. The contiguity of the assembly was measured using Quast 4.143 (run with default options) and its completeness was evaluated against the Diptera gene set with BUSCO v2 run with option -c 40.
Assessment of local assembly errors
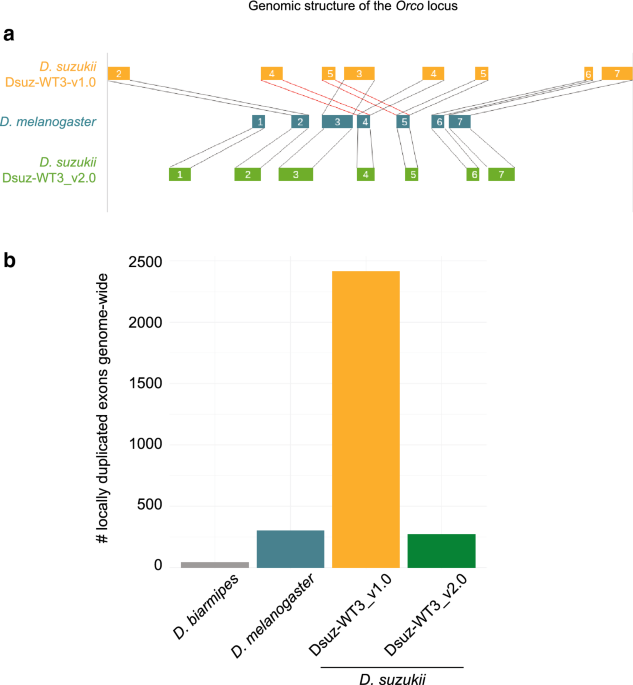
We used the following procedure to identify local genome assembly errors in the form of short (ca. 1 kb long) sequences duplicated in tandem. We used the genome assemblies of D. melanogaster dm6 (Genbank reference GCA_000001215.4), D. biarmipes Dbia_1.0 (GCA_000233415.1), the previous D. suzukii Dsuz-WT3_v1.0 assembly (GCA_000472105.1) and our assembly Dsuz-WT3_v2.0. We selected exons of an annotation that were within 5 kb of each other but did not overlap. We then blasted them against each other and selected hits that aligned on more than 50% of the shortest among the pair with an e-value below 10–10. For each couple of retained exons, a Needleman/Wunsch global alignment was made using the nw.align 0.3.1 python package (https://pypi.python.org/pypi/nwalign/) and a score was calculated with a NUC.4.4 matrix downloaded from the ncbi website. The score was normalized by the length of the sequence alignment and ranged from -2 (lowest similarity) to 5 (identical sequences).
Identification of autosomal and X-linked contigs using a female- to-male read mapping coverage ratio
To assign contigs of the new Dsuz-WT3_v2.0 assembly to either sex chromosomes or autosomes, we compared the sequencing coverage from whole genome short-read sequence data obtained for one female and one male individual13,44. Two DNA paired-end libraries with insert size of ca. 350 bp were prepared using the Illumina TruSeq Nano DNA Library Preparation Kit following manufacturer protocols on DNA extracted using the Genomic-tip 500/G kit (QIAGEN) for one female (mtp_f19) and one male (mtp_m19) sampled in Montpellier (France). Each individual library was further paired-end sequenced on the HiSeq 2,500 (Illumina, Inc.) with insert size of 125 bp. Base calling was performed with the RTA software (Illumina Inc.). The raw paired-end reads, available at the SRA repository under the SRR10260311 (for mtp_f19) and SRR10260312 (for mtp_m19) accessions, were then filtered using fastp 0.19.445 run with default options to remove contaminant adapter sequences and eliminate poor quality bases (i.e., with a Phred-quality score < 15). Read pairs with either one read with a proportion of low-quality bases over 40% or containing more than five N bases for either of the pairs were removed. After filtering, a total of 78,629,384 (9.379131 Gb with Q > 20) and 52,311,302 (6.342157 Gb with Q > 20) reads remained available for mtp_f and mtp_m respectively with an estimated duplication rate of 0.918% and 0.492%, respectively. Filtered reads were then mapped onto the Dsuz-WT3_v2.0 assembly using default options of the MEM program from the BWA 0.7.17 software46,47,48. Read alignments with a mapping quality Phred-score < 20 or PCR duplicates were removed using the view (option -q 20) and markdup programs from the SAMtools 1.9 software46, respectively. The resulting total number of mapped reads for mtp_f19 and mtp_m19 was 42,304,522 and 33,301,631 reads with a proportion of properly paired reads of 96.6% and 98.0% respectively.
Sequence coverage at each contig position for each individual sequence was then computed jointly using the default options of the depth program from SAMtools 1.9. To limit redundancy, only one count every 100 successive positions was retained for further analysis and highly covered positions (> 99.9th percentile of individual coverage) were discarded. The overall estimated median coverage was 18 and 21 for mtp_f19 and mtp_m19, respectively.
To identify autosomal and X-linked contigs, we used the ratio ρ of the relative (median) read coverage of contigs between mtp_f19 and mtp_m19 (weighted by their corresponding overall genome coverage). The ratio ρ is expected to equal 1 for autosomal contigs and 2 for X-linked contigs13,44. Note that the inclusion of X-linked positions in the overall estimated male genome coverage to compute the weights in the estimation of ρ result in a downward bias (the higher the actual length of the X-chromosome, the higher the bias). As a matter of expedience, 226 contigs (out of 546) with a coverage lower than 5X (resp. 2X) in mtp_m19 (resp. mtp_f19) or with less than 100 analyzed positions (i.e., < 10 kb) were discarded from further analyses. Conversely, four additional contigs (namely #234, #373, #668 and #638 of length 132 kb, 51 kb, 13 kb and 21 kb respectively) were discarded because they showed outlying coverages (i.e., > Q3 + 1.5(Q3-Q1), where Q1 and Q3 represents respectively the 25% and 75% quantiles of the observed contig coverage distribution) in either mtp_f19 or mtp_m19. The cumulated length of the 316 remaining contigs was 256.1 Mb. Only 11.9 Mb of the Dsuz-WT3_v2.0 assembly were hence discarded. We then fitted a Gaussian mixture model to the estimated ρ distribution of these 316 contigs, with two classes of unknown means and the same unknown variance. The latter parameters were estimated using the Expectation–Maximization algorithm implemented in the mixtools R package49. As expected, the estimated mean of the two classes µ1 = 0.93 and µ2 = 1.90 were slightly lower than that expected for autosomal and X-linked sequences. Our statistical treatment allowed the classification of 296 contigs (223.7 Mb) as autosomal and 13 contigs (31.7 Mb in total) as X-linked with a high confidence (p-value < 0.01), only ca. 12.6 Mb being left unassigned (see Supplementary Table S3 for a complete list of contig-chromosome associations).
Genome annotation for repetitive elements, structural variants and coding sequences
The repertoires of repetitive elements was assessed for the following species and genome assemblies: D. melanogaster dm6 (Genbank reference GCA_000001215.4), D. suzukii Dsuz-WT3_v2.0, D. biarmipes Dbia_1.0 (GCA_000233415.1), D. takahashi Dtak_2.0 (GCA_000224235.2), D. yakuba dyak_caf1 (GCA_000005975.1), D. ananassae dana_caf1 (GCA_000005115.1), D. persimilis dper_caf1 (GCA_000005195.1) and D. grimshawi Dgri_caf1 (GCA_000005155.1). We used the following procedure for each species separately: initial sets of repetitive elements were obtained using RepeatMasker open-4.0.6 (Smit et al., 2013–2015) with default parameters and the large Drosophila repertoire of all classes of repetitive elements from the Repbase database50,51. The number of bases covered by each type of repetitive element was then computed on the repertoire. The set of complete elements was obtained using the output of the programs RepeatMasker and OneCodeToFindThemAll52, from which the number of bases covered by each type of repetitive elements was extracted.
To detect structural variants, we aligned our filtered PacBio reads against our Dsuz-WT3_v2.0 assembly using NGMLR v0.2.653 with the parameter “-i 0.8”. We then used Sniffles v1.0.753 to detect structural variants with the parameter “-s 20 –l 500”. We detected 53 translocations, 59 insertions, 219 deletions, 8 inversions and 60 duplications. During this process, 27 contigs associated with 30 translocations were labelled as alternative sequences upon manual inspection and both the contigs and the associated translocations were hence removed from the main assembly (see section “Genome assembly based on PacBio long reads”).
To annotate protein coding genes, we used sequence-based gene prediction as well as cDNA evidence. RNA was extracted from antennae, ovipositors, proboscis + maxillary palps and tarsi of WT3_1.0 adults females and from pupal ovipositors (collected at 6 h, 24 h and 48 h after puparium formation) using Trizol (Invitrogen) according to manufacturer’s instructions. In total, 8 libraries were prepared using the Truseq stranded kit (Illumina) according to the manufacturer’s instructions, and were sequenced on a Hiseq2500.
We used Maker v2.31.854 to annotate the genome. SNAP55 and AUGUSTUS v3.2.256 with the parameter “augustus_species = fly » were used for ab initio predictions. cDNA evidence was provided from Trinity v2.3.257 and hisat v2.0.458 plus stringtie v 1.2.4 runs59 on the RNAseq data on pupae and the different tissues of female adults. We used the D. melanogaster proteome as protein homology evidence. The repeatmasker parameter was set to “Drosophila” and a general set of 24,916 transposable element proteins was provided. SNAP was trained with two initial runs: the first run used the homology and cDNA evidence (est2genome and protein2genome were set to 1) and the second run used the SNAP HMM file produced after the first maker run. The final maker run combined all the evidence, trained SNAP parameters as well as AUGUSTUS. In order to correct the flawed tendency of assemblers to fuse two neighboring genes together60, we added the following step. A D. suzukii gene was called a “false chimeric” if it could be cut into two parts that each aligned by BLAST to two neighboring genes in D. melanogaster. Based on this criterion, 1,052 genes were identified as chimers and split in two at the position that mimicked the gene limits in D. melanogaster. This method is conservative as it implies that gene structure is conserved between species. This assumption is reasonable owing to the evolution of genes and genomes on the Drosophila phylogeny and was validated by a manual review of modified genes61.
Whole genome alignment with other assemblies
The genome sequences of our D. suzukii assembly Dsuz-WT3_v2.0, the previous D. suzukii Dsuz-WT3_v1.0 assembly (GCA_000472105.1), the D. biarmipes Dbia_1.0 assembly (GCA_000233415.1) and the D. melanogaster dm6 assembly (Genbank reference GCA_000001215.4) were aligned as previously described62. Briefly, we followed the general guideline described in63: we used a large-scale orthology mapping created by Mercator64 with the option to identify syntenic regions of the genomes. Each region was then aligned with Pecan65 with default parameters. This genome assembly was used to assign a chromosome to the different contigs of Dsuz-WT3_v1.0 and Dsuz-WT3_v2.0 and to map the nearly identical neighboring exons in Dsuz-WT3_v1.09 to Dsuz-WT3_v2.0.
To visualize synteny blocks between the 20 longest contigs of the D. suzukii assembly and D. melanogaster chromosomes, we proceeded as follow. We first ran BLASTP between the protein anchors of D. melanogaster and D. suzukii produced during genome alignment with the parameters “-e 1e-10 -b 1 -v 1 -m 8”. We then ran MCScanX66 on the BLASTP output using default parameters. Synteny plots (Fig. 2) were obtained using VGSC67 on the MCScanX output. The results were fully consistent between this method and the genome alignment described above.
Estimating nucleotide diversity in the original WT3 strain, the Dsuz-WT3_v2.0 strain and their populations of origins
We relied on Pool-seq short-read whole-genome shotgun sequencing data (WGS) to estimate nucleotide diversity in the original WT3 strain9 (here referred to as Dsuz-WT3_v1.0), the newly generated Dsuz-WT3_v2.0 strain and three wild populations sampled in Watsonville—USA (US-Wat), Hawaii—USA (US-Haw); and Ningbo—China (CN-Nin). These choices were motivated by the fact that the female initially used to establish the WT3 strain originates from the Watsonville population (Chiu et al., 2013) and that the later population has recently been shown to be of admixed origin between Hawaii and Eastern China (Ningbo) populations24. For the original WT3 strain (Dsuz-WT3_v1.0), WGS data of a pool of tens of females (Chiu, personal communication) used to build the previous genome assembly by9 was downloaded from the SRA under the accession SRR942805. These Pool-seq data were obtained after sequencing of a DNA paired-end (PE) library with insert size of 250 bp on a HiSeq2000 (Illumina, Inc.) sequencers at approximately 40X coverage (see Supplementary Table S1 in9). For the Dsuz-WT3_v2.0 strain, a pool of 26 individual genomes (13 males and 13 females) was sequenced on a HiSeqX sequencer (Macrogen Inc., Seoul, South Korea) targeting a coverage > 30X. The raw paired-end sequences (2 × 150) were made available from the SRA repository under the SRR10260310 accession. Finally, for the US-Wat, the US-Haw and the CN-Nin populations, we relied on the Pool-seq data recently produced by68 from samples of 50 individuals (including 4, 25 and 36 females, respectively) and available from the SRA under the SRR10260026, SRR10260031 and SRR10260027 accessions respectively. The three data sets consisted of 2 × 125 bp PE sequences obtained from a HiSeq 2500 sequencer. Processing and mapping of reads was carried out as described above for the mtp_f19 and mtp_m19 individual WGS. The resulting overall mean coverages were 29.8X, 34.5X, 52.7X, 51.7X and 71.8X for Dsuz-WT3_v1.0, Dsuz-WT3_v2.0, US-Wat, CN-Nin and US-Haw, respectively.
Nucleotide diversity (θ = 4Neµ) was then estimated for non-overlapping 10 kb windows across the genome using the extension of the Watterson estimator69 for Pool-Seq data developed by Ferretti et al. (2013) and implemented in the npstats software. Only positions covered by at least four reads and less than 250 reads with a min quality > 20 were considered in the computations (-mincov 4 -maxcov 250 -minqual 20 options) and windows with less than 9,000 remaining positions were discarded. As a matter of expedience, the haploid pool sample size was set to 50 individuals for the Dsuz-WT3_v1.0 strain. We found, however, that alternative values of 10, 20 or 100 individuals resulted in highly consistent estimates.
Estimating the local ancestry composition of the assembly using an HMM painting model
Because of the admixed origin of the Watsonville population from which the Dsuz-WT3_v1.0 and Dsuz-WT3_v2.0 strains originate, we expected the assembly to be a mosaic of chromosomal segments of ancestral individuals originating from Hawaii (US-Haw) and Eastern China (CN-Nin), its two source populations (Fraimout et al. 2017). To characterize this mosaic, we first called polymorphic sites in the US-Haw and CN-Nin populations. To that end, the US-Haw and CN-Nin Pool-seq BAM files (see above) were processed using the mpileup program from SAMtools 1.9 with default options and -d 5,000 and -q 20. Variant calling was then performed on the resulting mpileup file using VarScan mpileup2cns v2.3.470 with options –min-coverage 50; –min-avg-qual 20 and –min-var-freq 0.001 –variants –output-vcf. The resulting VCF file was processed with the vcf2pooldata function from the R package poolfstats v1.171 retaining only bi-allelic SNPs covered by > 20 and < 250 reads in each of the two sample. For each SNP, we then estimated the frequency of the reference allele (i.e., the one of the assembly) in each population using a Laplace estimator (see Supplementary Text S2). We only retained SNPs displaying an absolute difference in the reference allele frequencies above 0.2 between the two US-Haw and CN-Nin samples (i.e. the most ancestry informative SNPs). This resulted in a total of 2,643,102 autosomal and 540,277 X-linked SNPs.
We further developed a one-order Hidden Markov Model (HMM) to model the assembly as a mosaic of chromosomal segments from either Chinese (“C”) or Hawaiian (“H”) ancestry. This HMM allowed estimation of the local ancestry origin of each reference allele of the assembly based on its estimated frequencies in the CN-Nin and US-Haw samples used as proxies for the “C” and “H” ancestral populations respectively. The model and the parameter estimation method are detailed in Supplementary Text S2.
Source: Ecology - nature.com
