Observing micro-structures and hemolymph flow in wings
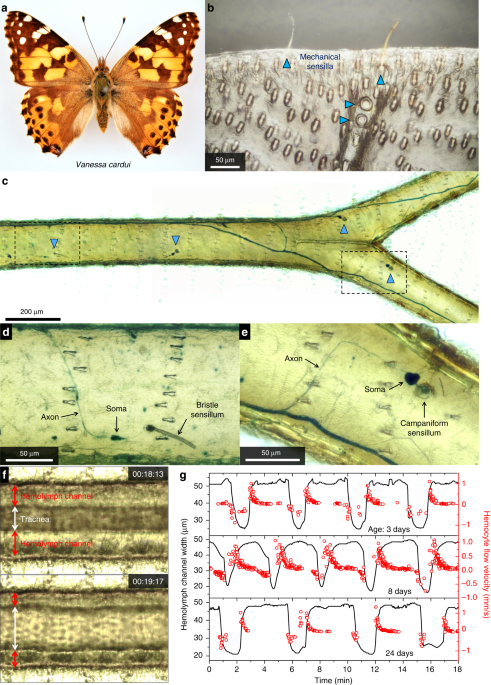
Vanessa cardui, Satyrium caryaevorus, and Parrhasius m-album butterflies were anesthetized with CO2 and scales were carefully removed from both sides of the wings with a paintbrush. Each specimen was then secured using a low melting temperature wax to two microscope slides, one on either side of the body (Supplementary Fig. 4a). Photos and videos were taken with a microscope equipped with a CCD camera. The direction and speed of hemolymph flow (Figs. 1g, 2b, d, e and Supplementary Fig. 5c) were inferred from the movement of semitransparent cells (hemocytes) inside the hemolymph channels and scent pads (Supplementary Movies 3–7). Stacking photography was sometimes used to better resolve fine structures within the wings (Figs. 1b–e, 2b, d and Supplementary Figs. 1–3, 5, 10–17).
Methylene blue, a dye that has been widely used to stain nervous tissues40,42 including the neurons of Lepidoptera41, was used to stain the neurons in wing veins. Adult V. cardui and S. caryaevorus butterflies were anesthetized. A saturated aqueous solution of methylene blue (Aldon Corporation) was injected into the thoraces: 50–100 µl for individual V. cardui and 10 µl for individual S. caryaevorus. The stained wings were removed 6 h after injection, when the butterflies had recovered from anesthesia and the injected stain had been circulated by the hemolymph into the wing veins. The scales were removed from both sides of the wings and stacking photography was used to take pictures of stained tissues.
Infrared hyperspectral imaging of butterfly wings
The infrared optical properties of butterfly wings were measured using a hyperspectral imaging technique. To measure the transmissivity distribution, the wing was secured by two pairs of thin threads and then raster scanned under an infrared microscope (Bruker Hyperion 2000), with one transmission spectrum taken at each position. The raster scan generated a three-dimensional (x, y, λ) optical transmission hyperspectral data cube, where λ includes 1763 wavelengths ranging from 2.5 to 16.7 μm and the step of scan is Δx = Δy = 90 μm (comparable to the sizes of individual wing scales). Similarly, an optical reflection hyperspectral data cube was generated by collecting spectra of reflected infrared light at all (x, y) positions over the butterfly wing. An emissivity hyperspectral data cube was then created by calculating the absorption spectrum at each position using 1 – transmissivity – reflectivity, as Kirchhoff’s law of thermal radiation states that radiative emission and absorption are reciprocal processes, and thus emissivity equals absorptivity64. The hyperspectral data cubes (simplified version of the data cube for B. biston shown in Fig. 4e, Supplementary Fig. 36b, those of other species in Supplementary Figs. 18–31) enable us to visualize butterfly wings at different infrared wavelengths. Features that are not discernible to the naked eye stand out, and these features are not always correlated with visible patterns of butterfly wings. The hyperspectral data cubes were used to derive the temperature distribution on the butterfly wings.
Infrared properties of chitin used in full-wave simulations
The membranes and scales of butterfly wings are mainly composed of the long-chain polymer chitin (C8H13O5N)n, which is the primary component of the exoskeletons of arthropods, including some crustaceans (such as crabs and shrimps) and insects66. The optical properties of chitin have not been studied thoroughly due to the difficulty in the production of optical-grade materials and its various derivatives depending on the sources. An average refractive index of 1.56 has been used in many publications and previous studies reported the dispersive complex refractive indices of shrimp chitin samples only in the UV and visible spectral range (λ = 250–750 nm)67,68. Here, the dispersive complex refractive indices of chitin composing the butterfly wings in the mid-infrared range (λ = 2.5–20 μm) were derived from measured spectra and applied in full-wave simulations to investigate the interactions between mid-infrared light and nanostructured wing scales.
The chemical composition and molecular structure of chitin have been identified using various methods including infrared spectroscopy and X-ray diffraction69,70. Thirteen resonance frequencies in the mid-infrared spectral range corresponding to the major vibrational and rotational bands of chitin molecules have been characterized (Supplementary Table 2) and applied in the Lorentz oscillator model71,
$$frac{{varepsilon left( omega right)}}{{varepsilon _0}} = , 1 + mathop {sum }limits_m left[ {varepsilon _rleft( {omega _{{{0,m}}},omega _{{{p,m}}},gamma _{{m}}} right) + ivarepsilon _ileft( {omega _{{{0,m}}},omega _{{{p,m}}},gamma _{{m}}} right)} right] = , 1 + mathop {sum }limits_m left[ {frac{{omega _{{{p,m}}}^2left( {omega _{{{0,m}}}^2 , – , omega ^2} right)}}{{left( {omega _{{{0,m}}}^2 , – , omega ^2} right)^2 + omega ^2gamma _{{m}}^2}} + ifrac{{omega _{{{p,m}}}^2gamma _{{m}}omega }}{{left( {omega _{{{0,m}}}^2 , – , omega ^2} right)^2 , + , omega ^2gamma _{{m}}^2}}} right],$$
(1)
to calculate the complex refractive indices (n_cleft( omega right) = nleft( omega right) + ikleft( omega right) = sqrt {varepsilon left( omega right)}), which were then used in the transfer matrix method to calculate the absorption spectrum of a thin film of chitin. In Eq. (1), m labels the various vibrational and rotational bands of chitin, ε0 = 8.854 × 10⁻¹² C2 N−1 m−2 is the permittivity of free space, and ω0,m is the mth resonance frequency. The values of plasma frequency, ωp,m, and collision frequency, γm, were simultaneously tuned to obtain the best fit between the calculated absorption spectrum and a measured spectrum from a piece of butterfly wing membrane with scales carefully removed, which can be considered as a relatively flat slab with a uniform thickness. The absorption spectrum of the scale-less wing membrane was measured using a Fourier transform infrared spectrometer and its thickness was determined using a scanning electron microscope. The obtained complex refractive indices of chitin were used in full-wave simulations to investigate the interactions between infrared light and micro-structures of wing scales (Fig. 4h, i).
Experimental setup simulating natural radiative environment
A butterfly wing absorbs sunlight and exchanges energy via thermal radiation with the ambient environment, including the terrestrial environment beneath the wing and the sky above (Fig. 3). The radiative energy loss from the heated wing to the cold sky represents a major channel of heat dissipation in addition to heat losses via convection.
In the thermodynamic experimental setup (Supplementary Fig. 33), the light produced by a Xenon lamp shining from above at a distance of about half a meter was used to simulate sunlight. The lamp occupied only a small solid angle in the top hemisphere. The lab space over the top hemisphere was maintained at Ta = 25 °C to simulate the terrestrial environment. A temperature controllable cryostat equipped with an infrared-transparent window underneath the wing specimen was used to simulate the sky in different weather conditions.
The cryostat consists of a vacuum cryostat chamber, a cooled plate located at the center of the chamber, and a potassium bromide (KBr) window. The cooled plate is in contact with a liquid-nitrogen-cooled cold finger and its temperature can be controlled within 0.01 °C of a set temperature by using a Lake Shore cryogenic temperature controller. The top surface of the cooled plate that faces the window is coated with a thick layer of paint and has a near-unity mid-infrared emissivity. The KBr window, 1.5 inches in diameter, has a transmissivity >90% over a broad mid-infrared spectral range (λ = 2.5–20 μm). The negligible reflectivity of the window minimizes reflections within the window and between the window and the wing specimen. The inner surface of the cryostat chamber, which is at ambient temperature, is an aluminum oxide layer and has thermal emissivity approaching unity. The combination of the KBr window and the cooled plate can be treated as a planar substrate with a finite size, a controlled temperature, and a thermal emissivity of ~1. Wing specimens are placed outside of the cryostat chamber a few millimeters above the KBr window in still air (i.e., free convection) at the ambient temperature. The solid angle subtended by the cooled plate with respect to the wing specimen has a half angle of θc = 25.3°.
Calculations indicate that the total amount of thermal radiation generated by the cryostat setup ranges from 289 to 415 W/cm2, when the temperature of the cooled plate is tuned from Tc = −40 to +20 °C (Supplementary Fig. 35c). This range of thermal radiance matches with field data measured using a pyrgeometer72 and with downward atmospheric thermal radiance calculated using theoretical models (i.e., the Swinbank model73 and the RRTM model74) (Supplementary Fig. 35a, b), and thus effectively simulates the wide variety of environmental conditions that butterflies experience.
Deriving wing temperatures from thermal camera images
A noninvasive technique based on the results of infrared hyperspectral imaging was developed to map temperature distributions on butterfly wings. The infrared flux detected by the thermal camera (FLIR SC660) (examples for B. biston shown in Supplementary Fig. 36a) has three contributions (Supplementary Fig. 33c):
$$Phi _{{mathrm{cam}}} = Phi _w + Phi _t + Phi _r,$$
(2)
where Φw is the thermal radiation produced by the wing, Φt is the thermal radiation produced by the cryostat and transmitted through the wing, and Φr is the thermal radiation produced by the surrounding environment and reflected by the wing:
$$Phi _{mathrm{w}}left( {T_{mathrm{w}}} right) = 2pi int_0^{theta_{mathrm{lens}}} {dtheta {mathrm{sin}}theta {mathrm{cos}}theta } int_{lambda_{mathrm{cam}}} {dlambda left[ {varepsilon _{mathrm{w}}(lambda ,theta )frac{{2hc^2}}{{lambda ^5}} , frac{1}{{exp left( {hc/lambda k_{mathrm{B}}T_{mathrm{w}}} right) – 1}}} right],}$$
(3)
$$Phi _tleft( {T_{mathrm{c}}} right) = 2pi int_0^{theta_{mathrm{lens}}} {dtheta {mathrm{sin}}theta {mathrm{cos}}theta } int_{lambda_{mathrm{cam}}} {dlambda left[ {t_{mathrm{w}}(lambda ,theta )frac{{2hc^2}}{{lambda ^5}} , frac{1}{{exp left( {hc/lambda k_{mathrm{B}}T_{mathrm{c}}} right) – 1}}} right],}$$
(4)
$$Phi _rleft( {T_a} right) = 2pi int_0^{theta_{mathrm{lens}}} {dtheta {mathrm{sin}}theta {mathrm{cos}}theta } int_{lambda_{mathrm{cam}}} {dlambda left[ {r_{mathrm{w}}(lambda ,theta )frac{{2hc^2}}{{lambda ^5}} , frac{1}{{exp left( {hc/lambda k_{mathrm{B}}T_{mathrm{a}}} right) – 1}}} right].}$$
(5)
The sum of these three terms equals the radiance received by the camera:
$$Phi _{{mathrm{cam}}}left( {T_{mathrm{cam}}} right) = 2pi int_0^{theta_{mathrm{lens}}} {dtheta {mathrm{sin}}theta {mathrm{cos}}theta } int_{lambda_{mathrm{cam}}} {dlambda left[ {frac{{2hc^2}}{{lambda ^5}} , frac{1}{{exp left( {hc/lambda k_{mathrm{B}}T_{mathrm{cam}}} right) – 1}}} right].}$$
(6)
Here εw(λ, θ), tw(λ, θ), and rw(λ, θ) are, respectively, angle and wavelength dependent emissivity, transmissivity, and reflectivity; θlens = 12.5o represents the half viewing angle of the thermal camera lens; h is the Planck constant; c is the vacuum speed of light; kB is the Boltzmann constant; Tw is the temperature of the wing to be determined, Tc is the cryostat temperature, Ta is the ambient temperature, and Tcam is the temperature directly read from the thermal camera; the integration is carried over the wavelength range of λcam = 7 –14 μm, which is the transmission window of the internal filter of the thermal camera. Note that the cosθ term indicates that emission of thermal radiation follows Lambert’s cosine law.
A case study of the forewing of a Bistonina biston butterfly has shown that the angle dependence of εw(λ, θ), tw(λ, θ), and rw(λ, θ) is weak within the viewing angle of the thermal camera lens (i.e., 25°) (Supplementary Fig. 37b); therefore, the values of εw(λ, θ), tw(λ, θ), and rw(λ, θ) measured at surface normal direction were used in the above equations to determine the wing temperature, Tw. This simplification only leads to an overestimation of the wing temperature by less than 1.2 °C (Supplementary Table 3). With the hyperspectral data of the butterfly wing (i.e., spatial distribution of εw(λ), tw(λ), and rw(λ) over the entire wing area), the temperature distribution over the whole butterfly wing can be determined (Fig. 5 and Supplementary Fig. 36).
It is important to note that the second and third terms in Eq. (2) do not contain information about butterfly wing temperatures, but can still make substantial contributions to the detected signal by the thermal camera. In particular, Φt is proportional to the transmissivity of the wing, tw, which can have large values for the parts of the wing that are physically thin and not covered by specialized scales like those found on the scent patches. For example, tw is ~0.8 around λ = 11 μm and tw averaged over the entire spectral window of the thermal camera (i.e., λ = 7–14 μm) is ~0.7 for the membranous (non-vein) blue and black regions of the B. biston forewing. In other words, butterfly wings can be fairly transparent in the thermal radiation spectrum, and direct temperature readings from the thermal camera, Tcam, can be highly misleading and inaccurate. For example, what the thermal camera detects from the membranous blue and black regions of the B. biston forewing has comparable contributions from Φt and Φw; thus, it would report the effective temperature of a superposition of the warm wing and the cold cryostat behind the wing: Tcam would be somewhere between Tc and Tw, and considerably smaller than Tw in the case of Tc = −40 °C (mimicking clear sky with low humidity). However, Tcam of the regions of the wing with high thermal emissivity (i.e., veins, scent patches, and pads) is much closer to the actual wing temperature, because these regions have low infrared transmissivity (transmissivity ≅ 1 − absorptivity = 1 − emissivity) and thus the contribution of the cryostat behind the wing to the detected radiance by the thermal camera is small.
While Φt can be comparable to Φw, Φr is typically one order of magnitude smaller than either Φt or Φw, because Φr is proportional to the infrared reflectivity of the wing, rw, which is only a few percent over the entire wing (Supplementary Fig. 36b). Nevertheless, including Φr into Eq. (2) enables more accurate determination of Tw.
Displacement in response to local heating of butterfly wing
In the experiment (Fig. 6), an intact adult butterfly was placed in an arena where it could walk freely. The lid of the container was composed of a thin polyethylene membrane that is transparent to mid-infrared radiation (to facilitate observation using a thermal camera). Once the butterfly was standing still in the container while its wings and body reached thermal equilibrium with the ambient environment, a collimated laser beam (either a telecom laser at λ = 1.55 μm or a supercontinuum laser with broadband emission at λ = 0.4–1.7 μm) was then directed onto either its left or right wing (haphazardly chosen) with normal incidence to increase the wing temperature locally. The beam diameter was adjusted to cover a segment of a wing vein 2–5 mm in length, and the beam was typically pointed at the junction of the radial veins of the forewing.
As the temperature of the region illuminated by the laser beam increased to a threshold value, the butterfly would move to avoid the beam, and this response was scored as a displacement event (Supplementary Movies 8, 9). The temperature at which this occurred was recorded as the threshold temperature, Ttrigger. The laser power was controlled such that the temperature increased from 25 to 45 °C in 7–8 s. The rate at which the temperature increased was chosen to prevent over-stimulation that could either startle butterflies into flight or cause irreversible damage to the sensory neurons in their wings.
A thermal camera was used to record videos of the response, from which Ttrigger was determined. Wing veins have thermal emissivity close to unity, so direct readings from the thermal camera were used as the accurate temperature of the wing vein. Similarly, we used the thermal camera to record temperatures during basking both in the field and lab, again taking advantage of the fact that both the thorax and the wing veins have thermal emissivity approaching unity.
Different butterfly species move their wings in characteristic ways to avoid thermal stimuli applied to the wings. For example, butterflies in the family Papilionidae with wings opened initially at rest tend to flap their wings, and butterflies in the family Lycaenidae with wings closed initially at rest tend to walk forward or turn around to avoid the laser spot (Supplementary Movie 8). Once the movement of the butterfly was observed, we blocked the laser beam immediately to prevent further increase of the wing temperature and possible damage caused by overheating.
Care was taken to ensure that the response was solely due to the temperature of the illuminated wing region exceeding a threshold value. Specifically, the laser spot was never positioned on wing regions close to the base of the wing, which is also close to the insect’s eyes. Movement and lighting changes in the surrounding environment were minimized to prevent accidentally stimulating the butterfly during the experiment. Control experiments were conducted that indicated butterflies may not be able to see or perceive the laser spot on their wings during the laser-spot heating experiments (Supplementary Fig. 43).
Basking experiment
In the experiment (Fig. 7), a dark-adapted adult butterfly was placed in an arena with a thermally transparent window. The temperature of the arena was controlled by a Peltier thermoelectric cooler. A Xenon lamp, which simulates sunlight, illuminated the substrate of the arena uniformly from above with an angle of ~15o to the vertical.
All the species used in this experiment perform “lateral basking”24,25: when the lamp was turned on, the butterflies closed their wings and tilted sideways to expose their thoraces and ventral wing surfaces to the illumination. The beginning of a lateral basking event was scored when the wings were tilted to be approximately perpendicular to the direction of illumination. The cessation of basking was scored when the butterflies restored the vertical orientation of the wings. The basking events were recorded simultaneously by a visible camera and a thermal camera. The wing and thoracic temperatures were extracted directly from the thermal camera readings at the wing veins and thoraces, respectively, taking advantage of the fact that both the thoraces and wing veins have thermal emissivity approaching unity.
We have complied with all relevant ethical regulations for animal testing and research.
Reporting summary
Further information on research design is available in the Nature Research Reporting Summary linked to this article.
Source: Ecology - nature.com
