Phylogenetic analysis of North Sea Polaribacter spp
Phylogenetic analysis of Polaribacter 16S rRNA clone sequences from 2009 to 2010 spring blooms revealed affiliation with four distinct clusters (Supplementary Fig. S1). Three clusters comprised clone sequences from April 14th, 2009, indicating a large diversity of Polaribacter species during the 2009 bloom. In contrast, clone sequences obtained on April 8th, 2010 fell into a single cluster, demonstrating presence of a distinct Polaribacter clade during the early phase of the 2010 bloom. The cultivated North Sea Polaribacter strains KT15, KT25b, and Hel1_88 branched in a separate cluster together with many other validly described species. Mean sequence similarities between these North Sea Polaribacter clades ranged from 96.7 to 98.4% (Supplementary Table S11), corroborating that they represent distinct species [50].
Classification of Polaribacter MAGs
We obtained 41 Polaribacter-related MAGs (Supplementary Table S4) via binning of 38 metagenomes sampled from 2010 to 2012 bloom events (Supplementary Table S3) [15]. Phylogenetic survey of 43 conserved marker genes and ANI comparisons of the Polaribacter MAGs together with seven genomes of cultivated North Sea Polaribacter strains revealed affiliation with six distinct clades (henceforth termed Polaribacter 1-a, 1-b, 2-a, 2-b, 3-a, and 3-b) (Fig. 1). The Polaribacter 3-a clade also included the three sequenced North Sea strains Hel1_33_49, Hel1_33_78, and Hel1_33_96 [18, 43]. The overall tree topology was similar to the one inferred by 16S rRNA gene analysis (Supplementary Fig. S1). ANI values between these six clades were <95% (Supplementary Fig. S2), suggesting that they represent distinct species [51]. ANI values within the clades ranged from ~95 to 100% indicating some intraclade heterogeneity, apart from the clades Polaribacter 2-a and 2-b, which were seemingly homogeneous with ANI values around 99% (Supplementary Fig. S2). For further analysis, we selected the most complete and least contaminated MAGs with ANI >99% from clades 1-a, 1-b, 2-a, 2-b, and 3-b whereas for clade 3-a we used the genomes of strains Hel1_33_49, He1_33_78, and Hel1_33_96 (Fig. 2).
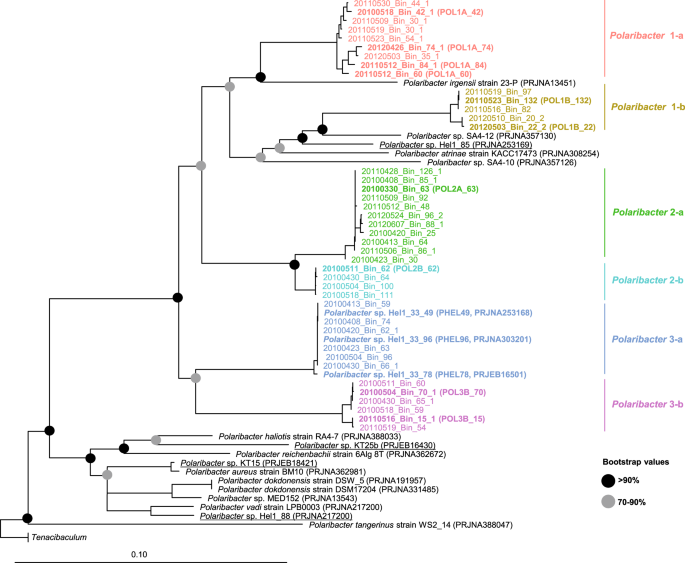
The names and abbreviations of Polaribacter MAGs that were used in further analyses are depicted in bold. For Polaribacter genomes, the corresponding NCBI, BioProject numbers are shown in brackets. The range of bootstrap values is indicated with black and gray circles. Bar: 0.1 substitutions per nucleotide position. Tenacibaculum spp. were used as outgroup.
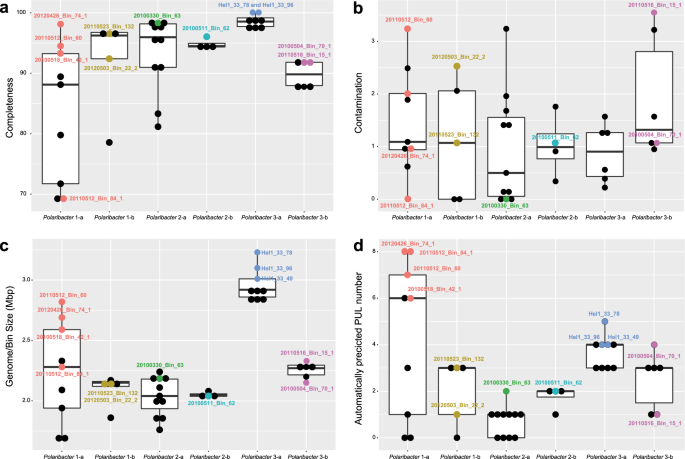
PULs were automatically predicted as it has been described in [15]. The MAGs that were considered for further analyses are labeled. The values for other MAGs are shown in Supplementary Table 4.
Polaribacter in situ abundances
In situ abundances of the six Polaribacter clades during 2009–2012 North Sea spring blooms were assessed together with the phytoplankton community composition [13]. We (i) used CARD-FISH with newly designed oligonucleotide probes (Supplementary Table S1, Fig. 3b), (ii) reassessed previously published MED analyses of 16S rRNA amplicon data (Fig. 3c), and (iii) performed metagenome read recruitments on Polaribacter MAGs and genomes (Supplementary Table S6, Fig. 3d). CARD-FISH using specific oligonucleotide probes (coverage >82%, outgroup hits <15, Supplementary Table S1) provided cell numbers for individual Polaribacter clades (Supplementary Table S2). Comparison of these cell abundances with read frequencies detected by tag and metagenome sequencing enabled us to assess the temporal dynamics of Polaribacter clades with different methods.
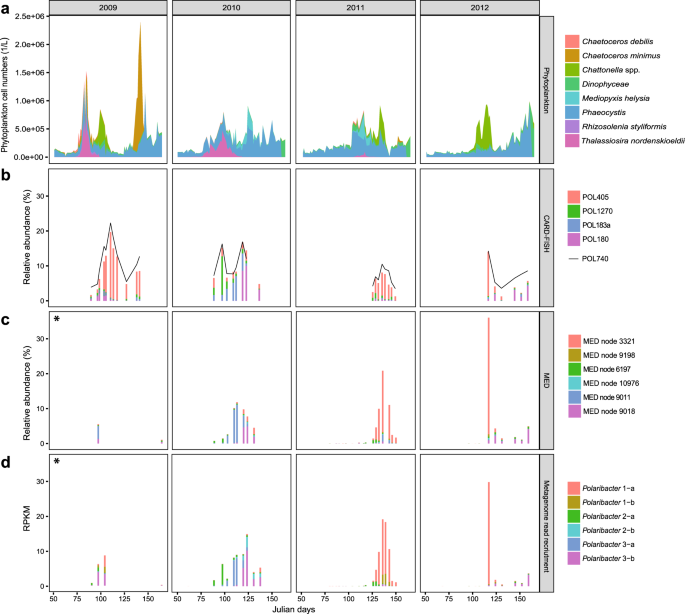
a Cell counts of eight dominant phytoplankton clades as reported in [13]. b CARD-FISH analysis using newly designed oligonucleotide probes targeting four major Polaribacter clades and the genus-specific probe POL740. c Relative abundances of the six most abundant minimum entropy decomposition (MED) nodes as retrieved from [14]. d Metagenome read recruitments on Polaribacter MAGs and genomes. Recruited reads are normalized to the bin/genome sizes and reported as reads per kilobase million (RPKM). Taxonomic units with high levels of correlation across methods (Supplementary Table S7) are depicted in identical colors. An asterisk indicates data from the 2009 spring bloom are sparse, consisting of only two and four sampling dates for MED and metagenome analyses, respectively.
Polaribacter 1-a dominated the bacterial community in 2009 (19%), 2011 (7%), and 2012 (13%) based on cell counts with the clade-specific probe POL405 (Fig. 3b). Since Polaribacter MAG assemblies lacked 16S rRNA genes (Supplementary Table S8), a sequence-based link between taxonomic units of different methods could not be established. We therefore used Spearman rank tests to correlate the individual methods (Supplementary Table S7) and to interrelate different types of abundance data (Supplementary Fig. S3). For example, MED node 3321 (Fig. 3c) and metagenome read recruitment on Polaribacter 1-a MAGs (Fig. 3d) yielded a similar abundance pattern as CARD-FISH with POL405 (Fig. 3b) (Spearman’s rho = 0.96 and 0.88, respectively) (Supplementary Table S7). Polaribacter 1-a MAGs exhibited a differential abundance pattern. MAG POL1A_74 was abundant in 2009 and 2012, whereas MAGs POL1A_42, POL1A_60, and POL1A_84 were detected in 2011. MAG POL1A_42 was also found in lower abundances in the late phase of the 2010 bloom (Supplementary Table S6). Interestingly, the peak abundances of Polaribacter 1-a occurred after blooms of Chattonella (Fig. 3a). In terms of taxonomy, Chattonella spp. (phylum Ochrophyta, class Raphidophyceae) are rather distinct from diatoms (phylum Ochrophyta, class Bacillariophyceae), which usually dominate Helgoland spring blooms. In 2010, the phytoplankton community was dominated by Phaeocystis spp., Thalassiosira nordenskioeldii, and Mediopyxis helysia. In this year, Polaribacter 2-a, Polaribacter 3-a, and Polaribacter 3-b successively reached high abundances (6%, 8%, and 10%) (Fig. 3d). Polaribacter 2-a and Polaribacter 3-b were also present during the early and late bloom phases in 2009, 2011, and 2012, albeit with lower abundances (1%, 1%, 0.4 and 4%, 0.5%, 3%), whereas Polaribacter 3-a was only abundant in 2010 (Fig. 3d). In contrast, Polaribacter 1-b and Polaribacter 2-b exhibited lower relative abundances than the other Polaribacter clades (Fig. 3d). Polaribacter 1-b was detected at relatively low abundances of 2–3% in 2009 and 2011, while Polaribacter 2-b was present only in 2010 where it reached up to 3%.
Core and pan genomes
We determined common genes between the six distinct Polaribacter clades, as well as genes that were unique to each clade (Fig. 4). The combined core genome of all Polaribacter clades comprised 1275 genes and was dominated by genes involved in housekeeping and basic cellular functions (Supplementary Table S9).
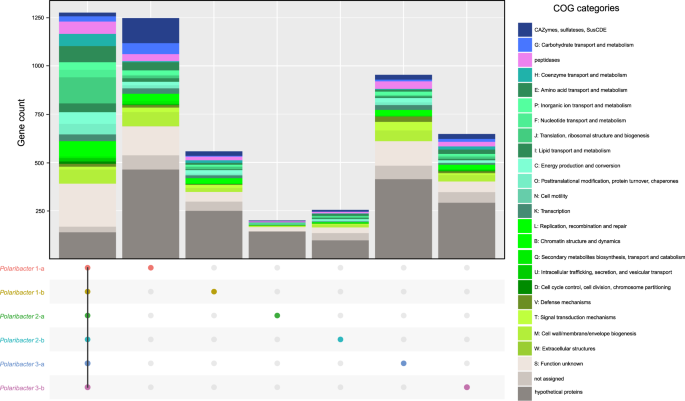
Number of the genes in the core genome of all clades, and unique gene repertoire of each clade are shown. Metabolic classification was obtained according to COG categories [48]. The genes which are shared by at least two clades are listed in Supplementary Table S9.
All Polaribacter clades coded for the Embden–Meyerhof‐Parnas, and pentose‐5‐phosphate pathways as well as the tricarboxylic acid cycle. An aerobic redox chain comprising a NAD(H):ubiquinone oxidoreductase (complex I), succinate dehydrogenase (complex II), and cytochrome cbb3 and aa3 type (complex IV) terminal oxidases was also present. All clades furthermore contained proteorhodopsin, which might generate supplemental energy from light. In terms of nutrient metabolism, assimilatory sulfate, and nitrate reduction genes (e.g., sulfate adenylyltransferase and ferrodoxin-nitrate reductase) were found together with dedicated transporter systems. All Polaribacter clades also possessed polyphosphate production and hydrolysis genes (ppK and ppX). Genes associated with gliding motility (gldDE-H-B-KLMN-A-I-FGJ) were also present in all clades. As for vitamin metabolism, Polaribacter spp. possessed biotin and thiamin biosynthesis genes (bioC and apbE) as well as ABC transporters for vitamin B12 uptake (btuB-F-C). In contrast, many carbohydrate degradation and transport genes were distinct for each clade (Fig. 4), thus belonging to the pan genome. For example, Polaribacter 1-a contained 130 genes for glycan utilization and transport including CAZyme families GH92 (e.g., α-mannosidase) and GH2 (e.g., β-galactosidase) (Supplementary Table S9). Likewise, Polaribacter 3-a possessed GH92, while Polaribacter 3-b encoded GH10 (e.g., β-xylanase) and GH128 (β-glucanase) genes.
Metabolic comparison of Polaribacter MAGs and genomes
We compared the metabolic potential of Polaribacter MAGs and the genomes of cultivated Polaribacter strains based on RAST subsystem analyses [36]. Polaribacter MAGs contained higher gene proportions in the RAST categories “Amino acid and Derivatives,” “Cofactors, Vitamins, Prosthetic Groups, Pigments,” and “RNA metabolism” (99.4, 67.5, and 47.5 genes/Mbp in average) (Supplementary Fig. S4) (Supplementary Table S12). Furthermore, both MAGs and genomes possessed high gene abundances in the categories “Carbohydrates” (average: 53.9 genes/Mbp) and “Protein Metabolism” (average: 59.6 genes/Mbp), albeit with large variations (standard deviations: 13.6 and 15.5 genes/Mbp).
Besides polysaccharides, large amounts of proteins are also present in marine phytoplankton [52] and heterotrophic bacteria are able to utilize these proteins using peptidases [53]. Comparison of peptidase and degradative CAZyme abundances (GH + CE + PL) between Polaribacter clades and other available Polaribacter genomes showed different protein and carbohydrate utilization profiles (Supplementary Table S13). All Polaribacter clades encoded high numbers of serine (S) and metallo (M) peptidases (~80% of all peptidases), which mediate the degradation and uptake of extracellular proteins [18]. Furthermore, GHs were the most abundant CAZyme family genes. Remarkably, the range of CAZyme proportions (8–39 per Mbp) was two times higher than that of peptidases (37–51 per Mbp). With increasing genome size, Polaribacter spp. harbor proportionately fewer peptidases (Spearman’s rho: −0.65, p = 0.01) and more degradative CAZymes (Spearman’s rho: 0.45, p = 0.04), corroborating an earlier analysis of 27 Flavobacteriaceae genomes [18]. Together with Polaribacter isolates from, for example, temperate seawater and polar regions, Polaribacter 2-a and Polaribacter 2-b had the highest peptidase and the lowest degradative CAZyme abundances together with the smallest estimated MAG sizes (Fig. 5). In contrast, some MAGs in Polaribacter 1-a (POL1A_60 and POL1A_84) possessed the highest CAZyme and lowest peptidase proportions and grouped with species that were associated with macroalgae and marine animals (Fig. 5). Polaribacter 3-a and Polaribacter 3-b contained moderate CAZyme and peptidase repertoires together with North Sea spring bloom isolates, while Polaribacter 1-b harbored the lowest numbers (Fig. 5).
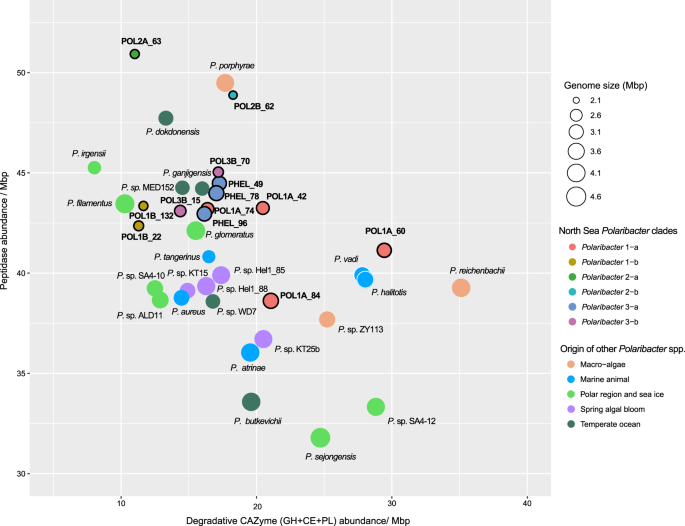
Genomes belonging to Polaribacter 3-a are indicated by the prefix “PHEL”. Gene abundances are normalized with the MAG or genome sizes. Complete MAG sizes are estimated based on the completeness values calculated via CheckM [30].
PUL repertoires
We investigated the PUL repertoires of Polaribacter MAGs and genomes to predict the glycan niches of North Sea Polaribacter spp. (Fig. 6a). Phylogenetic analysis of the translated susC gene sequences encoded in these PULs indicated substrate-specific clustering [43] and enabled to identify variants of PULs that putatively target identical or at least similar substrates (Supplementary Figs. S5, S6).
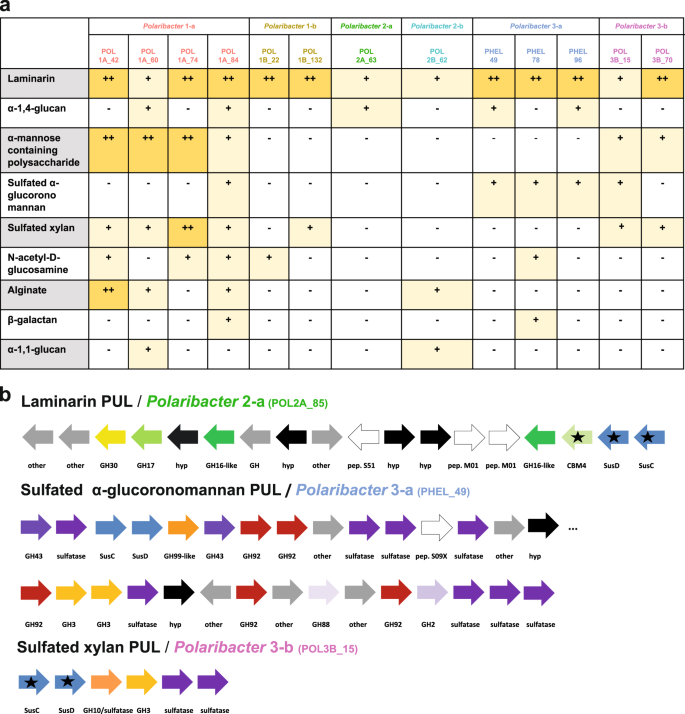
a Distribution of PULs with predicted substrates across six distinct Polaribacter clades. Plus sign (+) correspond to the PUL variants for individual substrates as they are suggested by phylogenetic analysis of SusC protein sequences in Supplementary Fig. S5. b Gene composition of some distinctive PULs encoded by North Sea Polaribacter clades. Black stars indicate expressed genes based on metaproteome analyses (Fig. 7). CAZymes, peptidases and Sus transport genes are depicted in different colors. Hypothetical proteins and genes involved in other metabolic functions are abbreviated with “hyp” and “other,” respectively. CAZymes annotated only by RAST are highlighted by the suffix “-like.” Compositions of all annotated PULs in the Polaribacter clades are summarized in Supplementary Fig. S6.
All Polaribacter clades possessed PULs predicted to degrade diatom storage glycan laminarin, which has a β-1,3-linked glucose backbone that sometimes includes β-1,2 or β-1,6-glucose side chains (Fig. 6a) [54]. Seven variants of laminarin PULs with different combinations of GH3, GH5, GH16, GH17, and GH30 family GH were detected (Supplementary Figs. S5, S6). The respective PUL (laminarin B1) detected in Polaribacter 3-a (strain Hel1_33_49) was also shown to be up-regulated with laminarin in a previous study [18]. Among these PULs, Polaribacter 2-a, and Polaribacter 2-b had the most complex one, which included peptidases M01 (e.g. aminopeptidase activity) and S51 (dipeptidase activity) and CBM4 (e.g., binding to β-1,3-glucans) (Fig. 6b).
Three Polaribacter clades (1-a, 2-a, and 3-a) harbored PULs predicted to target α-1,4-glucans, which are common storage compounds in marine algae, bacteria, and animals (Fig. 6a) [55]. Having two variants, these PULs contained GH13 (α-amylase), GH65 (maltose phosphorylase), GH31 (e.g., α-glucosidase) as core GH genes (Supplementary Fig. S6). A glucose-induced PUL with high synteny was shown in the North Sea isolate Gramella forsetii KT0803T [56]. Alpha-1,4-glucan PULs also encoded two susE genes, which direct the uptake of maltooligosaccharides of specific lengths and likely facilitate the selection of particular glycans from the environment [57].
Moreover, Polaribacter clades 1-a and 3-b had putative PULs to utilize α-mannose-rich polysaccharides (Fig. 6a). These PULs featured two variants and encoded proteins of CAZymes families, for example, GH92 (e.g., α-mannosidase) and GH130 (e.g., mannooligosaccharide phosphorylase) (Supplementary Fig. S6). Specificity for α-mannan of a PUL containing GH92, GH130, and GH76 has been shown in a bacterium from the human gut [58]. Polysaccharides rich in α-mannose have been identified as constituents in the frustules of some diatoms [59].
Polaribacter 1-a, 3-a, and 3-b harbored PULs presumably targeting sulfated α-glucoronomannans (Fig. 6a). Among these, Polaribacter 3-a carried the most complex PUL of all clades. This PUL contained twelve CAZymes including five GH92 (endo-α-mannosidases), two GH3 and a GH99 (putative endo-α-mannanase) together with nine sulfatases (Fig. 6b). Sulfated α-glucoronomannans are found in diatom cell walls [60] and sulfatase- and GH92-rich PULs have been previously detected in Polaribacter–affiliated fosmids from the North Atlantic [61], suggesting a potential high prevalence in the world’s oceans.
Polaribacter clades 1-a, 1-b, and 3-b possessed PULs predicted to target sulfated xylans (Fig. 6a). Polaribacter 3-b harbored all variants and the most complex form of putative sulfated xylan PUL (Fig. 6b, Supplementary Fig. S6). This PUL comprised a GH3 (e.g., xylosidase), a GH10 (e.g., β-xylanase) and two sulfatase genes, together with an adjacent putative PUL containing a GH128 (β-glucanase) and four sulfatases genes. A similar PUL with GH3 and GH10 was shown to be upregulated with xylan in the human gut bacterium Bacteroides xylanisolvens [62]. Xylans are also components of marine phytoplankton [63], and high xylanase activities have been reported for many ocean provinces [64]. In addition to these substrates, the glycan niches of the Polaribacter clades were distinct with respect to the utilization of N-acetyl-D-glucosamine, alginate, β-galactans, and α-1,1-glucans (Fig. 6a, Supplementary Fig. S6, Supplementary Information).
Metaproteomics
We analyzed 14 metaproteomes from 2009 to 2012 spring algal blooms [12, 43] to investigate in situ expression profiles of representative MAGs and genomes in each Polaribacter clade (Fig. 7) (Supplementary Table S10). In total, 845 Polaribacter proteins were found to be expressed (3.5% of the total proteome). Polaribacter clades 1-b and 3-b exhibited high expression of genes related to the degradation of laminarin and sulfated xylan during the late phase of the 2009 bloom (Fig. 7). Furthermore, Polaribacter 1-a showed expression of proteins associated with utilization of N-acetyl-D-glucosamine, α-mannose-rich polysaccharides and alginate during this time. In 2010, we could detect mainly laminarin degradation by the clades 2-a, 2-b, 3-a, and 3-b. In 2011 and 2012, the metaproteome sampling dates did not coincide with Polaribacter peak abundances, which is why no relevant Polaribacter protein expression profiles could be detected (Fig. 7). Analysis of expressed SusC genes from all abundant Bacteroidetes species during North Sea algal blooms revealed that Polaribacter spp. dominated alginate and sulfated xylan degradation, while other clades were also involved in the degradation of laminarin, α-mannose-rich polysaccharide and α-glucan-containing polysaccharides [15].
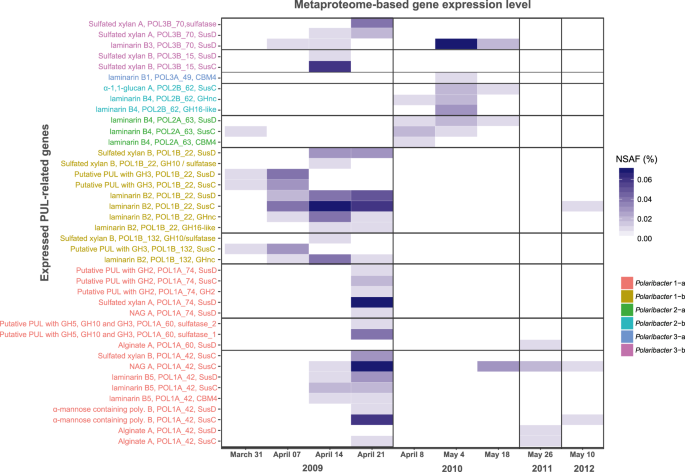
All expressed genes in Polaribacter MAGs/genomes are summarized in Supplementary Table S10. Metaproteomes without any detected PUL-related protein are not shown. NSAF normalized spectral abundance factor.
Source: Ecology - nature.com

