Tree data collection
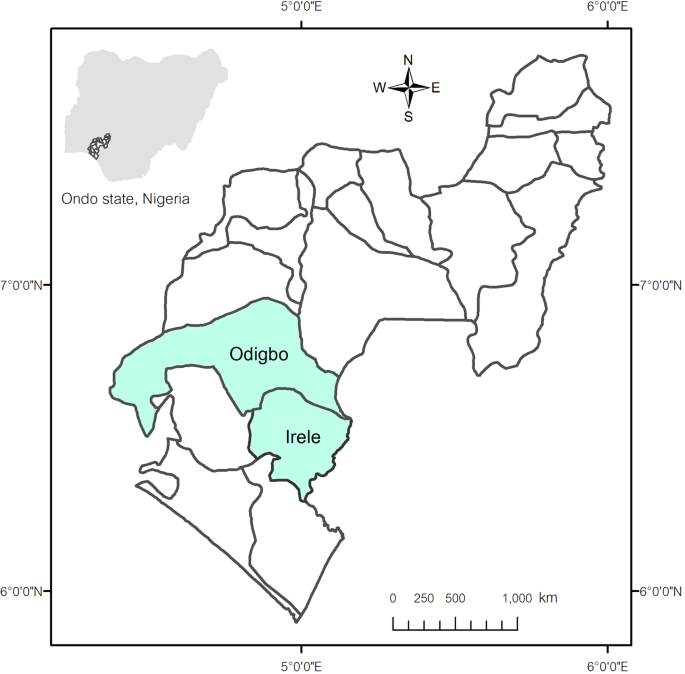
The locations of the existing trees were collected as part of a group interview of farmers, tree finders, members of village community, and other key informants who have the extensive knowledge of tree identification. The data obtained from knowledgeable human resources were coped with ground survey from a team of local forestry experts. Forestry experts assisted during the inventory exercise of the existing K. ivorensis presence in the wild forest and free areas between July and September 2017. The ground survey was conducted in a systematical approach in each village from north to south. The field work involved taking the geographical coordinates of each K. ivorensis tree with the use of a handheld geographic positioning system (GPS) device (Garmin GPS 60) within Odigbo and Irele government areas. The reference system used for GPS positioning was the World Geodetic System (datum WGS84). The coordinates of each of the trees with identification numbers were added to the map to display their positions. Additional tree structure data such as Dbh, Dm, and Ht of each tree were measured. The manual readings of the Dbh through the circumference were taken by using a girth tape at 1.37 m above ground level. Tree Ht and Dm were measured using a telescopic Spiegel-Relaskop.
Spatial analysis and data management
Descriptive statistics of the tree characteristics were performed across the selected area. All the pre-processing steps for spatial analysis of K. ivorensis coordinates acquired for this study were first geo-referenced and then reprojected with UTM WGS84 projection zone 31. A 1.6 km buffer zone was created to cover the tree observations adjacent to the study area. All spatial analysis was computed using ArcGIS® software v.10.6.1.
K. ivorensis distribution and spatial autocorrelation
In addition to the explicit spatial locations of trees, this study applied Global Moran’s I technique, which is commonly used as an indicator of spatial autocorrelation29. Moran’s I reflects the correlation of the spatial relationship among observations in a neighbouring pattern computed by the statistic Moran’s I index (Eq. 1).
$$I=frac{N{sum }_{i=1}^{n}{sum }_{j=1}^{n}{w}_{ij}({x}_{i}-bar{x})({x}_{j}-bar{x})}{({sum }_{i=1}^{n}{sum }_{j=1}^{n}{w}_{ij}){sum }_{i=1}^{n}{({x}_{i}-bar{x})}^{2}}$$
(1)
where N is the number of observed trees; (bar{x}) is the mean of the variable of the whole region; xi is the value of the variable at a particular location i; xj is the value of the variable at other locations; wji is the distance weighting between locations xi relative to xj.
Moran’s I index values range from −1 to 1. A high positive index suggests that a target variable value is similar to its neighbourhood. This implies spatially autocorrelated variables among locations, which include high-high clusters and low-low clusters. A negative index value indicates that the spatial variable distribution of high and low values is more spatially dispersed. When Moran’s I approaches zero, spatial randomness is expected. The null hypothesis for the Global Moran’s I states that the spatial attribute being analysed is randomly distributed among the neighbouring features in the study area. When a z-score is larger than 1.96 or lower than −1.96 (p < 0.05), the null hypothesis is rejected and implies that the spatial autocorrelation is significant. The Global Moran’s I has been widely used in the forestry field to study spatial patterns of natural forest growth and plant populations30,31, species-based similarities32, spatial differentiation characteristics, and driving forces of forest transition33. In this study, the spatial autocorrelation of Dbh, Dm, and Ht was analysed.
Hot spot detection
Hot spot analysis has been used to pinpoint priority areas for forest protection and conservation34,35,36,37. The fundamental Getis-Ord ({G}_{i}^{ast }) statistic measures the intensity of clustering of high or low values38, which can identify clustering of spatially local phenomena. A simple form of the ({G}_{i}^{ast }) statistic can be written as39:
$${G}_{i}^{ast }=frac{{sum }_{j=1}^{n}{w}_{ij}{x}_{j}}{{sum }_{j=1}^{n}{x}_{j}}$$
(2)
where ({G}_{i}^{ast }) is the statistic that describes the spatial dependency of location i over all n locations; xj is the magnitude of the variable x at event j over all n; n is equal to the total number of features; wij is the weight value between location i and j that represents their spatial interrelationship. The outcomes express the z-score and p-value of the computed ({G}_{i}^{ast }) in comparison with the data normal distribution. This study applied point-based hot spot analysis on the Dbh and Ht across Odigbo and Irele LGA. When a z-score of ({G}_{i}^{ast }) is larger than 1.96, the point can be considered as a hot spot (high values) at the confidence level of 95%, if smaller than −1.96, that point is considered a cold spot (low values).
K. ivorensis economic value
Forests deliver multiple ecosystem services, namely timber and fuelwood, fruits and honey, biodiversity conservation, carbon sequestration, wilderness, erosion control, nutrient cycling, scenic beauty, and spiritual values40; however, this study is limited to estimation of the economic value of K. ivorensis based on consumptive timber use. Two main factors are taken into value estimation: tree volume and wood price.
Volume functions can be categorised into three classes: first, using Dbh as a sole predictor (local volume functions); second, having Dbh and Ht measurements as predictors (regional volume functions); and third, including Dbh, Ht, and an upper stem diameter as a surrogate for stem form, which is particularly good at the national scale (large-scale volume functions)41. Oliveira et al.24 suggested that double-entry models (Dbh and Ht predictors) are more accurate than single-entry models (Dbh predictor) when predicting K. ivorensis stand volume. This study adopted two approaches for indirect volume functions: the allometric volume equation (Eq. 3)42 and the specific K. ivorensis volume equation obtained by Oliveira et al.24 (Eqs. 4 and 5).
$${V}_{A}=sum (frac{Db{h}^{2}}{4}ast Htast pi ast {f}_{i})$$
(3)
where VA is tree volume determined by allometric equation; Dbh is tree diameter at breast height (cm); Ht is the total height of the tree (m); fi is the form factor of the tree depending on the shape of the tree species (0.7)42.
Specific K. ivorensis volume equations were more complicated since they were calculated from different models; then compared with observed volumes from Smalian’s formula for validation of the results. First thinning and final cut were estimated separately with respect to tree ages. Tree ages, however, were unknown for this study, Dbh of <30 cm and ≥ 30 cm were thus presumed to define the first thinning and final cut, respectively. Oliveira et al. [26] proposed the Schumacher and Hall model43 as the best equation to estimate consumptive volume in Minas Gerais stands, where soils and climate are comparable to our study area. Formulas are written as follows:
$$V{s}_{first}=0.0002428ast Db{h}^{1.849}ast H{t}^{0.5952}$$
(4)
$$V{s}_{final}=0.0001452ast Db{h}^{1.962}ast H{t}^{0.6165}$$
(5)
$$V{s}_{total}=V{s}_{first}+V{s}_{final}$$
(6)
where Vsfirst is the estimated first thinning of K. ivorensis volumes (m3); Vsfinal is the estimated final cut of K. ivorensis volumes (m3); Vstotal is the sum of the first thinning and final cut volumes (m3).
The value of provisioning ecosystem services, such as timber, can be estimated using market values40. The market price for K. ivorensis timber value varied from US$500 to US$1,500 per cubic meter. For the economic value, US$1,500 was applied.
Source: Ecology - nature.com
