The coupling results of ANLI and ACRHP
Hefei is taken as an example and five regression models between ANLI and ACRHP are established so that the optimal regression model can be obtained by comparing the R2. Table 4 shows five regression models between ANLI and ACRHP for Hefei.
(R2 represents the coefficient of determination used to evaluate the accuracy and reasonableness of the coupling models.)
After comparing all the above-mentioned regression models, including the linear regression model, the exponential regression model, the logarithm regression model, the quadratic regression model, and the power regression model, we conclude that the regression model with the highest figure of R2 is the Quadratic regression model (88.95%). Therefore, we can approximately conclude that the Quadratic regression model is the optimal mining model for predicting housing prices.
The regression models of the other 17 target cities are calculated in the same way. And Table 5 shows five regression models for Changchun, Changsha, Chengdu, Chongqing, Guiyang, Harbin, Hohhot, Kunming, Lanzhou, Nanchang, Taiyuan, Urumqi, Wuhan, Xi’an, Xining, Yinchuan, and Zhengzhou.
Observing all the experimental results, we can conclude that the optimal mining model for Changchun, Changsha, Chengdu, Chongqing, Guiyang, Harbin, Hefei, Hohhot, Kunming, Lanzhou, Taiyuan, Wuhan, Xi’an, Yinchuan, Urumqi, and Zhengzhou is the quadratic regression model, while the optimal mining method for Nanchang and Xining is the exponential regression model.
Abnormal error elimination and optimal model determination
Figure 4 shows the curve fittings and the abnormal errors of each capital city. The abnormal errors of the optimal model of each capital city are eliminated by the LMedS algorithm.
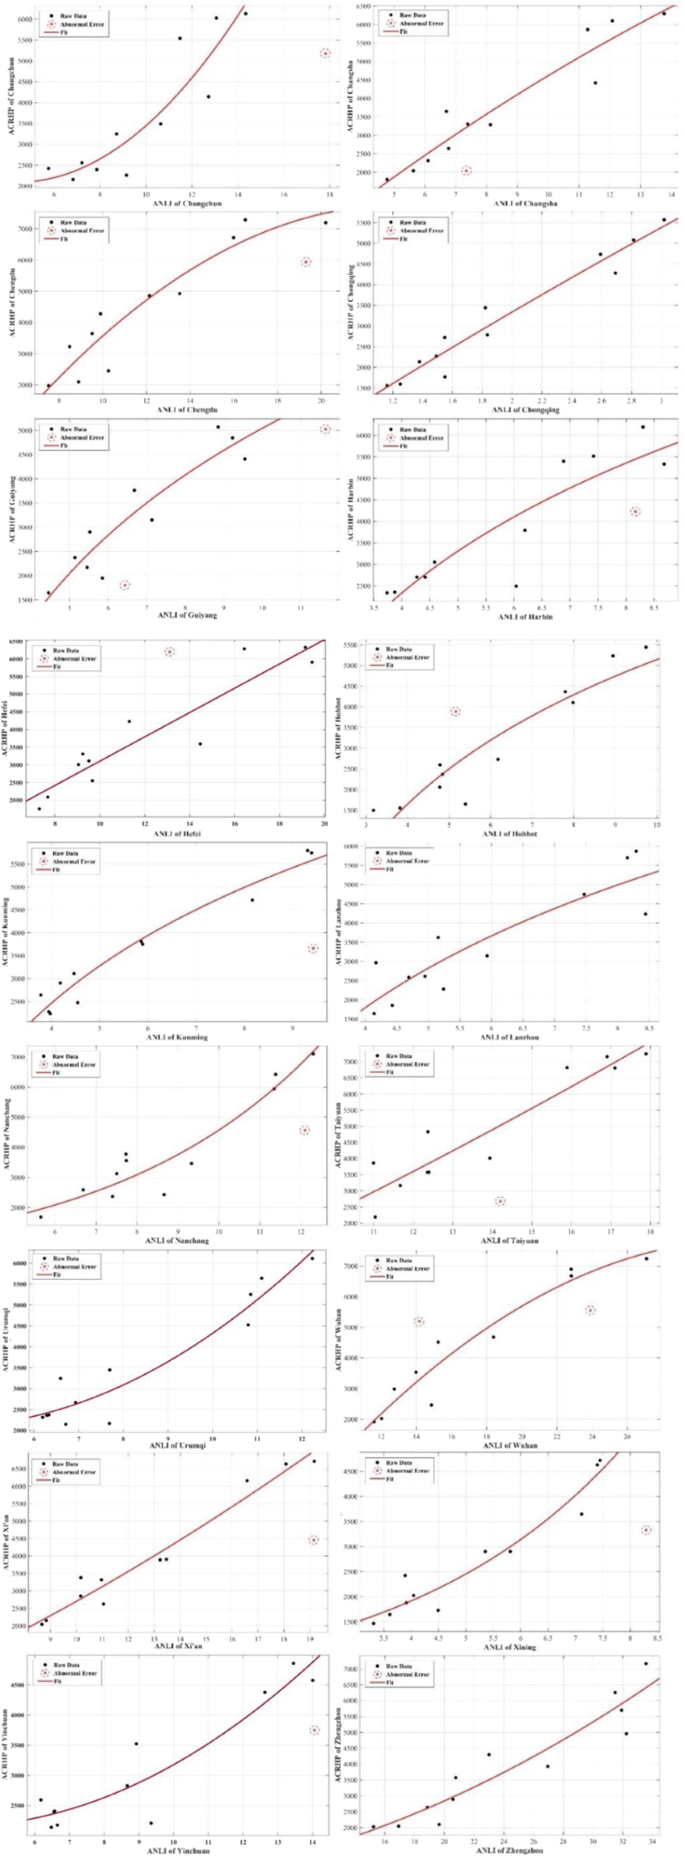
The abnormal errors and curve fittings for each capital city.
Table 6 shows the results of again establishing the regression model after eliminating the abnormal errors.
Abnormal error elimination can significantly improve the accuracy of the mining model. To reduce the impact of the abnormal error on the accuracy of the mining model, the abnormal error of ANLI and ACRHP are eliminated after obtaining the optimal model. Comparing the current regression models with the former regression models (Table 5, Table 6), the accuracies of the models are significantly improved. The results of comparing the two situations of the same city’s regression models that eliminate abnormal error show that the optimal mining relationship between ACRHP and ANLI for Changchun, Changsha, Chengdu, Chongqing, Guiyang, Harbin, Hefei, Hohhot, Kunming, Lanzhou, Taiyuan, Wuhan, Xi’an, Yinchuan, Urumqi, and Zhengzhou is the quadratic function, while for Nanchang and Xining is the exponential regression model.
Uncertainty estimation of prediction
Predicted future housing prices
ANLI regression models of each provincial capital according to their time series are established. The explained variable is ANLI and the explanatory variable is year Y. The calculation is based on the ANLI of the previous time series, and the function with the highest degree of R2 is selected as its regression model. The optimal regression model of the ANLI time series prediction of each provincial capital is shown in Table 7.
Using the principle of least-squares curve fitting for regression analysis and prediction, the ANLI of the 18 provincial capitals in future years can be obtained. Figure 5 shows the results of taking 2014 as an example to evaluate the rationality of each city’s model and predict the future ANLI. Table 8 lists the ANLI prediction intervals for each capital city.
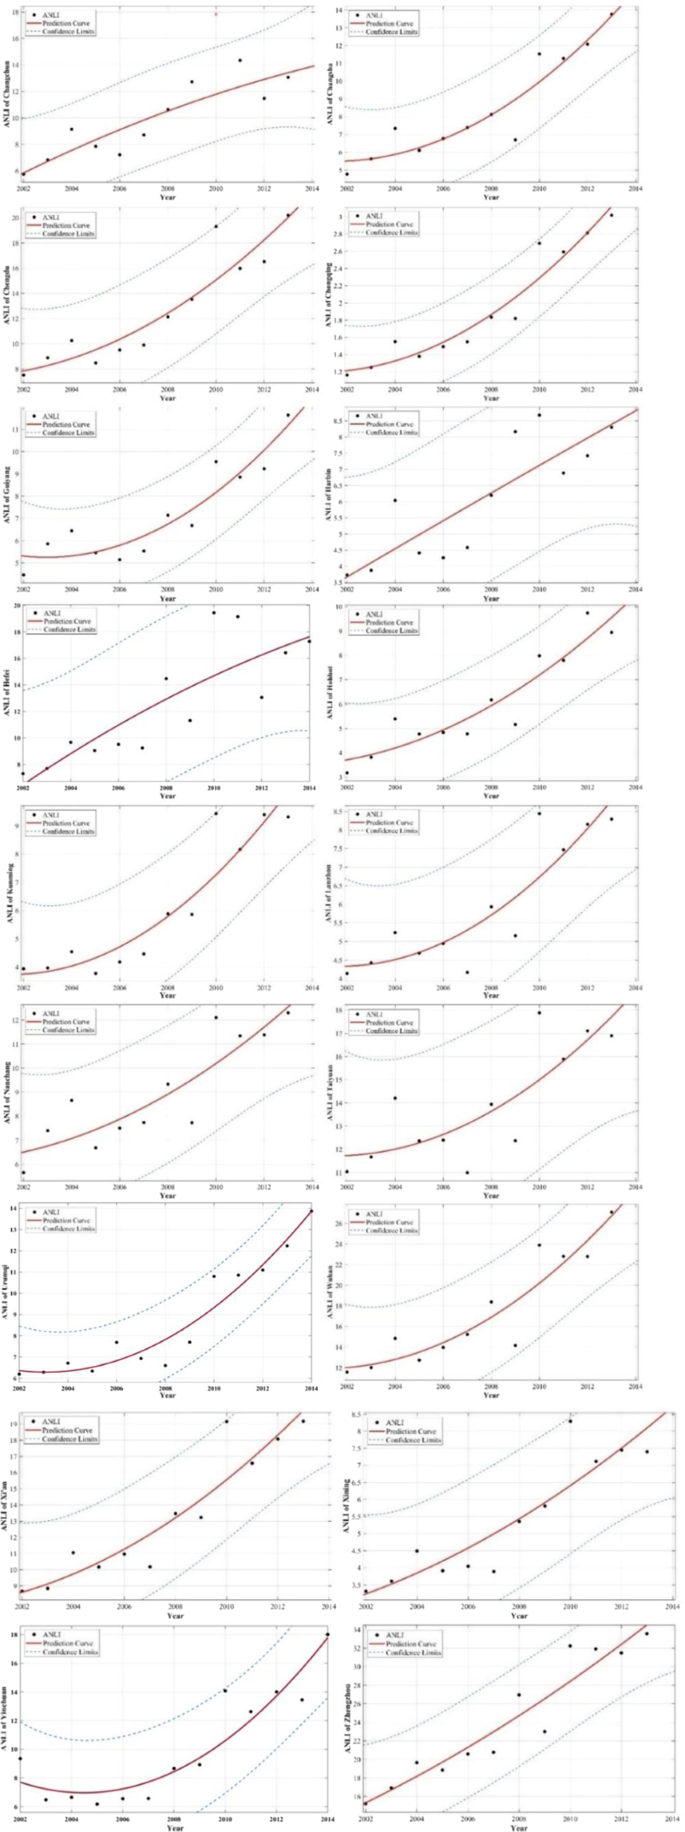
Prediction of ANLI values of cities in 18 inland provinces (The ANLI Time Series of the capital city and its 95% Confidence Interval).
The obtained ANLI prediction interval is brought into the optimal regression model of ANLI and AHP of each capital city, and the housing price range of 2014 can be calculated and finally compared with the price published by the National Bureau of Statistics to test the model. Taking Hefei as an example, the data show that ANLIMIN = 14.0021 and ANLIMAX = 22.5585. The possible average housing price prediction interval is: ACRHPMIN = 5640.0554 yuan per square metre and ACRHPMAX = 8606.2131 yuan per square metre. The housing price of Hefei from the 2014 official statistics is 7157 yuan per square metre, which is within this prediction interval. Table 9 shows the ACRPH prediction range and actual housing price for each provincial capital.
From the results above, the prediction results are mainly accurate. As seen in Table 9, one unanticipated finding was that the ACRHP of Chengdu was overestimated 88 yuan, while the Wuhan was underestimated 107 yuan.
Optimization prediction results
As the results above, the uncertainty of ANLI is considered, while the uncertainty of ACRHP is ignored. To improve the accuracy of our optimal model, the ACRHP was adjusted by official inflation rate data acquiring form the World Bank.
Table 10 shows ACRPH prediction range and actual housing price for each provincial capital after ACRHP corrected by Chinese inflation rate. From the results above, the prediction results are all in our prediction interval which further confirms the feasibility and accuracy of our method.
Discussion
The experimental sample size
According to the principle of statistical inference, when a small probability event occurs, it cannot be considered as an accident event. We selected m = 18 inland provincial capital cities in China as test areas. There are two outcomes for predicting ACRHP, consistency or inconsistency. For m provincial capital cities, there are 2m cases (R2 is high or low, namely consistency or inconsistency). Two sets of experiments were undertaken to compare the performance.
The first set of experiments forecasted ACRHP by ANLI directly. There are two cities out of prediction interval, i.e., Chengdu and Wuhan. Therefore, the probability of the strong correlation between ACRHP and ANLI of all the m provincial capitals is ({C}_{18}^{2}/{2}^{18}=153/262144=0.0005836487,) which is a very small probability event. The second set of experiments used the adjusted ACRHP by inflation index for prediction. All cities are in the prediction interval. The probability of the strong correlation between ACRHP and ANLI of all the m provincial capitals is only (1/{2}^{18}=1/262144=0.0000038147), which is the much smaller probability event.
All in all, the experimental results verify that our sample size is enough, scientific and reliable; so there is a strong satistical correlation relationship between ACRHP and ANLI for 18 inland provincial capital cities in China.
The influence of saturation problem
The saturation problem of DMSP/OLS data has little effect in this research. The reason is as follows.
(a) For this study, there only few inland provincial capital cities in China have saturation problems close to 2013. Moreover, this problem is only concentrated in certain few areas of the developed city centre such as Wuhan and Chengdu.
(b) Research object is the city-scale ACRHP, so “average” night-time light intensity (ANLI) is used to analyse housing prices which can smooth (i.e. “average”) or decrease the saturated error of night-time light brightness value. In other words, the error, which exceeds 63, divided by the very large S is almost ignored. S represents an administrative area of provincial capital city in Eq. (1), and provincial capital cities are always with the large areas, e.g., the smallest inland provincial capital city – Taiyuan is 6988 km2.
(c) Saturation processing of DMSP-OLS may introduce new errors due to spatial heterogeneity. Therefore, we selected inland China as study areas where the saturation problem is not serious to ensure the credibility of the results to a large extent.
The mechanism between ACRHP and ANLI
It can be seen from the experimental results that the correlation degrees of the ANLI and ACRHP for the 18 provincial capitals in inland China are satisfactory. The optimal mining model is the quadratic regression model. In addition, ACRHP can be used to predict the future ACRHP. The relevant information can be summarized as follows.
(a) ANLI and ACRHP are highly correlated. Firstly, the correlation between ANLI and ACRHP can be explained by the internal mechanism. As mentioned in the Introduction section, there is a transmission mechanism between night-time light and ACRHP. Housing price is related to such social-economy factors as population migration and distribution, gross national product (GDP), and urbanization from a macro point of view. And these social-economy factors can be reflected and represented from night-time light imagery. In all, this conduction effect can be generalized by the substitution of the representation Eq. (12). Secondly, the experimental results strongly demonstrate that there is indeed a strong correlation between ANLI and ACRHP. In the process of constructing regression models of ANLI and ACRHP, as shown in Table 6, the ({R}^{2}) of each regression model is above 0.80, which demonstrates that there is a high correlation between ANLI and ACRHP.
$$begin{array}{c}ACRHP=f({x}_{1},{x}_{2},cdots ,{x}_{i}) {x}_{1}={g}_{1}(NTL) {x}_{2}={g}_{2}(NTL) cdots cdots {x}_{n}={g}_{i}(NTL) ACRHP=f({g}_{1}(NTL),{g}_{2}(NTL),cdots ,{g}_{i}(NTL))={rm{F}}(NTL)end{array}$$
(12)
where f(x) and g(x) represent the functional relationship; ({x}_{i}) represents social-economy factors such as population, gross national product, human activities, urbanization and so on; (g({rm{NTL}})) represents the quantity relationship between these social-economy factors and brightness value of night-time light imagery. Based on recursion, we can acquire a composite function ─ (ACRHP=F(NTL)) which reflects the transmission mechanism between NTL and ACRHP.
(b) Overall, the optimal mining model between ANLI and ACRHP of the most inland provincial capitals in China is the quadratic function, which can be regarded as an empirical formula. Additionally, the optimal mining model is quadratic function can be explained by Taylor series. In mathematics, a Taylor series is a representation of a function as an infinite sum of terms that are calculated from the values of the function’s derivatives at a single point. The Taylor series of a real or complex-valued function f (x) that is infinitely differentiable at a real or complex number a is the power series
$$f(a)+frac{f{prime} (a)}{1!}(x-a)+frac{f{primeprime} (a)}{2!}{(x-a)}^{2}+frac{fprimeprimeprime (a)}{3!}{(x-a)}^{3}+ldots $$
(13)
which can be written in the more compact sigma notation as
$$mathop{sum }limits_{n=0}^{infty }frac{{f}^{(n)}(a)}{n!}{(x-a)}^{n}$$
(14)
where n! denotes the factorial of n and f(n)(a) denotes the nth derivative of f evaluated at the point a. Any elementary function can be approximated by using a finite number of terms of its Taylor series. The optimal mining model is the quadratic polynomial, which can approximate any arbitrary function relationship. For this reason, the quadratic polynomial can be used to explain the relationship between ANLI and ACRHP more accurately. However, the quadratic function is only an optimal model in the capital cities of the most provinces in inland China, and it is an empirical model. Due to spatial differentiation, different cities may have different optimal models.
(c) ANLI can be used to predict the future ACRHP of provincial capitals in China. Based on the conclusion that ANLI and ACRHP are highly correlated, we predict the ACRHP in the following years of the target cities and compare them with the data published by the National Bureau of Statistics, with satisfactory results (Table 9). Among the results, the actual housing price of Chengdu and Wuhan in 2014 slightly deviates from the predicted housing price. Obviously, the 2014 DMSP-OLS night-time light intensity is calculated by establishing a regression curve of the time series prediction, which may make the 2014 night-time light intensity itself uncertain: when it is used to predict the housing price, it may lead to some deviation. However, this “unusual case” also can be reasonably explained by socio-economic factors.
For Chengdu, the ACRHP is overestimated 88 yuan. There are several possible explanations for this result. Firstly, natural disasters may influence the purchase behaviours, especially the earthquake, which usually causes a temporary real estate marketing crisis because of the negative consequences affecting the buildings50. Prior studies have noted that the 2008 Wenchuan earthquake (the deadliest earthquake to hit China in the past three decades) changed the consumption concept and the consumption behaviour of the resident51. According to official statistics, the ACRHP of Chengdu is 4778 yuan in 2008, while the ACRHP of Wuhan is 4781 yuan. By 2016, the ACRHP in Chengdu has increased to 7504 yuan, but the ACRHP in Wuhan has exceeded 10,000 yuan. In addition, the urban planning by local government is another important factor caused low ACRHP in Chengdu. In 2006, the government set a goal to construct a high-density city which improved floor area ratio and reduced the cost of real estate developers. All in all, the natural disasters and land policies have jointly led to moderate growth of the ACRHP in Chengdu.
For Wuhan, the ACRHP is underestimated 107 yuan. This finding was unexpected and suggests that the size of its economies and the change of corresponding policies may be the main factor. Table 11 shows the GDP of each capital city and its rank among all Chinese cities in 2014. Wuhan has a high economic level with its GDP in 2014 ranked eighth in cities across China, and the saturated digital number38 values of the light image is serious problem. Furthermore, in 2014, Wuhan abolished housing purchase restriction began in 2012 which brought “real estate market heat” and boosted the sale of houses. Therefore, the housing price of Wuhan experienced a big rise in 2014.
In addition to the above possible reasons, the official statistical housing prices of Chengdu and Wuhan are slightly deviates from the predicted housing price, and the actual values of the other 16 cities are accurately in the prediction range. Therefore, the average DMSP-OLS night-time light intensity can be used to predict the future ACRHP.
Besides, the reasons why the policy factors only have a slight impact on our regression model in most inland capital cities can be explained as below:
Firstly, the direct government intervention cannot radically change the driving mechanism of the housing prices especially in a market economy52. Meanwhile, indirect intervention already reflected in night-time lighting. For example, the Chinese government reformed the hukou system to adapt the current trend that populations are diverse moving from rural to urban centres, which promotes urbanization in China. And the series anthropogenic factors change already reflected in night-time light imagery.
Secondly, the available DMSP-OLS data until 2013 when the local government of central China has not regulated house prices toughly. Even if the housing price regulated by policies exists, the housing price is still rising steadily, especially in the researched capital cities of provinces and the urban centre53,54. Meanwhile, there are lags between policy implementation and housing price changes so that the housing restriction policies do not affect the housing price immediately55. To evaluate the trend of the historical ACRHP, the Mann-Kendall test56,57 was applied at a 0.05 significance level (Fig. 6). The results show that historical ACRHP is in a state of continuously significant increasing. In other words, the actual influence of the policy is smaller than we recognised. For example, it is well-known that the policy of home purchase restrictions has been one of China’s harshest housing market interventions to curb the overheating real estate market by imposing restrictions on purchasing power. Chinese central government has implemented basic purchase restrictions in 40 major cities designated by the Ministry of Housing and Urban-Rural Development since 2011. In Wuhan, a purchase restriction order was issued on February 23, 2011. However, it was only three years that the Wuhan Housing Security and Management Bureau held an internal meeting (September 23, 2014) and then announced the complete cancellation of the purchase restriction58. From the trend analysis, we can see that Wuhan housing prices have not been significantly affected by the purchase restriction policy, but have continued to accelerate the rise. The results also show that the market totally become one decisive factor determining market positions the real estate market which is also beyond our expectations about the effect of the home purchase restrictions policy. A more realistic simulation of the impact of the policy for housing prices is not as great as we expected, which is limited.
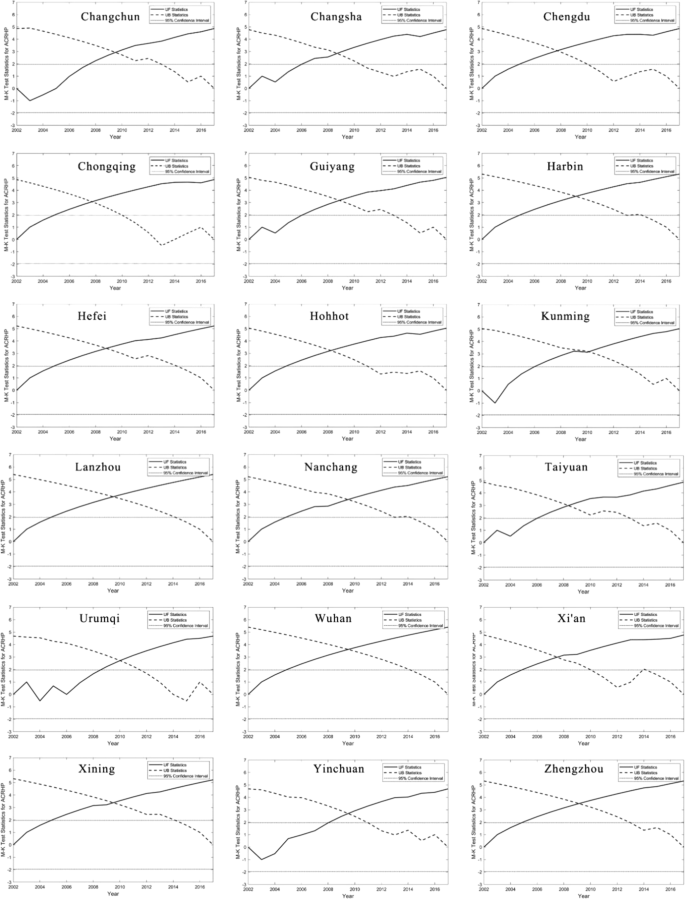
Mann-Kendall trend test of ACRHP at 18 inland capital cities in China during 2002–2017 (UF > 0 represents an increasing trend, while UF < 0 represents a decreasing trend. And if UF beyond 95% confidence interval line represents the increasing trend or decreasing trend is significant).
In all, it is true that the Chinese government’s policy has affected housing prices to a certain extent, such as the monopoly of land supply. However, the land monopoly supply system has not changed during the continuous and rapidly rising housing prices period since 2002. Explaining rapidly changing variables with a relatively invariant variable is an incomplete research idea.
Source: Ecology - nature.com
