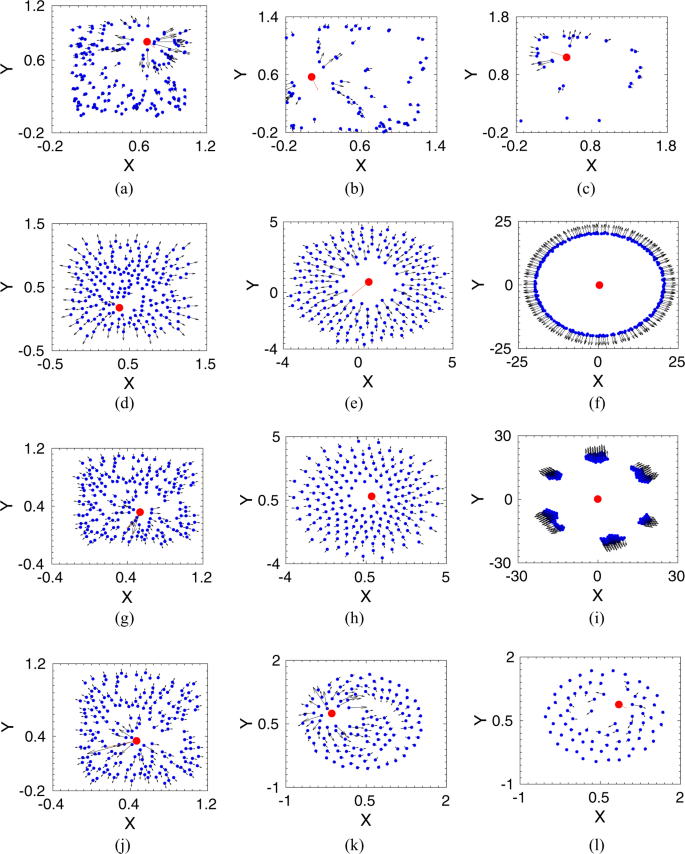
We have studied the prey-predator dynamics by solving the coupled Eqs. (4) and (5) numerically. We have investigated the escape dynamics for a wide range of parameter values by varying the prey group size (N), interaction radius ({R}_{{rm{i}}nt}), and also the strength of interactions between prey and the predator. Here, we present the dynamics for a case of a ‘strong’ predator. The ‘strong’ predator signifies that if the prey interacts with all prey to escape from the predator, then the whole group is killed by the predator. On the other hand, in the case of a ‘weak’ predator (when the predator strength, ({delta }_{0}) is small or the prey-predator repulsive strength, ({gamma }_{0}) is large), the whole prey group could run fast enough and easily escape. The representative parameter values are kept at ({alpha }_{0}=1.0), ({beta }_{0}=1.0), ({gamma }_{0}=0.2), and ({delta }_{0}=2.5). In our simulations, we consider that a group of (N) prey is initially positioned randomly within a square box of unit area, and the predator starts chasing from just outside the box, as illustrated in Fig. 1. The kill radius of the predator is taken as (0.01). A variety of escape patterns emerge as we vary the range of interaction radius, ({R}_{{rm{i}}nt}), among prey as shown in different snapshots in Fig. 2.

Escape patterns of the prey group (shown by blue dots) under a predator attack (red dot) for different interaction radius, ({R}_{{rm{i}}nt}). (a–c) Snapshots of prey group and the predator at different simulation time, (T=mathrm{0.1,1,2}) for ({R}_{{rm{i}}nt}=0), i. e., there is no interaction among the prey group. (d–f) Ring formation around the predator at ({R}_{{rm{i}}nt}=0.5); snapshots are at (T=mathrm{0.1,10,1000}). (g–i) Splitting up into smaller groups at ({R}_{{rm{i}}nt}=1.2); snapshots are at (T=mathrm{0.1,10,1000}). (j–l) For long range interaction, shown here for ({R}_{{rm{i}}nt}=2.0), chasing dynamics of the predator at (T=mathrm{0.1,10,20}).
We first consider the scenario when prey does not interact with each other, i.e., ({R}_{{rm{i}}nt}=0.0), and every individual runs away from the predator due to the prey-predator repulsive interaction. As seen in Fig. 2(a–c), the predator hunts down the randomly moving prey, and the whole group gets caught over time. Now, as we incorporate the prey-prey interactions in the group, we find that for a short-range of interactions radius, the whole prey group is also eventually chased down by the predator. However, as the interaction radius increases, different escape patterns emerge. For example, at the interaction radius, ({R}_{{rm{i}}nt}=0.5), as shown in Fig. 2(d–f), interacting prey form a circle surrounding the predator. Thus, the predator gets confused about which direction to attack, and meanwhile, the prey group moves away by circling the predator. Such escape routes of ring formation have also been observed in nature for several cases21,31. Other escaping trajectories also arise by varying the interaction radius further, for example, for ({R}_{{rm{i}}nt}=1.2), the prey group splits into smaller subgroups and migrates away from the predator in small groups as could be seen from Fig. 2(g,i). The number of subgroups formation depends on the interaction radius, on the size of the prey group, and also on the initial configurations of the group. On the other hand, at an even larger interaction radius at ({R}_{{rm{i}}nt}=2.0), as shown in Fig. 2(j–l), chasing dynamics is observed. The predator can catch the prey and eventually chase down the whole prey group as it has been observed when prey interacts with all in the group to avoid the predator.
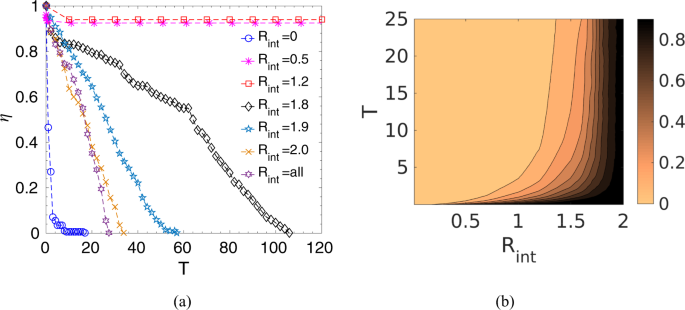
Now, to quantify the survival of prey as a function of interaction radius, we have calculated the survival probability, (eta ), of the prey group defined by the ratio of the number of survived prey, ({N}_{{rm{s}}ur}), at any instant (T) to the initial number of prey, i.e., (eta =frac{{N}_{{rm{s}}ur}(T)}{N}). It could be seen from Fig. 3a, as time progresses, for very short-range and long-range interactions, the whole prey group is killed by the predator. However, in the intermediate range, though initially, some prey is caught, but after some time, (eta ) reaches a steady value, which signifies that most of the prey in the group could escape. This strong dependence on the interaction range could be understood from the competing forces that govern the prey-predator dynamics. With no interaction, i.e., Rint = 0 or with smaller interaction radius, as the prey-prey cooperative interaction is not significant, each prey moves somewhat randomly and tries to escape from the predator driven by the prey-predator repulsive force; however as the predator-prey attractive force is stronger, the prey group is chased down and eventually caught by the predator. On the other hand, in case of a very large interaction radius, most prey interact with each other; hence, the whole prey group moves cohesively. As a result, the predator could easily track the whole prey group and hunt them down. Interestingly, in the intermediate range of interaction zone, the initial transient motion shows the chasing dynamics by the predator, however, as time progresses, the local interactions of prey eventually establish coordinated movements to confuse the predator by forming a circle or splitting up into subgroups, or by other escape routes to survive in the long run. In this case, in the beginning, predator-prey attractive force dominates over other forces due to the close proximity of the predator and the prey group. Thus, initially, chasing dynamics have been observed, and the predator is able to catch some prey. However, as time proceeds, local cooperative interaction among prey and prey-predator repulsion helps the prey group to move away, encircling the predator. With the increase in distance between the prey and the predator, prey-predator repulsive force gets strong enough to overcome the attractive force of the predator, and thus, the prey group survive. Such survival strategies of predator confusion have also been observed in nature, for example, the hunting behavior of wolves shows that they eventually give up their pursuit after some initial runs (after failed attempts)37. Our analysis, thus, indicates that a certain threshold number of interacting prey is required for coordinated movement to escape away from the predator. Figure 3b shows how each prey on an average interacts with the number of an existing fraction of the population within a given interaction radius while on the chase. As seen, for smaller radius, the interacting prey number is very small; the number increases with increasing ({R}_{{rm{i}}nt}), and after a certain threshold radius, each prey interacts almost with the entire group.

(a) Survival probability, (eta ), of the prey group as a function of time, (T), for different interaction radius, ({R}_{{rm{i}}nt}), and also for the case when all prey interact with each other, ({R}_{{rm{i}}nt}={rm{a}}ll), keeping the predator strength constant at ({delta }_{0}=2.5). (This is a representative plot and the same initial configuration has been used to simulate the time evolution for different values of ({R}_{{rm{i}}nt})). (b) Contour plot of the number of interacting prey on an average within an interaction radius, ({R}_{{rm{i}}nt}), normalized by the surviving prey number at that instant as a function of time, T, keeping the predator strength, ({delta }_{0}=2.5). (The color bar indicates the normalized value of the average interacting prey number , e.g., the value ‘1’ means that each prey on an average is interacting with the entire existing group whereas ‘0’ means non-interacting prey).
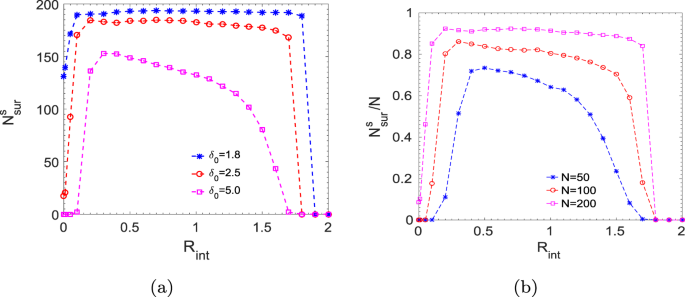
Further, we study the number of survived prey at steady state, ({N}_{{rm{s}}ur}^{s}), as a function of interaction radius, as shown in Fig. 4. We have simulated the dynamics for a long time ((T=2000)) to ensure that it has reached a steady-state so that the number of survived prey does not change over time. Moreover, averaging has been done over two hundred such simulation results starting from different initial configurations. It can be seen from the plot that very short-range and long-range interactions are unfavourable for the prey group survival, however, within an intermediate regime, the survival of the group is maximum. In addition, survival depends on the prey group size and also on the strength of the predator. In Fig. 4(a), we keep the initial number of prey at (N=200), and vary the strength of the predator, ({delta }_{0}). It is observed that stronger the predator, lesser the number of survival because the initial catch by the predator is higher for the stronger predator. So the prey interacts in a larger interaction radius to have an adequate number of interacting prey to initiate a coordinated escape and thus, the lower threshold value of ({R}_{{rm{i}}nt}) for the survival of the prey shifts to the larger value with increase in the predator strength. An upper threshold value of ({R}_{{rm{i}}nt}) is determined by the range where each prey starts to interact with almost all existing prey in the group. We now investigate the dynamics by varying the initial prey group size, (N), while keeping the strength of the predator constant at ({delta }_{0}=2.5). As seen in Fig. 4(b), survival chances of the group increase with an increase in the prey group size when attacked by a predator of the same strength. Larger the prey group size, the predator gets more confused as it becomes difficult to focus on any particular member among a large group of prey. Hence, it effectively reduces the strength of the predator, and thus, the survival chances also go up as has been observed in different field studies26,38. Further, in the case of a smaller prey group size, the number of prey on an average interacting within a certain radius is also small. Hence, prey requires to interact comparatively in a larger radius such that the number of interacting prey would be sufficient to establish a coordinated movement to escape away from the predator. So, the lower threshold value of ({R}_{{rm{i}}nt}) for the survival shifts to the higher value as we decrease the prey group size. Moreover, the optimal survival regime also depends on the strength of interactions within the prey group. With the increase in long-range attraction strength (denoted by ({beta }_{0}) in our model), the prey group becomes more and more cohesive, and thus, becomes more vulnerable as the predator could easily track and catch the whole group. On the other hand, decreasing the attraction strength, ({beta }_{0}), helps the prey group to survive up to a larger interaction radius. (For example, keeping the predator strength constant at ({delta }_{0}=2.5), if ({beta }_{0}) value is increased from 1 to 2; then the prey group gets killed even at a smaller radius, ({R}_{{rm{i}}nt}=1.5). Using the same predator strength, if we reduce ({beta }_{0}) to 0.5, all members of the prey group get caught at ({R}_{{rm{i}}nt}=2.8).) Further, if we reduce the attraction strength, ({beta }_{0}mathrm{=0}), then prey-prey repulsion and prey-predator repulsion make the prey group scatter away and survive. Our study, thus, shows that the survival and the escape dynamics depend on the nature of interactions of the prey group and the predator.

(a) Number of survived prey (({N}_{{rm{s}}ur}^{s})) as a function of the interaction radius, ({R}_{{rm{i}}nt}), for different predator strength, ({delta }_{0}=1.8), (2.5), and (5.0) keeping initial group size (N=200). (b) Fraction of survived prey number, (({N}_{{rm{s}}ur}^{s}/N)), as a function of the interaction radius, ({R}_{{rm{i}}nt}), for different initial prey group size, (N=mathrm{50,100}), and (200) keeping ({delta }_{0}=2.5).
Moreover, to analyze the collective ordering of the prey group while on escape, we study the spatial correlation in velocity fluctuations as described by39,40,
$$C(R)=frac{sum _{i,j}delta {hat{V}}_{i}mathrm{}.delta {hat{V}}_{j}delta (R-{R}_{ij})}{sum _{i,j}delta (R-{R}_{ij})};$$
(6)
where (delta {hat{V}}_{i}=frac{delta {overrightarrow{V}}_{i}}{|delta {overrightarrow{V}}_{i}|}) is the unit vector along the direction of velocity fluctuation and (delta {overrightarrow{V}}_{i}={overrightarrow{V}}_{i}-{overrightarrow{V}}_{{rm{a}}v}) is the fluctuation in velocity of the (i)’th prey. ({overrightarrow{V}}_{{rm{a}}v}) is defined as the mean velocity, ({overrightarrow{V}}_{{rm{a}}v}=frac{1}{N}{sum }_{i}{overrightarrow{V}}_{i}), and ({R}_{ij}=|{overrightarrow{R}}_{i}-{overrightarrow{R}}_{j}|) denotes the distance between a each pair of prey. Here, (C(R)) characterizes how the individual prey behaviour deviates from the average behaviour of the group. Figure 5 shows some representative plots of the spatial correlation, (C(R)), among the prey group for different interaction radius, ({R}_{{rm{i}}nt}), at different time instances. As shown in Fig. 5(a,b), within the survival regime of the prey-prey interaction, e.g., at ({R}_{{rm{i}}nt}=0.5) and (1.2), the spatial correlation among prey increases with time. However, as shown in Fig. 5(c), for longer interaction range at ({R}_{{rm{i}}nt}=2.0), representing the non-survival regime, as all prey interact and move cohesively while chased by the predator, the ordering extends over the entire spatial domain of the group for the whole time period (till the time all prey are killed; here, further time instances are not shown as all prey are killed). We also calculate the correlation length, (xi ), for which (C(R=xi )=0), to measure the average size of the correlated domain within the prey group in the survival regime. Figure 5(d) presents the correlation length, (xi ), as a function of reaction radius ({R}_{{rm{i}}nt}). As seen, (xi ) increases with increasing ({R}_{{rm{i}}nt}) implying prey becomes more and more correlated with increase in interaction radius. However, with further increase in ({R}_{{rm{i}}nt}), (xi ) starts decreasing as the prey group split up into subgroups to escape away from the predator; thus, the correlated domain size decreases.

(a–c) Show spatial correlation in velocity fluctuation, (C(R)), at different time instances for different interaction radius, ({R}_{{rm{i}}nt}=0.5), (1.2), and (2.0) respectively. (d) Correlation length, (xi ), as a function of the interaction radius, ({R}_{{rm{i}}nt}), for different time. (The predator strength is kept at ({delta }_{0}=2.5) and the initial prey group size, (N=200).).
Source: Ecology - nature.com


