Area-specific dengue cases in Hong Kong
After the first local case of dengue fever was discovered in 2002, a large dengue outbreak occurred in the same year and another in 2018 while sporadic cases mainly occurred between 2014 and 2017. We divided Hong Kong into 3 areas: (i) New Territories-South (NTS), (ii) New Territories-North (NTN), and (iii) Hong Kong Island & Kowloon (HKL), based on the administrative districts, the population density, and the usage of the Mass Transit Railways (see Methods). The existence of spatial heterogeneity of dengue infections was observed between the defined areas (Fig. 1 and its inset). For example, HKL and NTS together consisted of all the infections during 2018 outbreak, while HKL and NTN contained all the sporadic cases from 2014 to 2017. Note the special case of the year 2002 when 17 out of 20 locally acquired dengue cases, which included one case transmitted via blood transfusion, were all located around a construction site on an island geographically at the centre of the three areas (shown in red in Fig. 1). After the blood transfusion case was removed, the remaining cases were equally assigned to the three areas with one extra case assigned to NTN.
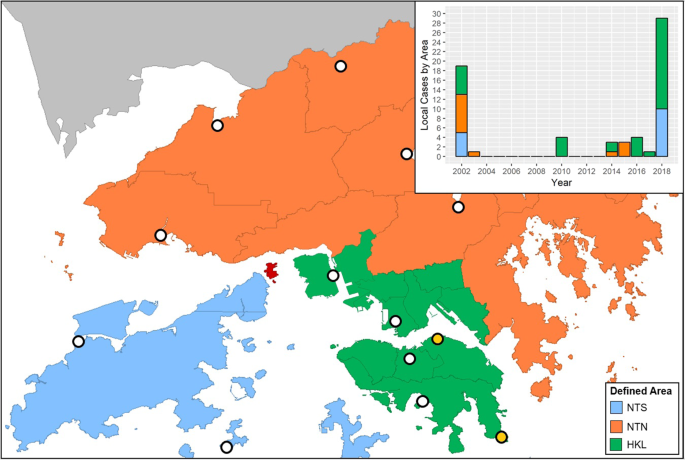
The area division: New Territories – South (NTS; light blue), New Territories – North (NTN; orange), and Hong Kong & Kowloon (HKL; green) along with the selected automatic weather stations (white circles) and rainfall stations (light yellow circles). The grey lines indicate the official district borders. As Ma Wan Island (red) is located at the center, all the 17 non-blood transfusion cases on that island are assigned into the 3 areas in our study: 5 cases in NTS, 6 cases in NTN, and 5 cases in HKL. The inset provides annual local case numbers from 2002 to 2018.
Climate predictors selection
In order to select suitable climate parameters for area-specific annual dengue forecasting, we compared 4 models with different combinations of temperature (either monthly mean or minimum; indicated by Tmean or Tmin) and rainfall (either monthly total or maximum; indicated by Rtot or Rmax). These climate parameters were suggested by the prior studies conducted in nearby countries8,26,27, but their association with recent dengue outbreaks in Hong Kong is still unknown and the effects of rainfall on dengue spreading are mixed. Furthermore, spatial differences in the climate data were not considered when the effects of monthly climate predictors were analysed8. Thus, all the climate data within the studied years from 2002 to 2018 were retrieved from 11 weather stations and 2 automatic rainfall stations across the defined areas (white and yellow circles Fig. 1), with the averages from January to August shown in Fig. 2. In general, the highest temperatures and the highest rainfalls were recorded between June and August and after April, respectively.
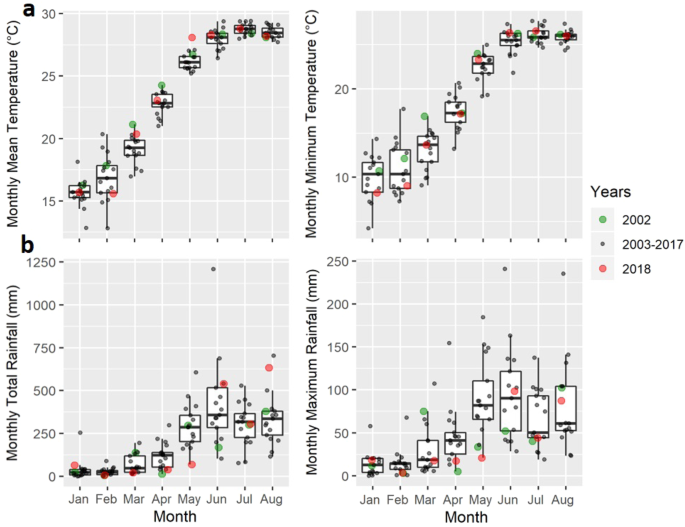
The monthly climate data for the whole of Hong Kong from 2002 to 2018. (a) Monthly mean and monthly minimum temperature, and (b) monthly total and monthly maximum rainfall from January to August for the years 2002, 2003–2017 combined, and 2018 are shown. Climate data were retrieved from 11 weather stations and 2 automatic rainfall stations across the three pre-defined areas.
Since most of the local (indigenous) dengue cases occurred during the summer seasons starting in or after August (Fig. 3) and in Hong Kong mosquitoes are not commonly observed during the winter until March28,29, for each combination of climate parameters we used monthly climate predictors (Fig. 4) from March to August in the 3 defined areas to forecast area-specific annual dengue cases using a Poisson mixed effects model. The predictors were first normalised in order to compare the effects between each predictor. The stepwise algorithm based on the Akaike Information Criterion with a correction (AICc) was used to select the monthly predictors for each model (Supplementary Table S1). The best-fitting model was determined according to both the AICc and Bayesian Information Criterion (BIC).
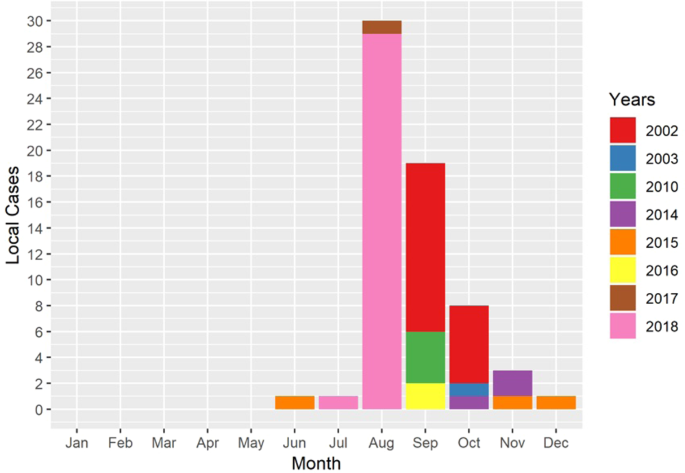
The number of monthly reported local dengue cases from 2002 to 2018. Different colours represent the number of dengue cases in different years.
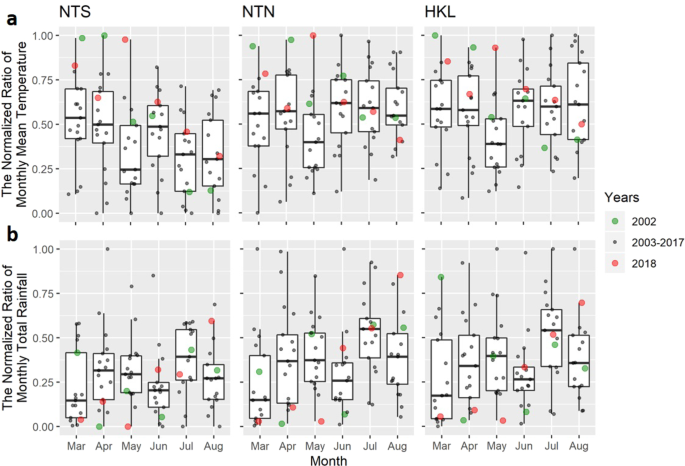
The normalised climate predictors for each area using (a) the monthly mean temperature and (b) the monthly total rainfall. The areas NTS, NTN, and HKL are defined as in Fig. 1.
Area-specific annual dengue forecasting
The results showed that the models with the Tmean climate parameters set performed better than the models with the Tmin parameters (Table 1). The best-fitting model, Model: Tmean + Rtot was used as our predictive model for dengue cases while Model: Tmean + Rmax was used as an alternative model as both the △AICc and △BIC results were equal to only 1 for Model: Tmean + Rmax. The best-fitting model estimated using the Laplace approximation is given by:
$$begin{array}{lll}{rm{log }},({mu }^{i}) & = & -6.2+3.594times {T}_{3}^{i}+2.542times {T}_{4}^{i}+1.21times {T}_{5}^{i}+10.072times {T}_{7}^{i} & & -4.002times {R}_{4}^{i}-4.029times {R}_{5}^{i}-8.047times {R}_{6}^{i}+{alpha }^{i}end{array}$$
(1)
where the standard deviation of the random intercepts σ = 0.789. A significance test was performed for each fixed effect predictor using the likelihood ratio test. P-values were less than 0.05 for 8 out of 9 regression coefficients (Table 2). The random intercepts represent different levels of effects resulting from unobserved area-specific factors, which may include varying land usages or population densities between different areas.
The model performance was evaluated using leave-one-out cross-validation (LOOCV) and leave-one-year-out (also called leave-three-out) cross-validation (LOYOCV). For LOOCV, the observation in one area in a given year was removed before refitting the model. The best-fitting model successfully predicted the major outbreaks by year and by area using LOOCV (Fig. 5a–c, Supplementary Table S2 and Supplementary dataset S1). 42 out of a total of 51 (82.4%) total observations by year and by area (annual incidence rates in 17 years and 3 areas) were within the 95% confidence interval of the annual incidence predicted by our model. Note that the upper and the lower bounds of the confidence intervals were rounded to the nearest integer when assessing the prediction accuracy of observations in Table S2. 5 out of 6 observations of area-specific outbreaks in 2002 and 2018 were able to be predicted. Although the 2018 outbreak in NTS was not predicted, the model still identified an outbreak (defined as the annual number of dengue cases > 2) in that area. When LOYOCV was used, the model predicted outbreaks (defined as the annual number of dengue cases > 2) in 5 years (i.e., the years 2002, 2003, 2007, 2015 and 2018), which include the two major outbreak years (2002 and 2018) and a year with sporadic cases (2015) (Fig. 5d).
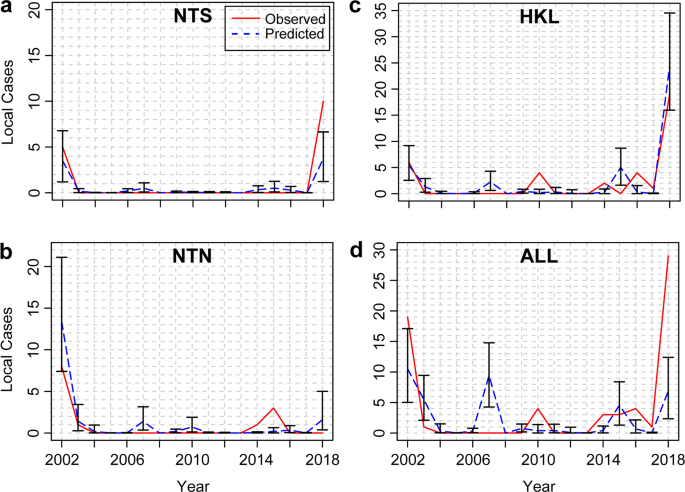
Comparison between observed and predicted number of annual dengue cases. (a–c) Observed and predicted number of annual dengue cases in each pre-defined area (NTS, NTN, and HKL) with 95% confidence intervals using leave-one-out cross-validation. The predicted values represent the mean of the Poisson distribution of the annual dengue cases in each area, estimated using a generalized linear mixed model with a restricted maximum likelihood method. (d) Observed and predicted number of annual dengue cases in the whole Hong Kong area (ALL) with 95% confidence intervals using leave-one-year-out cross-validation.
The best-fitting model produced an MSEtr of 0.592, an MSEva of 3.538 and an MSEratio (MSEva∕MSEtr) of 5.976 using LOOCV (Table 3). Both the MSEva and the MSEratio of the best-fitting model were the lowest compared with the alternative (Model: Tmean + Rmax), fixed effects (same predictors as the best-fitting model but without random effects), and full models, indicating the best prediction performance among all the tested models. The alternative model using Tmean and Rmax produced an MSEtr of 0.672 and an MSEva of 5.143, which confirmed that the chosen best model fitted the data better than the alternative. The fixed effects model performed similarly to but slightly worse than the best-fitting model. The full model, including all predictors, had the lowest MSEtr value but the highest MSEva and the highest MSEratio, indicating an overfitting phenomenon. The best model also performed better than the other models when the Normalised Mean Squared Error (NMSE) was used. When LOYOCV was used, the MSEratio (12.629) of the best-fitting model was slightly higher than that obtained from LOOCV results. Although the fixed effects model can perform similarly or slightly better according to the MSEva (or NMSEva), the best-fitting model performed better than the other models according to the MSEratio (or NMSEratio) (Supplementary Table S3). These results demonstrate that while working with a small number of dengue observations in Hong Kong, a mixed effects model with AICc-selected variables can reduce model overfitting.
Effects of climate variables
The predictive model showed that all monthly mean temperature predictors (T3, T4, T5, and T7) were positively correlated with the number of annual cases, while monthly total rainfall predictors (R4, R5, and R6) were all negatively correlated. These behaviors were also found in the stepAICc results of the other 3 models with different climate parameter sets (Supplementary Table S1), confirming the positive correlations of the temperature and the negative correlations of the early rainfall predictors with the number of annual cases. Among all the temperature predictors, T7 (the mean temperature in July) was the most significant predictor (p < 10−8) and its regression coefficient had the highest magnitude, indicating the strongest effect. The coefficients of the 3 rainfall predictors (from April to June) were of similar magnitude, indicating a much longer delayed effect of rainfall compared to temperature. In the NTS and HKL areas, relatively high values for T3, T5, and T7 and relatively low values for R4 and R5 were found in 2018, which may explain the the outbreak in 2018 in those two areas.
We further examined the marginal effects of the 4 predictors (T7, R4, R5, and R6) with the greatest magnitude of regression coefficients on the relative risk RR (Supplementary Fig. S1). RR was defined as the number of annual cases divided by the average number of annual cases. Marginal effects of the collected temperature (without normalization) (T{prime} ) and rainfall (R{prime} ) (without normalization) were also obtained after refitting the same model (Supplementary Fig. S2). If the rainfall is lower than 200 mm (per month) between May and June, or lower than 100mm in April, a higher relative risk of dengue incidence is observed.
Source: Ecology - nature.com
