Data collection and sample sizes
We collected 10–15 ornamental feathers (3–5 from each of the three ornamental areas—crown, breast, and rump, Fig. 1 in ref. 59) from 1196 free-living adult male house finches. To minimize temporal variation of feather wear and standardize sampling across long-term study populations, we only used feathers sampled during May–June from 2008 to 2018. Captures and sampling were conducted under US Federal Permit (23182) and annual permits for the states of Arizona and Montana. All animal procedures were approved by the University of Arizona Institutional Animal Care and Use Committee (13-423). To ensure sufficient sample sizes for some analyses, we combined populations that shared colonization age and routes (Fig. 3) to nine regions as shown in Supplementary Table 1, which also lists the curated dataset used in all analyses.
Each collected feather was digitized with a modified Epson Perfection 1660 PhotoScanner (Long Beach, CA, USA) at 1000 dpi and also examined under a Nikon Eclipse Ti-E inverted light microscope (Nikon, Tokyo, Japan). Following assessment of feather microstructure, we extracted 19 carotenoid compounds from the pigmented parts of these feathers and obtained concentrations of these carotenoids by HPLC23 (µg/g of pigmented feathers, Supplementary Data 1 and 2). Feathers within each ornamental area of each individual were combined for carotenoid extraction and analyses.
Carotenoid extraction and quantification
Feathers were trimmed, and the weighed pigmented portions were washed in hexane using Whatman GF/A glass filters and finely ground in 3 mL methanol for 10 min at 20 Hz using a Retsch MM301 mixer mill (Newtown, PA), equipped with ZrO grinding jars and balls. Carotenoids were extracted using a 0.2 µm filter (GHP Arcodisc 13 mm Minispike; Pall Life Sciences, East Hills, NY) and the filtrate was dried under vacuum at 40 °C and reconstituted in 150 µL of HPLC mobile phase (methanol:acetonitrile 50:50, v/v).
Carotenoids were quantified by injecting 50 µL of pigment extract into an HPLC System (Shimadzu Corporation, Pleasanton, CA) fitted with an YMC Carotenoid 5.0 µm column (250 × 4.6 mm) and guard column (YMC America, Allentown, PA). Analytes were eluted at a constant flow rate of 1.1 mL/min using isocratic elution with 42:42:16 (v/v/v) methanol:acetonitrile:dichloromethane for the first 11 min, followed by linear gradient up to 42:23:35 (v/v/v) methanol:acetonitrile:dichloromethane through 21 min, isocratic elution at this condition until 30 min when it returned with step function to the initial isocratic condition at which it was held until 40 min. Carotenoids were detected using a Shimadzu SPD-M10AVP photodiode array detector, and data were collected from 200 to 800 nm. Peak areas were integrated at 450 or 470 nm depending on the absorbance maximum (λ max) for each compound.
Carotenoid identification
Fifteen μg/mL stock solutions of pure powdered carotenoid compound dissolved in a mobile phase of 50:50 methanol:acetonitrile were made for 3′-hydroxy-echinenone, 3′-dehydrolutein, α-carotene, adonixanthin, adonirubin, astaxanthin, β-carotene, β-cryptoxanthin, canthaxanthin, echinenone, lutein, retinol, rubixanthin, tocopherols, vitamin D, and zeaxanthin. Five serial dilutions of each carotenoid standard (15, 7.5, 3.75, 1.875, and 0.9375 μg/mL) were run individually through the same HPLC protocol as used for the feather samples above. The serial dilutions enabled us to identify the unique shape of a standard’s peak and determine whether the retention time of a standard shifts in different concentrations. Following the identification of the standard peaks, over 20 unique mixtures of 4–5 known standards of known concentrations were run through the same HPLC protocol as the feather samples to assess how the peaks of different compounds separate when mixed with other compounds, since this is how they are analyzed in the feather samples. As a result of these trials, peaks in feather samples were assigned to compounds based on three key, repeatable features: retention time in the chromatogram, relative retention time to other peaks in the sample, and the shape of the peak.
For fourteen carotenoid compounds, the concentrations of compounds (µg/g) were calculated using calibration curves of these standards (Sigma-Aldrich, St. Louis, MO; Indofine Chemical, Hillsborough, NJ; CaroteNature, Ostermundigen, Switzerland; Santa Cruz Biotechnology, Dallas, TX). For five compounds without available standards, concentrations were derived based on biochemical structural similarity to known standards as follows: the peaks of canary xanthophyll A and canary xanthophyll B were identified based on their proximity to the known peak of 3′-dehydrolutein, 4-oxo-rubixanthin was the peak that appears in the rubixanthin standards when they are exposed to oxygen, the peak for gaziaxanthin was identified based on its proximity to the known peaks of rubixanthin and 4-oxo-rubixanthin, the peak for β-isocryptoxanthin—based on its proximity to the known peak for β-carotene, and the peak for α-doradexanthin—based on its structural similarity to canthaxanthin. We used the serial dilutions to calculate the concentration equation for each standard. The equation was derived from a linear regression of the area of the peaks at the five known concentrations (15, 7.5, 3.75, 1.875, and 0.9375 μg/mL). The concentration of a compound in a feather sample was determined by entering the area of its peak into the equation for its corresponding standard. Supplementary Data 1 and 2 list prevalence of identified carotenoids in feathers (% of individuals), mean and range of their concentration, proportion of the total amount of carotenoids in pigmented feather, and coefficient of variation of that proportion.
Carotenoid grouping
Carotenoids were grouped into three categories based on their metabolic derivation and connectivity (Supplementary Fig. 1). Dietary carotenoids (external carotenoids deposited into feathers unmodified) are lutein, (3R,3′R)-zeaxanthin, β-cryptoxanthin, α-carotene, gazaniaxanthin, rubixanthin, and β-carotene. Metabolically-derived, nondegenerate carotenoids (those derived from a single dietary compound through 1–2 reactions) are canary xanthophyll A, canary xanthophyll B, β-isocryptoxanthin, echinenone, 4-oxo-rubixanthin, and a-doradexanthin. Metabolically-degenerate carotenoids (those derived from two or more biochemical pathways of similar lengths starting from more than one dietary precursor) are (3S,3′R)-adonixanthin, adonirubin, (3S,3′S) astaxanthin, 3′-dehydrolutein, 3′-hydroxy-echinenone, and canthaxanthin (Supplementary Fig. 1). Although canary xanthophyll B can be produced by pathways starting from two dietary compounds (Supplementary Fig. 1), comparison of the flux of a one-reaction-long path from dietary lutein compared with the flux of two-reactions-long path from dietary zeaxanthin showed that this compound is overwhelmingly produced only by transformation of lutein60. We thus categorized canary xanthophyll B as nondegenerate carotenoid for analyses in Figs. 6 and 7.
Feather differentiation
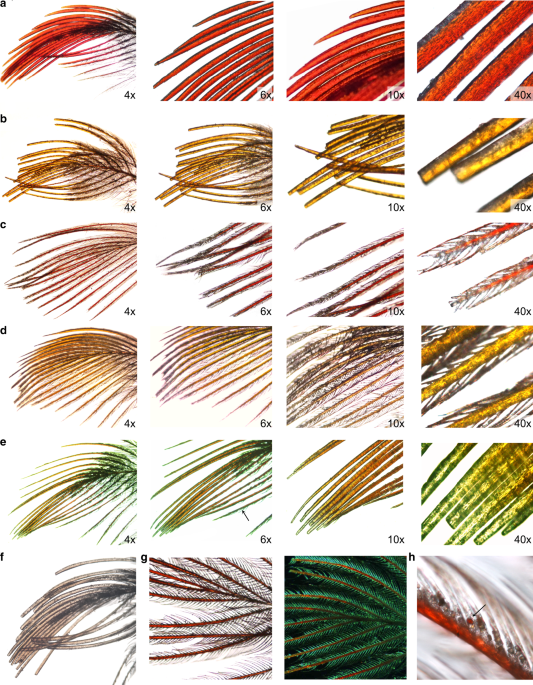
Differentiation of collected feathers was assessed in two ways. First, using high resolution scans of all feathers, we examined the microstructure of four feathers from each ornament to derive a mean score of barbule loss within each ornamental area of each bird (Supplementary Data 3, see below). Second, we examined one feather from each ornament of n = 217 males under a light microscope at ×4, ×6, and ×10 magnifications. For n = 651 feather samples in this subset, we assigned a barbule loss score to confirm reliability of the first method, and also measured the proportion of the barb that did not develop barbules relative to total barb length to derive percentage of barbule loss. We then measured barb width at the base, middle and distal tip of barb (Supplementary Data 3). All measures of differentiation were performed on the two most distal, innermost barbs. We assigned a measure of differentiation as follows: 0—no response: full structure, barbules from base to tip (Fig. 1c, d), including feathers with full structures, but partially broken barbules, 1—partial response: partial structure, some barbules developed while others did not separate from barb (Fig. 1e), 2—full response: no barbules present (Fig. 1a, b). All measures of barbule loss were performed by a single observer. The measurement error, assessed in repeated measures of a subsample of 40 crown feathers using one-way ANOVA was less than <5% of the individual identity effect (mean squares 0.06 vs. 1.24).
Assessment of distribution shape and 50% response threshold
To derive response curve and response threshold values, we needed a technique that would accommodate continuity in response assessments (values 0–2), but also discreteness of these categories. Further, the method needed to accommodate differences in the response distribution—e.g., threshold vs. linear, symmetric around zero vs. accelerating. Thus, we used PROC PROBIT in SAS 9.4, which satisfies these requirements, to calculate the threshold response (our L50 parameter is LD50 probability value in PROC PROBIT), parameter estimates, and the response distribution patterns. The procedure obtains and compares maximum likelihood estimates from linear, probit, logit, ordinal logistic, and accelerating value regression models. Supplementary Data 4 lists calculated threshold response (L50) for the best fit models. Supplementary Fig. 3 outlines the sequence of tests for comprehensive assessment of response threshold and shape.
Assessment of scaling and deviation from scaling
A change in the shape of feather response in relation to carotenoid concentration can be due to changes in the threshold of concentration that causes a 50% response in a population or changes in the shape of this response (Supplementary Fig. 3). A change in shape can be caused either by a scaling of response—e.g., stretching or compression of the x-axis (carotenoid concentration) associated with L50 value (Supplementary Fig. 3c) or a different pattern of response—such as linear or sigmoid (Supplementary Fig. 3d). To identify changes in the response curve that were produced by simple rescaling of population- and ornament-specific responses to carotenoid uptake (e.g., when twice higher concentration is associated with the same percentage of response in one population vs. another), we applied Kolmogorov–Smirnov (K–S) tests to residuals from an AFT regression model, as implemented in PROC PHREG of SAS 9.42. We fitted the regression model to each ornamental area separately, with all study populations combined, but kept identity of populations for regression grouping (Supplementary Fig. 4). The AFT model is particularly appropriate for our analyses because it assumes a parametric form for both the feather response and carotenoid uptake. We then used the K–S test to assess the probability that K–S maximum distance (Supplementary Data 4, double-headed arrow on Fig. 7 inset) between estimated distribution function (EDF) and observed scaling function are obtained by chance. We derived EDFs of feather responses separately for residuals of each population, relative concentration of each carotenoid, and ornament area and then compared these EDFs with observed scaling functions with the K–S framework implemented in PROC NPAR1WAY of SAS 9.42 for two class comparisons. The procedure computes the maximum deviation of the EDFs and outputs values where the maximum deviation occurs, the two-sample K–S statistic D and associated probability that D is greater than the observed value under the null hypothesis of no difference between the two distributions. Across all ornamental areas, |K–S max distances| ≥ 1.49 were different from 0 under P < 0.05 (Supplementary Fig. 4), such that responses with |K–S| < 1.49 come from the same underlying distribution and differ only by rescaling the concentration of carotenoids needed for response, whereas residuals above dashed line in Fig. 7 correspond to responses that differ more than just in sensitivity of response to concentration (Supplementary Fig. 3, all data and tests in Supplementary Data 4).
Assessment of anticipatory and induced response
To measure organism-wide coordination of feather response, i.e., the indirect effects of carotenoids accumulated in other feathers on feather response in a focal area (e.g., paths c1 → t2, c2 → t3 in Fig. 4), we needed a technique that would allow us to directly compare responses even though they might come from different distributions (e.g., linear vs. threshold; Supplementary Data 4). This ruled out commonly used multiple least-square regression models or structural equation models (e.g., path analysis). We instead used a new procedure for indirect response comparison implemented in logistic regression models of SAS 9.4.
The plots of (1-specificity) by sensitivity form the receiver operating characteristic (ROC) curves (Fig. 8 inset). Diagonals of these plots correspond to an area under the curve (AUC) of 0.5 and represents the area where the fraction of true positives and false negatives are equal and hence the effect is not different from random. The new ROCCONSTRAST procedure in PROC LOGISTICS of SAS 9.42, uses a nonparametric test to compare AUC and associated probabilities, allowing direct comparisons of AUC that come from different distributions (e.g., Supplementary Fig. 5). For each carotenoid compound, we used a focal feather response as a reference point, and compared indirect effects of carotenoids influencing response of feathers in a focal ornament (e.g., c1 → t1, Fig. 4) to the feather response in other ornaments. Values significantly different from 0.5 (and thus nonrandom) are reported in Supplementary Data 4. Figure 8 plots absolute amounts by which these significant values exceed 0.5.
Reporting summary
Further information on research design is available in the Nature Research Reporting Summary linked to this article.
Source: Ecology - nature.com
